RUBY MILLS, Easy 75%From a technical standpoint, Ruby Mills appears robust. Touching the support line for the fifth time and experiencing a notable increase last week indicate signs of reversal. My target is to achieve a profit of 75-100% from the current market price. Although there was a false breakout previously, I
11.25INR
352.26 MINR
2.54 BINR
7.07 M
About RUBY MILLS LTD.
Sector
Industry
CEO
Purav Hiren Shah
Website
Headquarters
Mumbai
Employees (FY)
191
Founded
1917
ISIN
INE301D01026
FIGI
BBG000CYTRX4
Ruby Mills Ltd. engages in the manufacturing of textile and renting of properties. It operates through the Textile and Real Estate segment. Its products include fabrics, industrial textiles, institutional supply, functional textiles, and fancy fabrics. The company was founded in 1917 and is headquartered in Mumbai, India.

Ruby MillsLooks good for long
Every dip is a buy
Moving above all averages, weekly BO
Channel upwards

RUBYMILLS Swing TradeRUBYMILLS
Buy : 235.5
Target : 259
*DISCLAIMER*
This analysis is only for educational purpose. I am not a SEBI Registered Analyst/Advisor. Please consult your financial advisor before taking any position and please use a Stop Loss for any Investments/Trading Positions. It is your hard earned mon

RUBYMILLS Bullish; above 249 on Wednesday 9 Aug for IntradayPlease check out the INTRADAY Trading Strategy in the COMMENTS section below during the live market hours:
---------------------------------------------------------------------------------------------------------------------
1) Impulse upmove stage: The strong upmove (nearly upto 2% from breako

Ruby Mills Analysis Stock is near to BO zone on weekly TF, volume rising, follow chart for proper support and resistance levels.

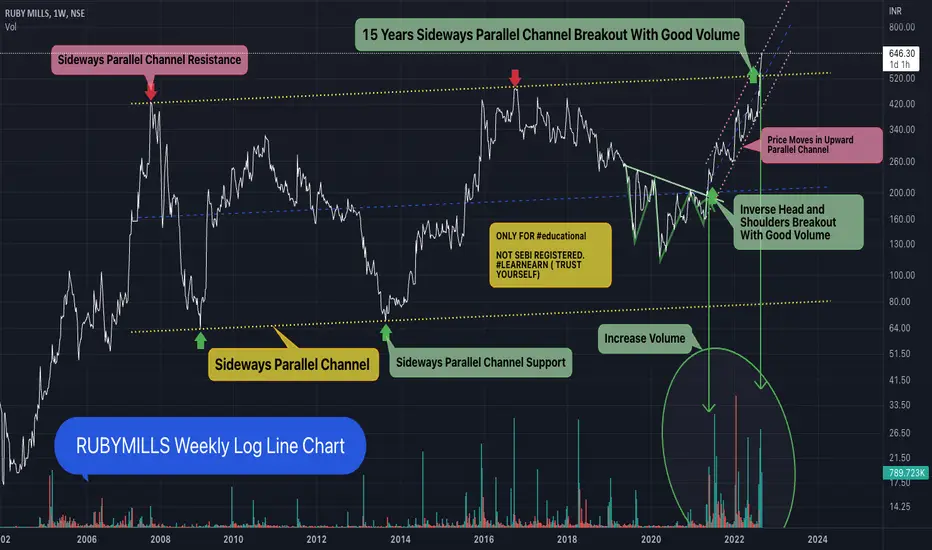
15 Years Sideways Parallel Channel Breakout at RUBYMILLS15 Years Sideways Parallel Channel #Breakout at #RUBYMILLS (Ruby Mills Ltd). Its #Outperformed #Nifty.
BSE: 503169 / NSE : RUBYMILLS
What Is the Inverse #headandshoulders ?
An inverse head and shoulders, also called a "head and shoulders bottom", is similar to the standard head and shoulders pa
15 YEARS OF CUP RUBY MILLSRuby Mills
Given multi year breakout with great volume'
one can buy for positional trade or long term investment
Cmp 616
SL 450
TG 700
750 , 800

53% returns in just 19 days fire 🔥🔥🔥This scrip was posted in this platform and so far it has given 53% returns in just 19 days. I hope our followers had benefited from this post. Thanks to all for your support 💪💪

Breakout in Ruby Mills...Chart is self explanatory. Levels of breakout, possible up-moves (where stock may find resistances) and support (close below which, setup will be invalidated) are clearly defined.
Disclaimer: This is for demonstration and educational purpose only. This is not buying or selling recommendations. I am

Weekend pick: Ruby MillsWeekend time, weekend chart!
Chart -> Ruby Mills Weekly
518 to 450 was a 5-year-old resistance area, and this week stock has given closing above that resistance. Look at the volume buildups too!
CMP: 550
Good range: 450to500
Targets: 940
SL: 377
Disclaimer: This is for educational purposes only,

See all ideas
Trade directly on the supercharts through our supported, fully-verified and user-reviewed brokers.


Frequently Asked Questions
The current price of RUBYMILLS is 203.95 INR — it has increased by 0.89% in the past 24 hours.
Depending on the exchange, the stock ticker may vary. For instance, on BSE exchange RUBY MILLS LTD. stocks are traded under the ticker RUBYMILLS.
RUBY MILLS LTD. is going to release the next earnings report on May 29, 2024. Keep track of upcoming events with our Earnings Calendar.
RUBYMILLS stock is 3.28% volatile and has beta coefficient of 0.92. Check out the list of the most volatile stocks — is RUBY MILLS LTD. there?
Yes, you can track RUBY MILLS LTD. financials in yearly and quarterly reports right on TradingView.
RUBYMILLS stock has risen by 1.97% compared to the previous week, the month change is a 7.40% rise, over the last year RUBY MILLS LTD. has showed a 9.39% increase.
RUBYMILLS net income for the last quarter is 110.91 M INR, while the quarter before that showed 80.69 M INR of net income which accounts for 37.44% change. Track more RUBY MILLS LTD. financial stats to get the full picture.
Today RUBY MILLS LTD. has the market capitalization of 6.76 B, it has decreased by 0.43% over the last week.
Yes, RUBYMILLS dividends are paid annually. The last dividend per share was 1.25 INR. As of today, Dividend Yield (TTM)% is 0.62%. Tracking RUBY MILLS LTD. dividends might help you take more informed decisions.
RUBY MILLS LTD. dividend yield was 0.83% in 2022, and payout ratio reached 11.87%. The year before the numbers were 0.93% and 16.16% correspondingly. See high-dividend stocks and find more opportunities for your portfolio.
Like other stocks, RUBYMILLS shares are traded on stock exchanges, e.g. Nasdaq, Nyse, Euronext, and the easiest way to buy them is through an online stock broker. To do this, you need to open an account and follow a broker's procedures, then start trading. You can trade RUBY MILLS LTD. stock right from TradingView charts — choose your broker and connect to your account.
As of Apr 24, 2024, the company has 191.00 employees. See our rating of the largest employees — is RUBY MILLS LTD. on this list?
Investing in stocks requires a comprehensive research: you should carefully study all the available data, e.g. company's financials, related news, and its technical analysis. So RUBY MILLS LTD. technincal analysis shows the buy rating today, and its 1 week rating is sell. Since market conditions are prone to changes, it's worth looking a bit further into the future — according to the 1 month rating RUBY MILLS LTD. stock shows the neutral signal. See more of RUBY MILLS LTD. technicals for a more comprehensive analysis.
If you're still not sure, try looking for inspiration in our curated watchlists.
If you're still not sure, try looking for inspiration in our curated watchlists.
EBITDA measures a company's operating performance, its growth signifies an improvement in the efficiency of a company. RUBY MILLS LTD. EBITDA is 509.94 M INR, and current EBITDA margin is 18.57%. See more stats in RUBY MILLS LTD. financial statements.