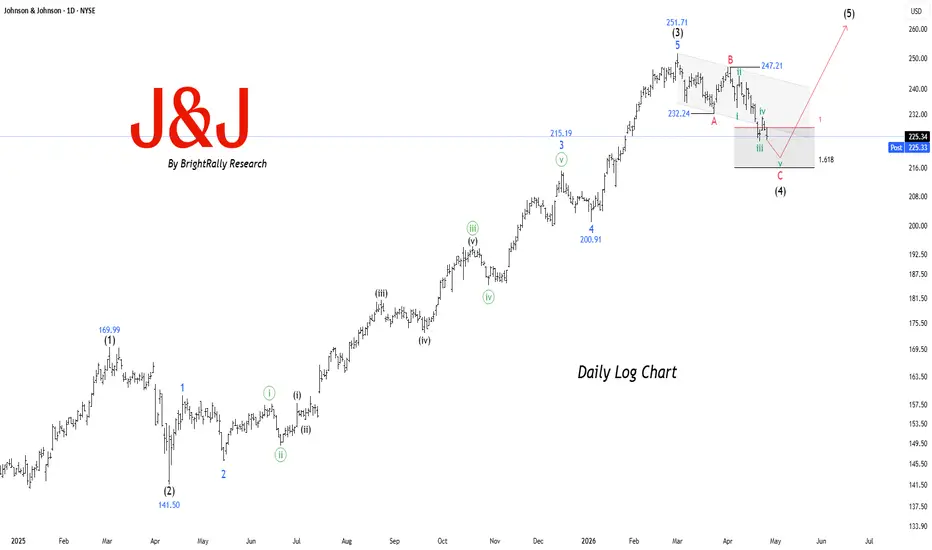
NSE JNJ - Elliott Wave Correction Targeting 258 UpsideJohnson & Johnson is in a Wave (4) correction after completing a strong impulsive Wave (3) near the 250 zone. The current move looks like an A–B–C pullback, with price slipping below 232 and heading toward deeper support. This correction remains healthy within the larger uptrend and does not damag
Johnson & Johnson
No trades
No trades
Compare with Johnson & Johnson
7.65 EUR
22.82 B EUR
80.18 B EUR
2.41 B
Next report date
—
Report period
—
EPS estimate
—
Revenue estimate
—
Company info
Sector
Industry
CEO
Joaquin Duato
Website
Headquarters
New Brunswick
Founded
1887
IPO date
Sep 25, 1944
ISIN
US4781601046
CUSIP
478160104
Identifiers
ISIN US4781601046
Johnson & Johnson is a holding company, which engages in the research and development, manufacture and sale of products in the health care field. It operates through the following segments: Consumer Health, Pharmaceutical, and Medical Devices. The Consumer Health segment includes products used in the baby care, oral care, beauty, over-the-counter pharmaceutical, women's health, and wound care markets. The Pharmaceutical segment focuses on therapeutic areas, such as immunology, infectious diseases, neuroscience, oncology, pulmonary hypertension, and cardiovascular & metabolic diseases. The Medical Devices segment offers products used in the orthopedic, surgery, cardiovascular & neurovascular, and eye health fields. The company was founded by Robert Wood Johnson I, James Wood Johnson and Edward Mead Johnson Sr. in 1886 and is headquartered in New Brunswick, NJ.
Johnson & Johnson extends the uptrend,1 Price has been trending higher for months with repeated, orderly pauses
2 Each consolidation formed at a higher level and resolved to the upside
3 The latest push was steeper, increasing the chance of another pause
4 So far, pauses have looked constructive rather than distributive
5 Silent Flow is
JNJ at the best possible place to buyJNJ has recently been through a sharp correction in its price and currently, it is trading at $160.39, so when we check the charts on the weekly timeframe we can see that the price has previously taken support from this exact point and has shot up every time, additionally the price has also tested a
See all ideas
Summarizing what the indicators are suggesting.
Neutral
Neutral
Neutral
An aggregate view of professional's ratings.
Neutral
Neutral
Neutral
Displays a symbol's price movements over previous years to identify recurring trends.
Maturity dateJan 15, 2048
Coupon3.50% (Fixed)
Maturity dateSep 1, 2060
Coupon2.45% (Fixed)
Maturity dateSep 1, 2050
Coupon2.25% (Fixed)
Maturity dateMar 3, 2047
Coupon3.75% (Fixed)
Maturity dateMar 1, 2046
Coupon3.70% (Fixed)
Maturity dateJun 1, 2054
Coupon5.25% (Fixed)
Maturity dateMay 15, 2041
Coupon4.85% (Fixed)
Maturity dateSep 1, 2040
Coupon4.50% (Fixed)
Maturity dateDec 5, 2043
Coupon4.50% (Fixed)
Maturity dateSep 1, 2040
Coupon2.10% (Fixed)
Maturity dateJul 15, 2038
Coupon5.85% (Fixed)
See all JNJ bonds
Frequently asked questions
The current price of JNJ is 227.65 EUR — it has decreased by −0.09% in the past 24 hours. Watch Johnson & Johnson stock price performance more closely on the chart.
Depending on the exchange, the stock ticker may vary. For instance, on BSESOF exchange Johnson & Johnson stocks are traded under the ticker JNJ.
JNJ stock has fallen by −5.05% compared to the previous week, the month change is a −4.21% fall, over the last year Johnson & Johnson has showed a 42.64% increase.
We've gathered analysts' opinions on Johnson & Johnson future price: according to them, JNJ price has a max estimate of 285.25 EUR and a min estimate of 187.19 EUR. Watch JNJ chart and read a more detailed Johnson & Johnson stock forecast: see what analysts think of Johnson & Johnson and suggest that you do with its stocks.
JNJ stock is 0.09% volatile and has beta coefficient of −0.46. Track Johnson & Johnson stock price on the chart and check out the list of the most volatile stocks — is Johnson & Johnson there?
Today Johnson & Johnson has the market capitalization of 543.34 B, it has increased by 1.17% over the last week.
Yes, you can track Johnson & Johnson financials in yearly and quarterly reports right on TradingView.
Johnson & Johnson is going to release the next earnings report on Oct 13, 2026. Keep track of upcoming events with our Earnings Calendar.
JNJ earnings for the last quarter are 2.54 EUR per share, whereas the estimation was 2.50 EUR resulting in a 1.59% surprise. The estimated earnings for the next quarter are 2.40 EUR per share. See more details about Johnson & Johnson earnings.
Johnson & Johnson revenue for the last quarter amounts to 22.16 B EUR, despite the estimated figure of 21.94 B EUR. In the next quarter, revenue is expected to reach 22.38 B EUR.
JNJ net income for the last quarter is 4.85 B EUR, while the quarter before that showed 4.53 B EUR of net income which accounts for 0.00% change. Track more Johnson & Johnson financial stats to get the full picture.
Yes, JNJ dividends are paid quarterly. The last dividend per share was 1.15 EUR. As of today, Dividend Yield (TTM)% is 2.09%. Tracking Johnson & Johnson dividends might help you take more informed decisions.
Johnson & Johnson dividend yield was 2.48% in 2025, and payout ratio reached 46.59%. The year before the numbers were 3.39% and 84.80% correspondingly. See high-dividend stocks and find more opportunities for your portfolio.
As of Oct 6, 2026, the company has 140.8 K employees. See our rating of the largest employees — is Johnson & Johnson on this list?
EBITDA measures a company's operating performance, its growth signifies an improvement in the efficiency of a company. Johnson & Johnson EBITDA is 29.93 B EUR, and current EBITDA margin is 35.71%. See more stats in Johnson & Johnson financial statements.
Like other stocks, JNJ shares are traded on stock exchanges, e.g. Nasdaq, Nyse, Euronext, and the easiest way to buy them is through an online stock broker. To do this, you need to open an account and follow a broker's procedures, then start trading. You can trade Johnson & Johnson stock right from TradingView charts — choose your broker and connect to your account.
Investing in stocks requires a comprehensive research: you should carefully study all the available data, e.g. company's financials, related news, and its technical analysis. So Johnson & Johnson technincal analysis shows the sell today, and its 1 week rating is buy. Since market conditions are prone to changes, it's worth looking a bit further into the future — according to the 1 month rating Johnson & Johnson stock shows the buy signal. See more of Johnson & Johnson technicals for a more comprehensive analysis.