BTC CorrectionBTC Macro Daily Level Correction
BTC Broke down a a short term level 82k Which holding from 2 weeks, Here is are three things I Expect to happen
1. Creates Lower High here at around 80900 and Restarts a bull run towards 90k
2. Correction on lower level Towards 78k and then Restarts the Bull Run
3. does a Major Correction towards 67k and then Starts the Bull run
In-depth trading ideas
BTCUSDT: Pressure Push Bitcoin Back Toward 82,7Bitcoin is still trading inside a broad ascending channel, but the short-term structure is showing repeated weakness around the upper part of the range. Price is currently near 83,350, while the EMA cluster is sitting around 83,200–83,300, keeping BTC in a tight decision area.
The main area to watch is roughly 83,800–84,900. This zone overlaps with recent intraday resistance and the upper part of the current structure, making it the clearest area where sellers could step back in.
If BTC pushes
Reversal or Pullback? Better Trading MindsetA lot of traders lose money because they confuse a normal pullback with a true reversal. Price turns once, prints a few candles against the trend, and they instantly assume the market has changed direction.
That reaction is exactly what the thumbnail is warning about: one turn does not mean reversal. If you want better entries and more consistent profit, you need to slow down and learn the difference.
The Core Idea
A pullback is only a temporary move against the trend. A reversal is a real
BTCUSDT: Strong Bullish Structure, Recovery Toward $87.8KBitcoin has extended its correction from the $86K–$87K area and is now approaching the $80K–$82K strong support zone. This region previously acted as resistance before the September breakout, making it an important area for buyers to defend.
BTC is still below both H4 EMAs, so I would not treat the current level as an automatic buy.
The better setup would be a deeper test of $80,000–$82,000, followed by clear rejection and a recovery back above the short-term structure. If buyers confirm that
BTCUSDT: Strong Holds, Sellers Come BackBitcoin is recovering from the recent selloff, but the H4 structure still shows a clear problem: buyers have repeatedly failed around the $85,000–$86,700 resistance zone. The same area has already rejected price several times, making it the main level I would watch if BTC continues higher.
The Setup
Price is currently around $83,900 and has moved back above the EMA cluster near $83,400–$83,600, so another rebound is possible. However, unless BTC can establish acceptance above $86,700, I would s
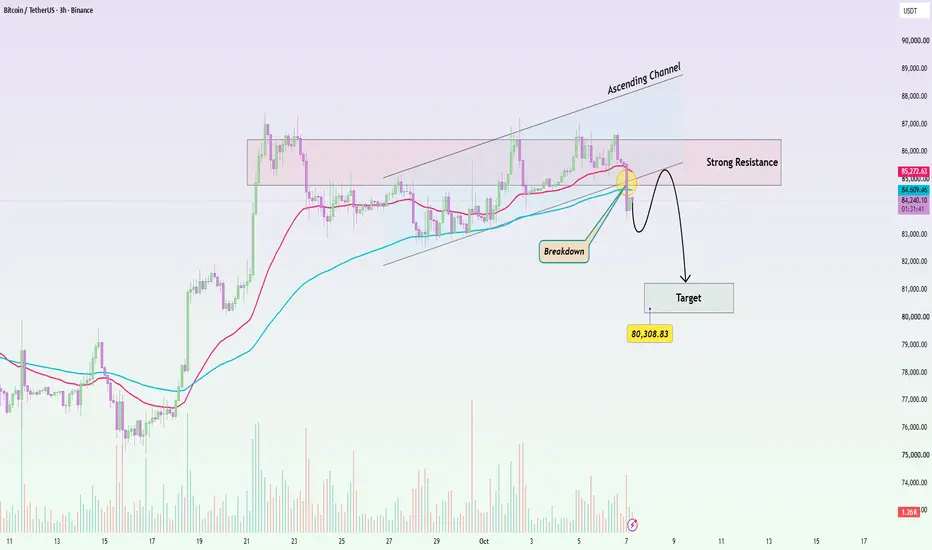
BTCUSDT: Channel Breakdown Turns Into ResistanceBitcoin has broken below the lower boundary of its ascending channel, and price is now trading around $84,200, below both short-term EMAs. That weakens the previous bullish structure and shifts attention toward a deeper correction.
The important area is now roughly $84,600–$86,300. This zone previously supported the advance, but after the breakdown it can become resistance.
If BTC rebounds into this area and fails to reclaim the channel, I would treat that move as a retest rather than a bullis
BTCUSDT: Channel Breaks, Downside ContinueBitcoin is trying to recover after the sharp breakdown from the previous ascending channel, but the H2 structure is still weak. Price is trading around $82,800, while both EMAs remain above or very close to price, showing that buyers have not yet regained clear control.
The key area is roughly $83,500–$84,500. This zone combines previous structure with the EMA cluster, making it the main resistance I would watch if BTC continues to rebound.
If price moves into this area but fails to establish
BTCUSDT: Breakdown Turns Recovery Into Sell SetupBitcoin has broken below the lower boundary of the ascending channel with a sharp bearish move, and price is now trading around $83,100, below both short-term EMAs. The breakdown also came with noticeably stronger selling volume, showing that sellers have gained short-term control.
The main area to watch is now roughly $83,300–$84,100. After the channel breakdown, this region can act as a sell zone if BTC rebounds but fails to reclaim the broken structure.
A weak recovery followed by rejection
BTCUSDT: Support Hold Push Toward 88.8KBitcoin is still moving inside a clear ascending channel, with price maintaining higher lows and both EMAs continuing to slope upward. After the latest push toward $86,500–$86,700, BTC has started pulling back into an important area rather than immediately losing the bullish structure.
The zone around $85,500–$86,500 is the key area to watch. It previously acted as resistance and is now being tested as support.
If buyers continue to defend this zone and BTC holds above the rising EMA near $85,3
BTC Bullish Trend Rounding curve Pattern In Bullish Trend what I have observed at least on 4h patterns,
1. It crates rounding top, correction happens, Creates rounding bottom starts the next leg,
2. Bearish Creating rounding top, Correction then creates another rounding top keeps going down.
Confirmation
1. 1h Bullish divergence
2. Rounding bottom, Rising channel pattern.
Pricing
1. Support happened 83100
2. Resistance Breakout zone 85100
BTC/USDT - Breakout Holds, 91.8 Comes Into ViewBINANCE:BTCUSDT continues to build on the bullish breakout from the descending trendline that had capped price through most of September. The move above that structure was followed by a strong expansion higher, and price is now holding above the H4 Ichimoku cloud rather than immediately giving the breakout back.
After the initial impulse, Bitcoin has moved into consolidation around the 85,000–87,000 region. For me, this is more important than chasing the latest push higher. The marked 84,800–
More Trades ≠ More Money: Quality Beats QuantityA lot of traders believe that more trades should mean more opportunities and therefore more profit. In reality, taking more trades often creates the opposite result: more fees, more spread, more slippage, more emotional decisions, and more chances to force setups that were never good enough in the first place.
The real goal is not to trade more. The real goal is to trade better.
More Trades Create More Hidden Costs
Every time you click buy or sell, there is a cost. Spread, commission, slippage
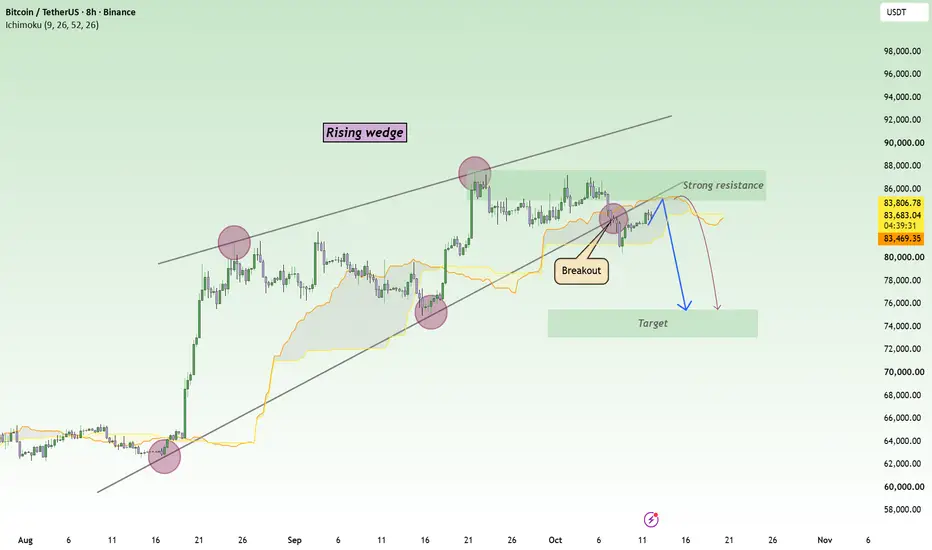
BTCUSDT: Higher Prices Are Becoming Harder to HoldWhat catches my attention in Bitcoin right now is not a single bearish candle or one isolated technical signal. Both the price structure and the broader investment environment are becoming less favorable for buyers . The rising wedge has broken to the downside, while a strong U.S. dollar and elevated U.S. Treasury yields are giving capital more reasons to remain cautious toward risk assets.
ㅤ
From a fundamental perspective, I am paying more attention to where capital actually wants to go . Whe
BTCUSDT: Short-Term Pressure Remains BearishBTCUSDT is currently clearly leaning toward a short-term BEARISH outlook, as both the broader market environment and the technical structure still do not support a sustainable rally.
ㅤ
From a fundamental perspective, Bitcoin continues to face pressure from an environment that remains challenging for risk assets. A strong U.S. dollar, elevated U.S. yields, and cautious market sentiment are making short-term capital more selective toward crypto. Under these conditions, BTC rallies are more likely
BTCUSDT: The Rally Still Has Something to ProveBitcoin has recovered from the recent lows, but I’m not convinced the market is ready to move higher just yet. The problem isn’t that BTC can’t bounce — it’s that buyers still haven’t been able to hold onto those gains. Each recovery has eventually run into selling pressure, while the broader structure continues to produce lower highs.
ㅤ
The macro backdrop doesn’t make things much easier. U.S. Treasury yields remain a headwind for risk assets, and uncertainty around inflation and the Fed is keep
Price Action Clue Traders Miss - Trading ConceptsPrice Action is not only about support, resistance, or candle patterns. One of the simplest ways to understand what the market may do next is to compare the strength of the impulse with the strength of the pullback.
1. Strong Move = Real Pressure
When price expands with large candles, clean closes, and little hesitation, one side is clearly in control.
A strong bullish move tells us buyers are willing to pay higher prices aggressively. A strong bearish move tells us sellers are doing the o
BTCUSDT: Channel Breakout, Bulls Take ControlBitcoin is showing a familiar structure on the H4 chart. The previous descending channel ended with a clean breakout around $78K, followed by a strong expansion toward $87K. Now BTC is attempting the same transition again.
Price has pushed above the upper boundary of the latest downward channel and is trading around $86,000, while both EMAs remain below price near $84,100 and $83,000. That keeps the broader recovery structure constructive.
The important area now is roughly $84,500–$85,200. A c
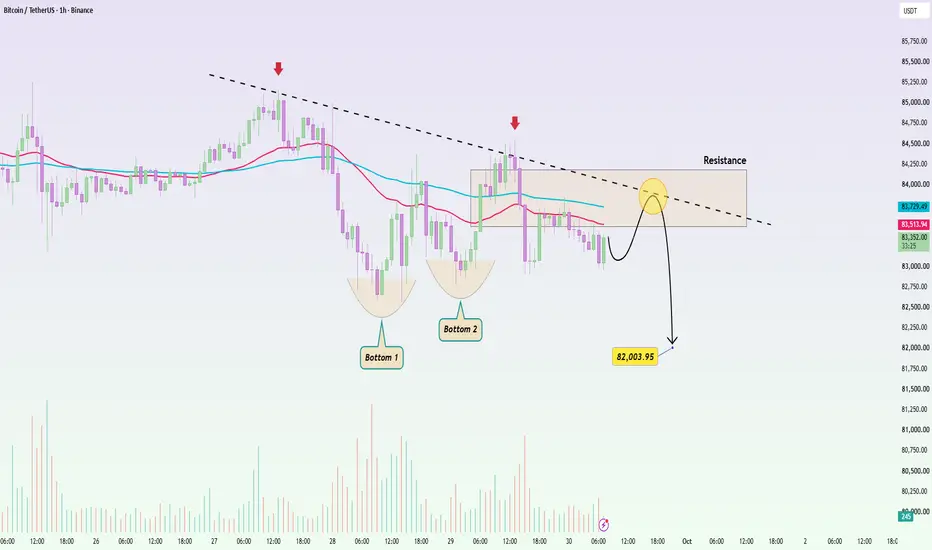
BTCUSDT: Next Downward Wave FocusBitcoin is still struggling beneath a clear descending trendline, and the latest recovery has once again failed around the $83,600–$84,300 resistance area. Price is also trading below both short-term EMAs, which keeps the immediate structure tilted toward sellers.
The two recent lows may resemble a double bottom, but that pattern is not enough on its own. A double bottom normally needs a convincing break of the neckline before the bullish reversal is confirmed.
A small rebound back into $83,50
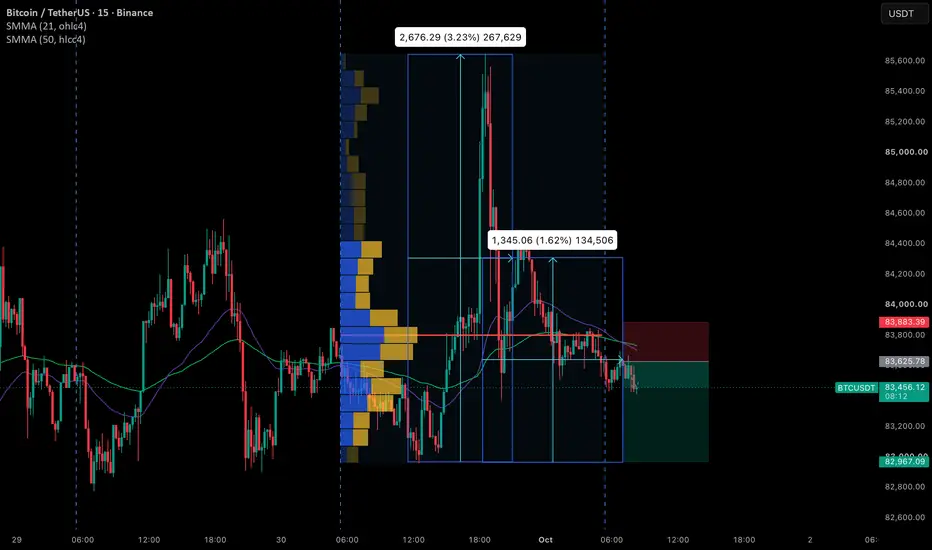
BTCUSDT on 15 min TF analysis(01/10/2026)🔻 BTCUSDT 15M — POC Rejection + Trend Continuation Short Setup
Timeframe: 15M
Entry: ~83,625
SL: 83,883
Target: 82,967
Approx. R:R: 1 : 2.56
📊 Trade Logic
For this setup, I started with the previous session’s Volume Profile and marked the POC as the main reference level.
The idea was to wait for price to show whether it could reclaim and hold above the POC or get rejected from it.
1️⃣ Strong upside move → exhaustion
BTC first made a strong impulsive move from the lower value area toward 85
BTCUSDT 15 min setup found 8:15 pm (30/09/2026)📊 BTCUSDT 15M — Previous Day POC Reclaim Long Setup
Entry: 83,874
Stop Loss: 83,326
Target: 85,320
Risk/Reward: ~1 : 2.64
🔍 Trade Logic
For this setup, I started with the previous day’s Volume Profile and POC as my primary reference level.
The idea was not to blindly buy at the POC. I wanted to see how price behaved around this high-volume area.
1️⃣ Previous Day POC as the key reference
The previous session’s POC was carried forward into today’s chart.
Price initially traded below/around