In-depth trading ideas
BTC Bull Run Ending Soon?"September could mark the climax of Bitcoin’s bull rally, triggering a correction phase as smart money begins profit-taking — key levels like $74,457 and $48,888 may become attractive accumulation zones in the upcoming bear market."
Disclaimer : This content is for informational and educational purposes only and should not be considered financial or investment advice. Cryptocurrency trading involves significant risk and may not be suitable for all investors. Always do your own research (DYOR)
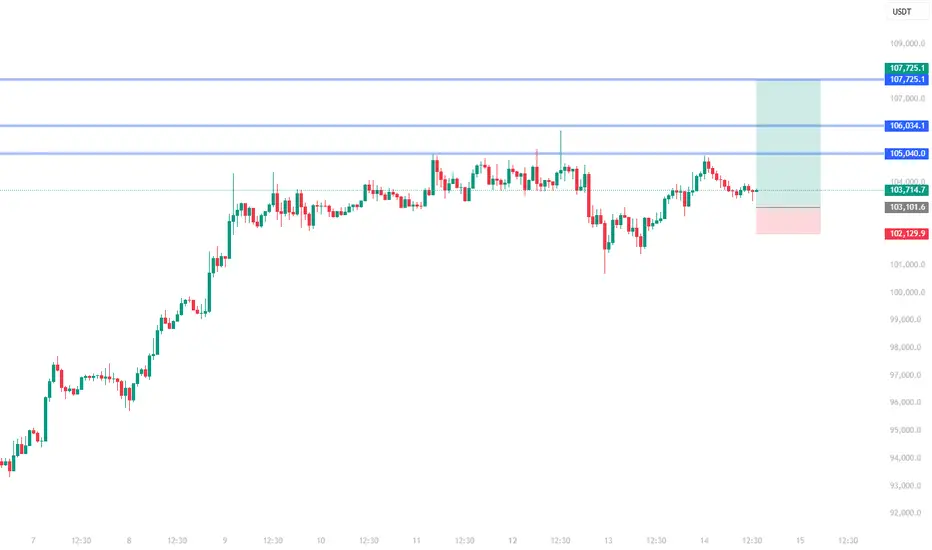
Intraday Long Setup | Pivot-Based StrategyPrice is retracing into a strong pivot zone (marked by the red box), which acted as a previous resistance and is now flipping into support.
Structure remains bullish with potential for continuation after pullback.
The green box represents a high-probability long opportunity with tight risk control.
Watch for price reaction within the red zone. Entry only if confirmation (e.g., bullish engulfing, strong wick rejections) appears.
The setup expires at end of the daily candle close.
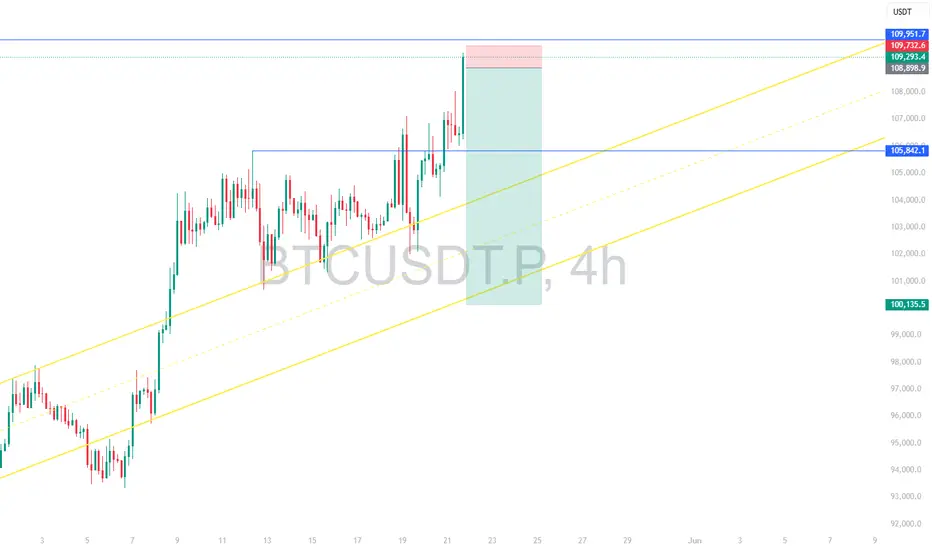
BTCUSDT.P Weekly Short Setup | Pivot-Based StrategyPrice has pushed into a potential weekly Pivot supply zone (red box) where sellers may step in. This trade is based on the expectation of a rejection from this area.
Entry: Red box — a short entry zone aligned with overhead supply
Stop Loss: Above the red zone (invalidates the setup)
Target: Green box — area to consider partial/full exit based on momentum
BTCUSDT has shown a strong bounce but is now approaching a key pivotal resistance zone
Risk-reward is favorable with a tight invalidation a
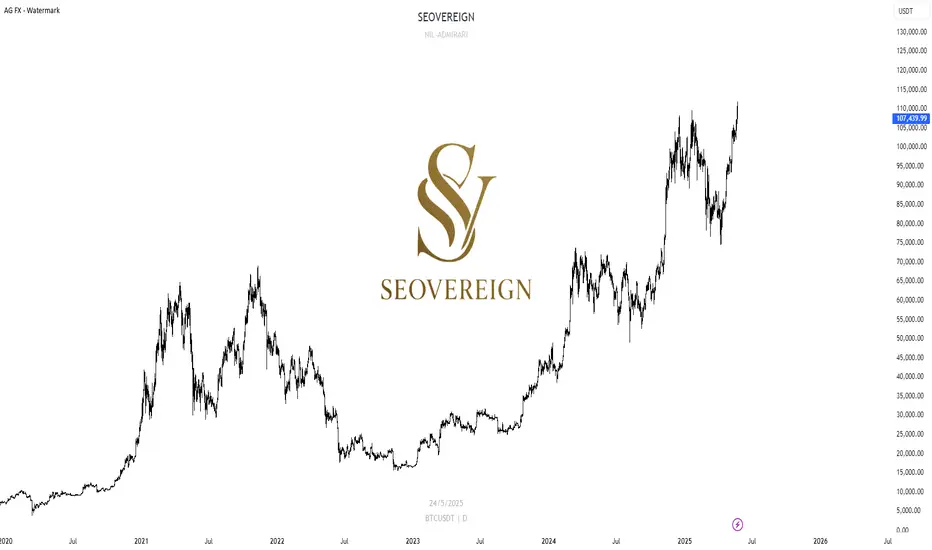
2025.05.18 BITCOIN Short-term long positionWe are the SeoVereign Trading Team.
With sharp insight and precise analysis, we regularly share trading ideas on Bitcoin and other major assets—always guided by structure, sentiment, and momentum.
🔔 Follow us to never miss a market update.
📈 Bitcoin (BTC) Long Position Outlook
Currently, Bitcoin has confirmed support after two valid Bat patterns played out. From an Elliott Wave perspective, the market is in a consolidation phase, and it’s unclear whether the next move will be an impulse or a c
Bitcoin (BTC) Technical Analysis for the Week of May 26 - June 1#Current Price and Market Context (as of May 24, 2025):
Price: Bitcoin is trading around $103,000–$111,000, with recent consolidation near $103,000 after facing resistance at $105,000.
Market Sentiment: Bullish, with the Fear & Greed Index at 78 (Extreme Greed) and 28 technical indicators signaling buy versus 6 bearish signals.
Volatility: Bitcoin has shown increased volatility recently, with a 0.94% daily volatility estimate.
# Forecast for Next Week (May 26 - June 1, 2025)
--Bullish Scena
Future Trading Strategy as of 2025.05.24We are the SeoVereign Trading Team.
With sharp insight and precise analysis, we regularly share trading ideas on Bitcoin and other major assets—always guided by structure, sentiment, and momentum.
🔔 Follow us to never miss a market update.
Serverin Team's Upcoming Trading Strategy – Full Disclosure
Hello, this is Serverin, operator of the Serverin Team.
After Bitcoin surpassed its all-time high of $112,000, it has experienced a decline of approximately 4% as of May 24, 2025.
The primary cause
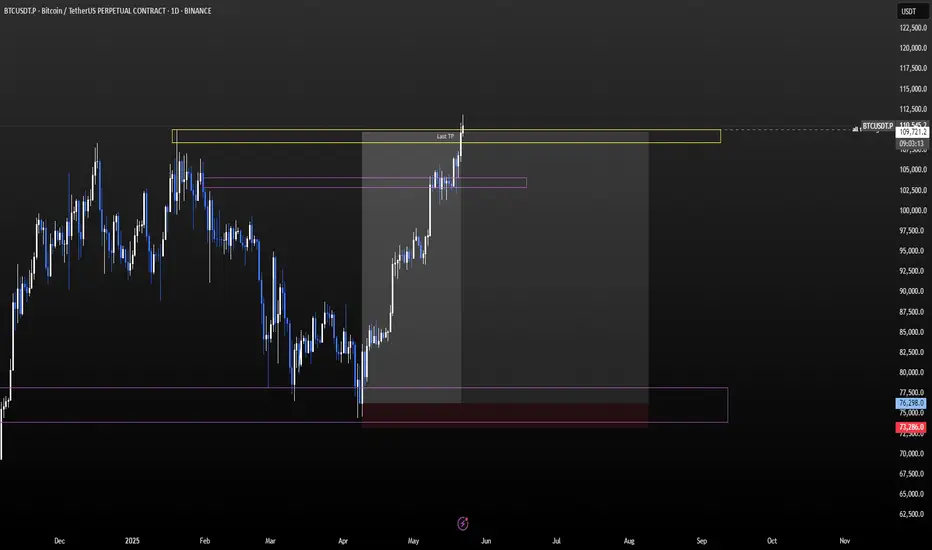
last target for short term BTC This is linked to tehe priovious analysis. It's just the set of the trade from april to may with a clarified design.
I use ineffincency levels to set trades and targets, liked with fibonacci level, thinking about the fact that btc is always recoveing empty zones (backtesting for beliving).
In this case:
BTCUSDT
Enter 76-78K inefficiency zone (purple)
TP1 102-104K inefficiency zone and support
TP2 110-112K inefficiency zone and last fibonacci target.
Nic
after one year, here we are 110KI just wanted to share an interesting analysis I did on May 12th to understand the typology of growth BCT has been experiencing. I wanted to determine whether it was a bubble, inflation, FOMO, or something else.
The "lower band short-term Daily" represents, in the short term, the lowest point from which the movement (in this case, bullish) started. This was identified using a double bottom and triple candle structure.
From this point, the price grew and consolidated, grew and consolidated agai
H4 BOTTOM DETECTION: WE’VE HAD TIMELY BUY SIGNALSH4 BOTTOM DETECTION: WE’VE HAD TIMELY BUY SIGNALS
Waiting for D1 to form a peak to see a price drop to 91k, but D1 stubbornly refused to decline by Sunday night, so we must rely on H4 bottom detection to go LONG.
The price zone we discussed was 102.9k, and last night BTC reached 107.2k—hitting the target. Why did it hit the target? Because BTC is rising in this wave to set up for a correction, and we expect a sharp drop to the 91k zone this week.
What should you do with BTC?
Take p
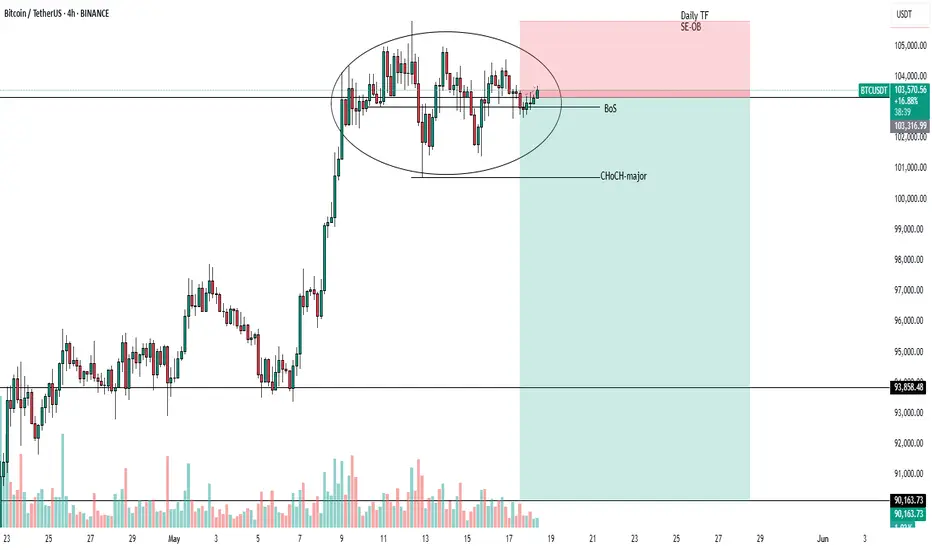
BTCUSDT HAS FORMED ELLIPSE ON 4H TF NEAR DAILY TF SE-ORDER BLOCKBTCUSDT is currently trading near daily timeframe selling order block(103333-107793.07) and has broken its structure at the level of 103005.33 and has also formed an ellipse on 4h timeframe i've entered a short position in BTCUSDT at the level of 103333 with stop loss above the high of the ellipse at the level of 105819.45 once it breaks the level of 100718.37 and changes its character it will give a mirror move till the levels of 93858.48 and 90163.73
BITCOIN - SYMMETRICAL TRIANGLE FORMING WITHIN A BULLISH TRENDSymbol - BTCUSDT
Bitcoin is consolidating. A symmetrical triangle pattern is forming within the context of a prevailing bullish trend. Based on the current technical setup, it is reasonable to interpret this consolidation as a preparatory phase for a continuation of the upward movement.
Fundamental nuances have gradually improved over recent weeks, contributing to a moderate revival in the cryptocurrency market. From a technical standpoint, the market structure on the daily chart appears const
2025.05.15 BITCOINWe are the SeoVereign Trading Team.
With sharp insight and precise analysis, we regularly share trading ideas on Bitcoin and other major assets—always guided by structure, sentiment, and momentum.
🔔 Follow us to never miss a market update.
The formation of the Deep Gartley pattern has been clearly confirmed, suggesting a valid short-term rebound scenario.
Buying pressure is emerging at the current price level, reinforcing the reliability of the pattern.
Short-term target levels are as foll