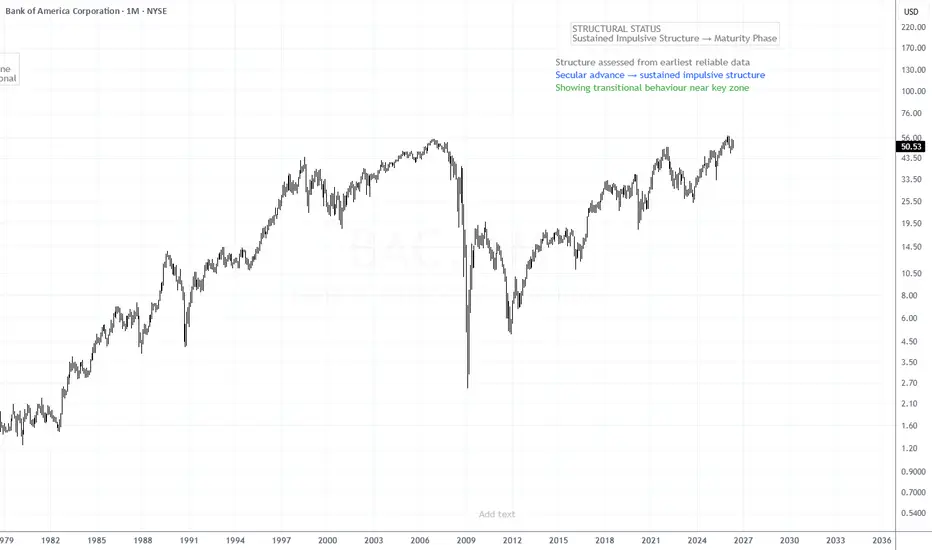
NYSE – S&P 500 | Bank of America Corporation | 18 May 2026Sustained Impulsive Structure → Maturity Phase
Trend: Uptrend | Location: Upper Zone | Behaviour: Transitional
Structure assessed from earliest reliable data
Secular advance → sustained impulsive structure
Showing transitional behaviour near key zone
Bank of America exhibits a long-term secular advance structure after recovering from previous periods of structural disruption. The broader structure continues to maintain an upward trajectory, while current behaviour reflects interaction near hi
Bank of America Corp
No trades
No trades
In-depth trading ideas
Institute of Intermediation and 24 Coffee LoversWhen the market is efficient, the most efficient strategy will yield zero financial return for the investor. Therefore, firstly, it is necessary to strive to find inefficiencies in the market itself to apply a strategy that will be effective for it.
What creates market inefficiency? First, there are delays in disseminating important information about the company, such as the approval of a contract with a major customer or an accident at a plant. If current and potential investors do not receive
BAC : Booking profitsBooked profit of about 19.28% on the invested capital.
I do realize that there is a potential for a move of about 9% to the next key inflection levels. But considering the overall valuation of the US market and the high interest rate environment and the possibility for a recession to hit the US economy in the near future, I do expect a sell-off. So decided to cut some position and maintain some cash positions.
For that reason I closed the position in this stock.
Will consider a re-entry if
Bank of America stock (BAC) is going to go bearish.Bank of America has shown many confluences of going bearish. I have identified 3 key confluences. First a bearish fair value gap has been created and price has tapped into it. secondly there is a bullish imbalance that price will draw towards to fill. Then when this happens price will most likely continue to go bearish, and sweep sell side liquidity.
BAC Analysis(Bearish Flag and Pole Pattern)!Bank of America Corporation Analysis on Daily Timeframe!
Bearish Flag and Pole Pattern Formation in BAC
Flag Breakdown in BAC
Bank of America Corporation made Bearish Flag and Pole pattern. We can see the sharp fall in Bank of America Corporation after price made a flag and moving inside the flag. The price given a breakdown to the flag support and able to closed below it. I have marked important levels in chart which is Fib level 1.618 will be act as a possible support level(23.49). For t
BAC KEY LEVELS SUPPORT AND RESISTANCE 04/06/2020Key Levels for BAC(BANK OF AMERICA CORPORATION) for INTRADAY TRADING are :
Upper Breakout~20.85
First Target~21.55
Interim Resistance~22.60
Final Resistance~23.55
**Lower Levels**
Lower Breakout~19.40
First Target~18.85
Interim Support~18.35
Final Support~17.55
Please trade with caution and consult your financial adviser before trading.