Uber Technologies, Inc.
No trades
No trades
In-depth trading ideas
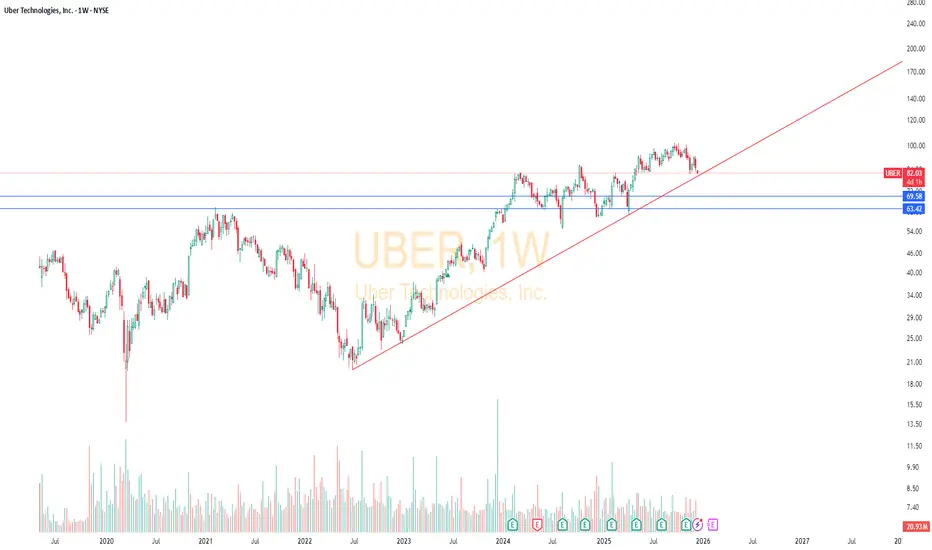
Time for a Ride UBER is testing the lower boundary of a multi-year ascending channel on the monthly chart. RSI has cooled far more than price, a classic hidden bullish divergence that often precedes the next leg up.
Channel Bottom Retest:
UBER has been trading within a well-defined ascending channel since the 2020 lows. Price is now back at the lower trendline, a level that has historically attracted buyers. This is the first clean test of channel support since the 2022 correction, making the zone structurall
UBERUBER has recently exhibited a classic Pole and Flag formation on its price chart—typically a bullish continuation pattern that indicates a strong upward trend after a brief consolidation. The "pole" reflects the steep and rapid price rise, while the "flag" represents the short-term consolidation or retracement that follows.
A breakout above the flag’s resistance has been observed, signaling renewed bullish momentum. This breakout suggests that the stock could be entering the next leg of its upw
The Future for UBERUBER is approaching pivotal levels that will determine whether they can sustain moves that will not only break previous ATH's but fuel the momentum to new ATH's. On the opposite side of the same coin, those same levels may push UBER back 6 months growth.
Right now, there is plenty of discussions and movements from companies towards driverless ridesharing. We already see places like San Francisco and Phoenix where driverless cars are becoming common sights. With the push for all electric cars,
Uber- Technical AnalysisDisclaimer: I don’t own shares of UBER.
The below analysis is not a trading or investment recommendation & is only for learning purpose.
• Price is under the short term 20 period & long term 200 period moving averages.
• Price & RSI show an unconfirmed bullish divergence. Confirmation of this divergence is obtained through price closing above the
trendline & sustaining itself above the trend line.
• Immediate resistance points seems to be the 20MA, the intersection of price & the trend
Live Challenging Market Analysis Buy UBER STOCK @ 41.93Live Challenging Market Analysis Buy UBER STOCK @ 41.93
Target @ 65.00
Entry 2 @ 23.66
Target Buy 1 & 2 @ 41.93
Our Unique Features:
—————————————————————
1. Follow our 15 signals ….10% equity will increase in your account for sure.
2. We are not Trailing stop! or average the trades.
3. 2% Risk Management Per trade.
4. Risk vs Reward up to 1:7.
Note:
Trade signals would usually have a risk to reward ratio of 1:2.
It means that even 2 out of 4 signals hits their SL marks, the other two would