XAUUSDI posted a buy side trade today i was looking for correction and found this perfect short setup Trendline break and supply zone keeping setup simple.
Trade ideas

Gold Declines as Sellers Dominate the MarketGold is undergoing a controlled correction phase after an extended period of sustained gains. Market behavior over recent sessions reflects a shift from expansion to contraction as liquidity flow decreases and momentum weakens across key time horizons.
The previous upward cycle attracted substantial speculative interest, but current market dynamics suggest profit-taking by institutional participants and reduced accumulation from large holders. The recent structural shift confirms that sentiment has turned defensive, aligning with global market caution amid evolving economic conditions.
Despite short-term consolidation, the broader setup indicates that gold remains sensitive to global financial stability concerns and policy signals. Market participants are now waiting for clarity on upcoming economic data and interest rate outlooks, which could determine whether the correction deepens or transitions into a new accumulation phase.
In the near term, volatility is expected to remain elevated as investors reassess exposure levels. The prevailing outlook maintains a cautious bias, with traders closely observing how price reacts to continued shifts in liquidity and macro sentiment. Sustained capital outflow from hedge assets could pressure gold further, while renewed demand for safety could limit downside potential in the medium term.

Gold (XAU/USD) 4H Chart Analysis – Short-Term Reversal from ?Technical Overview:
Gold has recently rebounded from a High Demand Zone around the $3,900–$3,910 region, showing clear signs of buyer re-entry after a prolonged bearish correction. The candle structure suggests strong bullish intent, with higher lows forming and a potential continuation toward the next liquidity area.
Key Observations:
🔹 High Demand Zone: Price reacted strongly here, indicating institutional buying pressure.
🔹 High Prop POI (Point of Interest): Served as a key accumulation level before the breakout.
🔹 SMC Trap: Indicates a prior liquidity grab, trapping late sellers before the move up.
🔹 Bullish Momentum Building: Consecutive bullish candles after rejection from the demand zone strengthen the reversal bias.
Target Projection:
🎯 Immediate Target: $4,080 – $4,100 (aligned with local resistance and liquidity grab zone).
🛑 Support: $3,905 (must hold to maintain bullish structure).
💎 Extended Target (if momentum continues): $4,160 – $4,180 (previous major swing high zone).
Summary:
Gold is showing a short-term recovery phase within a broader bullish structure. A confirmed 4H close above $4,030 would likely propel price toward the $4,100 region, while a drop below $3,900 would invalidate the bullish setup.
📊 Suggested Title:
"Gold Rebounds from Key Demand Zone, Eyes $4,100 Resistance 🔥"

Part 1 Ride The Big Moves What Are Options?
An option is a financial contract that gives the buyer the right, but not the obligation**, to buy or sell an underlying asset at a predetermined price (called the strike price) before or on a specific date (the expiry date).
Options are categorized into two types:
Call Option: Grants the holder the right to buy the underlying asset.
Put Option: Grants the holder the right to sell the underlying asset.
For example, if an investor believes a stock’s price will rise, they might buy a call option. Conversely, if they expect the price to fall, they might buy a put option.

Upcoming Event AnalysisLets See.
Xauusd ahead of Fed seems neither Bullish or Bearish.
Watchout your Capital.
Small quantity will give max profits today.
Trade Safe👍

XAUUSDI was looking for long in Gold was waiting for Trendline break and demand was already there so it broke and triggered my buy please find my setup

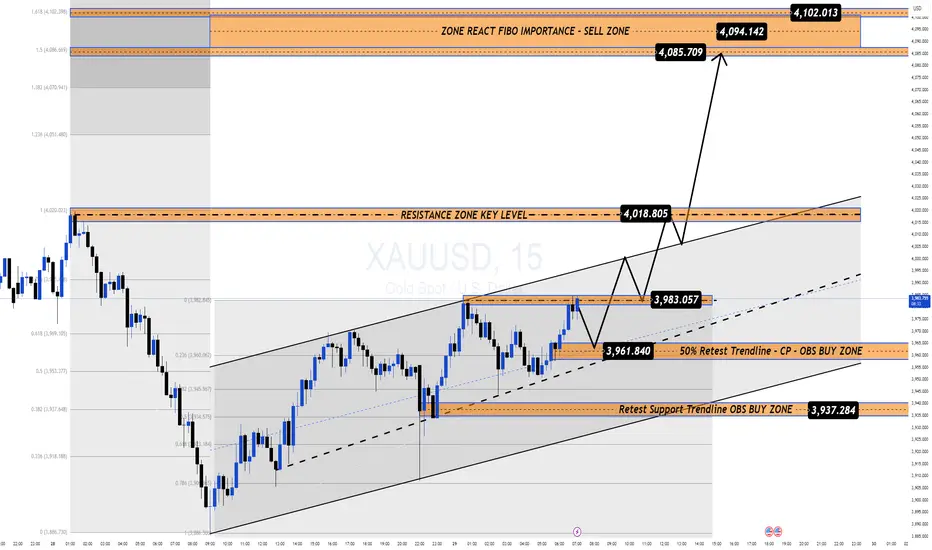
Gold Recovers 1000 Pips Ahead of FOMC: Key Levels in Focus📊 Market Overview
After a sharp selloff that shook long positions, Gold has rebounded nearly 1000 pips, recovering from the 388x area toward 398x ahead of the upcoming FOMC meeting.
Despite the short-term recovery, Gold remains down around 3.5% this week, showing caution as traders reposition before the Fed decision and amid easing U.S.–China trade tensions.
Currently, the price is trading near $3,980–3,990 during the Asian session, consolidating below the psychological $4,000 mark.
💎 Technical Outlook (H1–M15)
Gold continues trading in a short-term ascending channel, showing a corrective recovery inside a larger downtrend.
Immediate Support Zones:
• 3,961 – 3,937 → Trendline retest & OBS Buy Zone
• 3,918 → Structural invalidation area
Resistance & Key Reaction Levels:
• 4,018 – 4,085 → Mid-term resistance
• 4,094 – 4,102 → Major Sell Zone (Fibo 1.5–1.618 confluence)
📍If Gold breaks and holds above 4,018, momentum could extend toward 4,085–4,102.
📍If it rejects near 4,094–4,102, a correction toward 3,961–3,937 is likely.
🌍 Macro Context – FOMC Ahead
Markets expect a 25bps rate cut. A hawkish tone from Powell may pressure Gold, while a dovish one could send it above $4,100.
🧭 Summary
Gold keeps a short-term bullish bias but remains fragile ahead of FOMC.
Expect volatility around 4,000–4,100; key reactions near 4,094–4,102 will decide the next move.
🛡 Stay patient — liquidity builds before clarity.
GOLD (XAU/USD) — Calm Before the FOMC Storm Gold is currently consolidating above $3,950, signaling a pause in volatility as traders await the FOMC decision for the next directional move.
1️⃣ Macro Outlook & Core Bias – FOMC in Focus 🔑
Market Pause: After rebounding during the Asian session, Gold’s upside momentum remains limited. Market participants are cautious ahead of the Fed’s policy update.
Headwinds: Renewed optimism on US–China trade and a slightly stronger USD are capping Gold’s advances.
Game Plan: Stay tactical — identify scalp zones and prepare for a major breakout once the FOMC event unfolds.
2️⃣ Technical Setup – Descending Channel in Play 📉
Structure: Price action is holding above $3,950, but movement remains confined within a descending channel/flag.
Bias: Short-term demand persists, yet the broader structure still favors bears.
Preferred Setup: Watch for BUY scalps from lower demand zones toward the Fibo/channel resistance area.
3️⃣ Trading Plan – Precision & Patience 💰
🟩 BUY Scenario (Long Scalp)
Buy Zone: $3,939.468
Strategy: Look for long scalps targeting the Fibo 0.5 resistance.
Stop-Loss: Tight SL just below the $3,939 level.
🟥 SELL Scenario (Short Setup)
Scalp Sell Zone: $4,015.646 (Fibo 0.5)
→ Short scalps targeting a retest of the channel midline.
Main Sell Zone: $4,046.448 (Fibo 0.618 / Channel Ceiling)
→ Ideal entry for a continuation short, aligning with the overall bearish channel.
4️⃣ Trader’s Take 🚀
The FOMC decision will set the tone —
Are you eyeing a bounce from $3,939, or waiting for the $4,046 rejection to ride the next wave down?

XAUUSDPrice Action Trading is a method of financial market analysis where traders make buying and selling decisions solely based on the asset's price movements over time, without relying on technical indicators.
It's essentially the art of reading a "naked" or clean chart to understand the psychology and behavior of market participants.

Gold Extends Decline Below $4,000 as Risk Appetite Returns🔍 Market Context
Gold continues to struggle amid renewed optimism around US–China trade talks.
The shift in sentiment has reduced safe-haven demand, while softer expectations of further Fed rate cuts keep the US Dollar capped — offering limited downside support for XAUUSD.
However, the technical landscape remains clearly bearish.
The break below the ₹4,000 handle confirms continuation of the downtrend first outlined in early-week plans.
📊 Technical Analysis
Structure: Gold maintains a clean bearish channel on the H1–H4 frame.
Immediate resistance: ₹3,985 – ₹4,000 (former support, now supply zone).
Target zones:
• Short-term liquidity area near ₹3,925–₹3,930
• Extended target sits around ₹3,880–₹3,860, aligning with Fibo 1.618.
Invalidation: Only a sustained break and hold above ₹4,020–₹4,030 would neutralize this short-term bearish bias.
🎯 Trading Outlook
If gold retests the broken ₹4,000 zone and fails to regain it,
expect sellers to extend control toward ₹3,920 or lower ahead of the FOMC meeting.
That event may later define the next recovery point — but for now, momentum remains firmly on the downside.
⚜️ Summary
Gold’s recent slide isn’t random — it’s structural.
The market is rebalancing after excessive bullish sentiment,
and liquidity below ₹3,900 is likely to attract attention before any significant rebound.
Watch the reaction near ₹3,920–₹3,880 —
that’s where the next meaningful decision for gold may emerge.
📊 MMFLOW TRADING Insight:
Smart money doesn’t chase candles — it waits for liquidity to shift.

StevenTrading - XAUUSD: Mid-Term Buy Bias StrategyStevenTrading - XAUUSD: Mid-Term Buy Bias Strategy - Anticipating Wave 5 and Trendline Test at $3935
Hello everyone, StevenTrading is back with a detailed Gold analysis!
Gold is currently consolidating above the $3.950 mark, eagerly awaiting the FOMC interest rate decision for new momentum. Structurally, we anticipate Gold to follow the 5-wave structure of Elliot Wave Theory at this juncture. The Buy (Long) strategy remains the primary focus in the medium term, concentrating on a trendline retest for entry.
1. 📰 MACRO CONTEXT & FUNDAMENTAL FLOW
The Gold market is governed by anticipation:
Current Status: Gold is trading sideways above $3.950. Traders are keenly awaiting further signals regarding the Fed's future path for rate cuts.
Psychological Barrier: Gold needs to convincingly break the $4.000 psychological mark to solidify the case for a sustained rally. This hinges entirely on the outcome of the FOMC decision.
2. 📊 TECHNICAL ANALYSIS: ELLIOTT WAVE SCENARIO
Based on the H1 chart analysis (referencing image_fa2a75.png):
Wave Structure: Gold appears to be in the consolidation phase after waves 3 and 4. The next step is the potential formation of Wave 5, aiming to complete the cycle or confirm a new bullish trend.
Ideal Buy Zone (High-Prob): The $3935 - 3937 zone is a crucial confluence. This area aligns perfectly with the "Buy test trendline" zone (see chart) and offers strong support to initiate the potential next bullish wave.
Scalping Sell Zone: The nearest resistance and potential short-term selling area is the Sell entry Liquidity zone around $4058 - 4060.
3. 🎯 DETAILED TRADING PLAN (ACTION PLAN)
The primary focus is the Buy Continuation trade aligned with the expected mid-term correction.
🟢 Primary BUY Scenario (BUY Primary)
Entry Zone (Buy): $3935 - 3937
Stop Loss (SL): $3929 (Maintain tight SL)
Take Profit (TP): TP1: $3955 | TP2: $3978 | TP3: $3995 | TP4: $4022 | TP5: $4055
🔴 SELL Scalping/Hedge Scenario (SELL Secondary)
Entry Zone (Sell): $4058 - 4060
Stop Loss (SL): $4066
Take Profit (TP): TP1: $4045 | TP2: $4022 | TP3: $4005 | TP4: $3968
4. 🧠 SUMMARY & DISCIPLINE (Steven's Note)
Gold is at a decisive point before the FOMC. The buying scenario is favoured, but discipline must be absolute.

🇮🇳 LiamTrading – XAUUSD: Dual Strategy Ahead of FOMC🇮🇳 LiamTrading – XAUUSD: Dual Strategy Ahead of FOMC | Focus on Buying the Retracement near $3914
Hello Traders,
After a strong sell-off, Gold (XAUUSD) is showing early signs of recovery, building a minor upward structure.
We continue to focus on buying the pullback, viewing this move as a short-term correction within the broader downtrend.
Expect higher volatility as the FOMC decision approaches.
📰 MACRO CONTEXT & FUNDAMENTALS
The market is holding steady ahead of the FED announcement:
🟢 Technical Recovery:
Gold reversed part of its decline during the Asian session, bouncing slightly from a 3-week low as traders await the FOMC rate decision.
🔴 Headwinds:
However, optimism around US-China trade talks and a stronger USD continue to limit the upside momentum.
📊 TECHNICAL VIEW & TRADING PLAN
We are focusing on high-probability liquidity zones for both long and short opportunities:
🟢 Primary BUY Setup (Retracement Buy)
Looking for a retest of the key buy-side liquidity zone to trigger the next recovery wave.
Entry Zone (Buy): $3914
Stop Loss: $3906 (Tight SL recommended)
Take Profit: TP1 $3933 | TP2 $3956
🔴 SELL Setup (Retest / Short-Term Scalping)
Using the broken trend area for short opportunities.
Entry Zone (Sell): $4048
Stop Loss: $4056
Take Profit: TP1 $4035 | TP2 $4022
🧭 SUMMARY & TRADER’S NOTE
Gold is now in a decision zone — volatility will spike around FOMC.
Trade with discipline:
✅ Enter only at confirmed liquidity zones.
✅ Always respect your Stop Loss.
✅ Manage your capital carefully before the news release.
Wishing everyone a profitable and disciplined session!

Elliott Wave Analysis – XAUUSD (October 29, 2025)
Momentum
• D1: Momentum remains compressed, but yesterday’s candle closed with a long lower wick — a clear sign of weakening downside pressure. A bullish daily close today would confirm a potential D1 reversal.
• H4: Momentum is preparing to turn down from the overbought zone, yet the current upward move is still weak. We need to monitor whether price can hold above the previous low once H4 momentum drops toward oversold.
• H1: Momentum is falling, but price is supported around 3953 and capped near 3994.
As long as price holds above 3927 and avoids breaking 3892, the next H4 oversold phase could confirm a stronger upside structure.
________________________________________
Wave Structure
• D1: The current decline equals 0.382 retracement of wave (3) yellow, a key Fibonacci level.
• H4: Wave (4) purple has already retraced 0.782 of wave (3) — unusually deep for a normal 4th wave (which typically stops around 0.382–0.5).
This suggests the ongoing correction may represent wave (4) yellow on the D1 timeframe.
If true, the market could now be forming wave W of a larger W–X–Y structure, meaning the upcoming recovery might only be a slow, overlapping X wave before another decline.
• H1: The 5-wave black structure seems completed.
A break above 3995, followed by a test of 4050, would confirm the end of wave (5) black and the start of a corrective move upward.
________________________________________
Summary
Price volatility is still high — avoid limit orders for now and watch how price reacts at key zones.
• 🔹 Support: 3953 – 3927 – 3892
• 🔹 Resistance: 3994 – 4050

XAUUSD | Gold to drop 2000PIPS, where is the best sell zone?🔍 Market Context
After breaking the medium-term upward structure at the main Trendline , gold has formed a distinct series of Lower High – Equal Low (EqL) , indicating a phase shift from bullish to bearish.
Currently, the price is fluctuating around the 3,960–3,970 USD zone – this is a temporary liquidity accumulation area before moving up to retest the resistance at 4,015–4,050 USD , which was previously a Demand Zone now turned into Supply Zone .
If a strong bearish reaction occurs here, the price is likely to extend its decline towards the Order Block 3,945–3,960 USD zone, or even deeper to the Premium Zone 3,884 USD .
💎 Key Technical Structure
Main Trendline: broken, confirming a structural change (ChoCH).
Resistance Zone: 4,010–4,015 → quick reaction resistance.
Supply Zone: 4,043–4,060 → strong technical retracement zone.
Premium Zone: 3,884–3,900 → discount zone, potential temporary bottom.
📈 Trading Scenarios
1️⃣ SELL Zone 1 – Scalp Reaction at Resistance Zone
Entry: 4,010 – 4,015
SL: 4,025
Take Profit : 4,005 - 3,995 - 3,975 - 3,965 - Open
➡️ Quick scalp reaction at nearby resistance – suitable for trading during London/NY sessions.
2️⃣ SELL Zone 2 – Major Retest at Supply Zone
Entry: 4,043 – 4,060
SL: 4,065
Take Profit : 4,050 - 4,040 - 4,030 - 4,020 - 4,010/Open
➡️ Main setup – retest of confluence supply zone with broken trendline, high probability if strong rejection on H1/H4.
3️⃣ SELL Continuation – Break & Retest below 3,945 USD
Entry: 3,945 – 3,950
SL: 3,965
TP: 3,884
➡️ Setup breaks EqL bottom confirming continuation of downtrend, targeting Premium Zone.
4️⃣ BUY Setup – Reversal at Premium Zone 3,900 USD
Entry: 3,900
SL: 3,880
TP1: 3,910 - 3,920 - 3,930 - 3,940 - 3,950/Open
✅ Condition:
Only buy when a strong reaction candle appears (long-tail rejection / ChoCH bullish on M15–H1).
➡️ This is the final discount zone before major capital can return to the market – technical reversal setup, low risk / high reward.
⚠️ Risk Management
Prioritise SELL at supply zones, BUY at Premium – avoid trading in the middle of the range.
Reduce volume on scalp setups (Sell 1).
If price closes above 4,070 → short-term downtrend is invalidated.
💬 Conclusion
Gold is still under short-term bearish pressure, however, the 3,884–3,900 USD zone may serve as strong support.
The appropriate strategy is to utilise the two resistance zones for Selling and observe technical Buying at the Premium bottom.
👉 Comprehensive Strategy:
Sell 4,010–4,015 | SL 4,025 | TP 4,005 → 3,965 🎯
Sell 4,043–4,060 | SL 4,065 | TP 4,050 → 4,010 🎯
Buy 3,900 | SL 3,880 | TP 3,910 → 3,950 🎯
🔥 “Trade with patience, react at precision zones — that’s how consistency is built.”
⏰ Timeframe: 1H
📅 Update: 28/10/2025
✍️ Analysis by: Captain Vincent

Gold breakdown?After a prolonged uptrend, gold has formed a triangle at the top and on the verge of breakdown. if breaks today and follows on Monday, can give a decent move
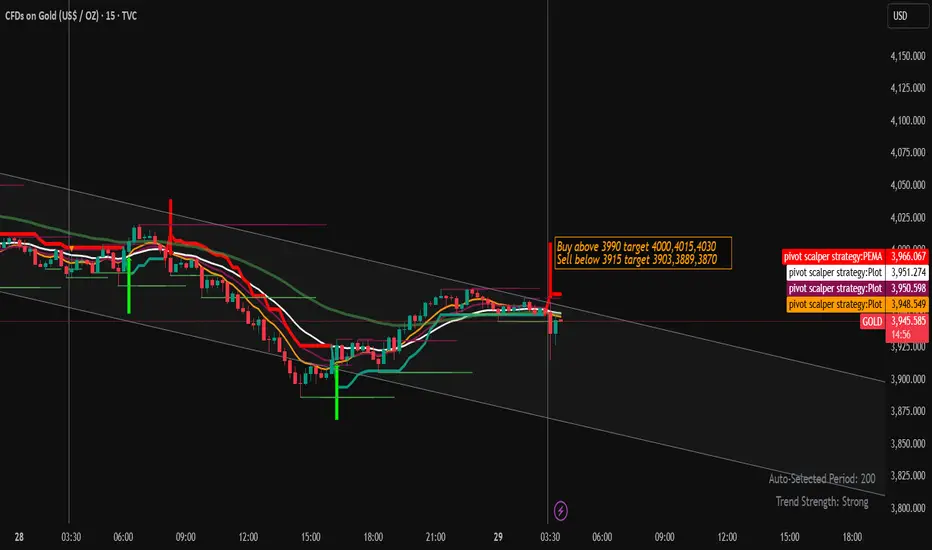
Gold Trading Strategy for 29th October 2025 (IST)🪙 TVC:GOLD Intraday Trading Plan
📈 Buy Setup:
🔹 Entry: Above the high of 15-min candle (Close > $3990)
🎯 Targets: $4000, $4015, $4030
🛑 Stop Loss: Below $3975 (or below candle low for confirmation)
📉 Sell Setup:
🔹 Entry: Below the low of 15-min candle (Close < $3915)
🎯 Targets: $3903, $3889, $3870
🛑 Stop Loss: Above $3930 (or above candle high for confirmation)
⚠️ Disclaimer:
Trading in gold or any commodity involves substantial risk. This plan is for educational and informational purposes only — not financial advice. Always assess your own risk before entering any position. 📊
XAU/USD Completing Wave Y: Final Dip Before RallyGold has completed its major 5-wave rise and is now finishing a corrective W-X-Y pattern. The recent drop looks like the final leg of this correction, meaning sellers are getting weaker. Price may show a small bounce up and then one last dip to complete the correction. After that final drop, a strong new uptrend is expected to start again. In short: correction ending soon, last dip big bullish move ahead.

XAUUSDI was waiting to short gold found this short trade.
Break of Trendline and supply zone plus downtrend this 3 confluence and entered the trade.

Gold Trading Strategy | October 28-29✅ 4-Hour Chart Analysis
Gold remains within a clear downward channel. Since falling from the 4381 level, the price continues to trade below major moving averages (MA5, MA10, MA20), meaning the bearish trend structure is still intact.
Moving Averages:
MA5 and MA10 have formed a bearish crossover and continue to diverge downward, indicating that bearish momentum remains dominant.
MA20 sits above 4050, acting as a strong mid-term resistance.
If price fails to break above MA10 (around 3990), weak downward consolidation is likely to continue.
Bollinger Bands:
The lower band is expanding downward, and gold has remained near the band’s lower edge, signaling continuation of bearish pressure.
The middle band near 4050 remains a key resistance — failure to reclaim it will keep price under downside pressure.
✅ 1-Hour Chart Analysis
After reaching the 3886 low, gold has seen a technical rebound, but price is currently hovering only between MA5 and MA10, showing that upward momentum is limited.
Price is now testing the Bollinger Bands middle line (3960–3970) — a key short-term resistance zone.
If gold breaks and holds above this level, the rebound may extend toward MA20 (3985–3990).
If it fails to break above and pulls back, the rebound concludes and price may retest 3900 or even make a new low.
🔴 Resistance Levels: 3960–3970 / 3985–3990 / 4050
🟢 Support Levels: 3930–3925 / 3885–3890 / 3800
✅ Trading Strategy Reference:
🔰 If gold rebounds to 3985–3990 and shows rejection, consider scaling into short positions, targeting 3930-3925.
🔰 If gold drops to 3880–3890 and stabilizes, consider light-lot long positions, targeting 3930-3950.
✅ Summary
There is short-term rebound demand, but the upside remains limited.
As long as price fails to break above 3990-4000, the bearish structure remains intact.
If gold drops back below 3930, the downtrend is likely to resume with momentum.

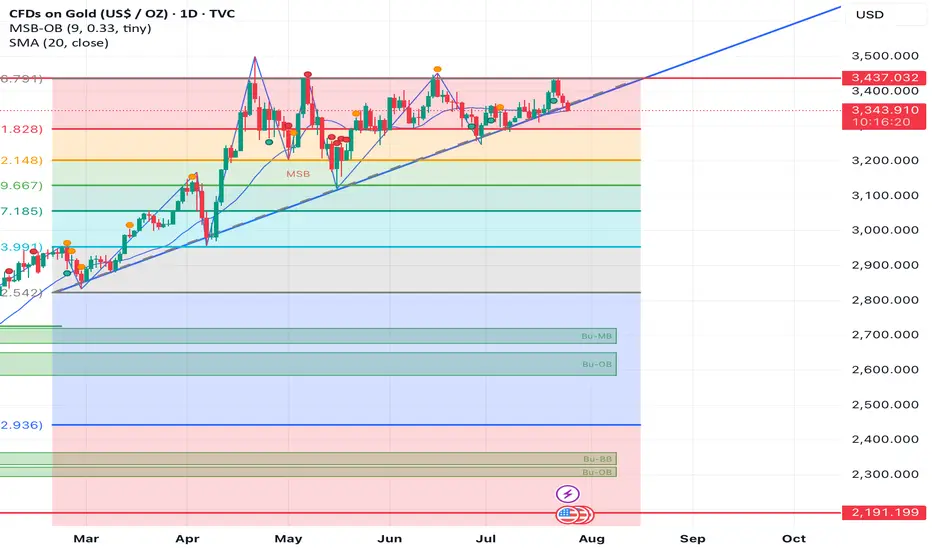
Golden Rally Losing Steam!Following an extended bullish run, gold seems to have completed a double top formation, signaling exhaustion of upward momentum. The emerging head and shoulders pattern reinforces the bearish outlook, with a projected downside target around 3600.

“Gold Rebounds from Demand Zone — Short-Term Recovery Ahead”Analysis:
Gold (XAU/USD) on the 4-hour chart shows a strong corrective decline after forming an SMC trap near the 4,250–4,300 zone, where liquidity was swept before a sharp selloff. Price has now reached the High Probability POI (Point of Interest) around the 3,850–3,880 region, showing early signs of a bullish reaction.
The recent candle structure indicates buyers are stepping in from this demand zone, confirming a potential short-term reversal. If momentum sustains, the first target zone lies around 3,950–3,980, aligning with minor resistance and previous imbalance fill.
Outlook:
📈 Bias: Bullish correction (short-term)
🧭 Key Support: 3,850 – 3,880
🎯 Target: 3,950 – 3,980
⚠️ Invalidation: Break below 3,840 may reopen bearish continuation toward 3,780


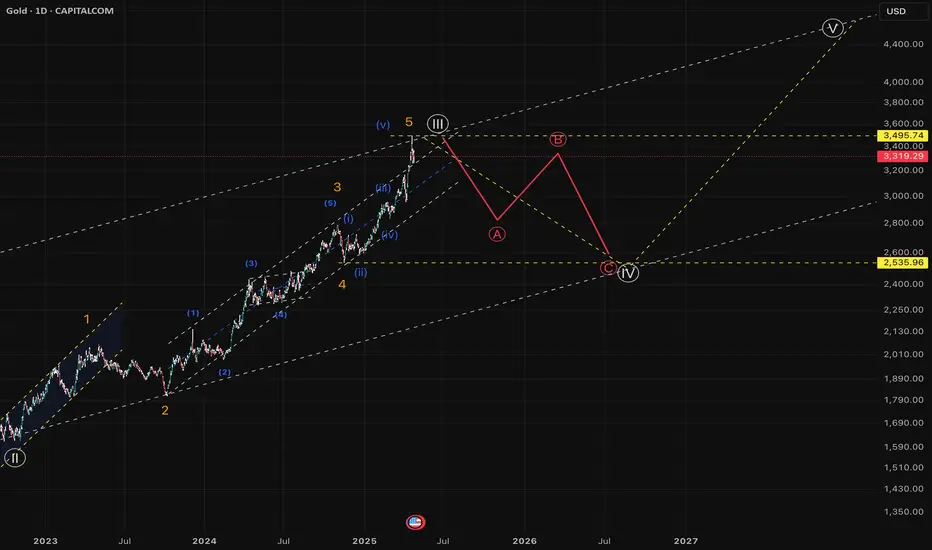
Is GOLD headed to ~2500 as part of correction ?Gold had a good run up from ~1600 levels to ~3500 level.
It seems to have completed Wave3 and has ended week with Shooting start candle.
Invalidation :
This view of correction is invalidated if Gold closes above 3500 as part of weekly close.
The correction time period may be around 6~8 months.,