Gold Reaches Supply Zone: Prepare for a Pullback to FVG📊 Market Structure
Gold continues to maintain its bullish structure after breaking the structure high (BoS) at the 4,000 USD zone and forming a steep bullish channel over the past 3 sessions.
Currently, the price is precisely hitting the Order Block 4,140 – 4,150 USD — a critical supply zone formed from the previous distribution.
The H1 candle is showing slight technical reaction signs , implying the potential for a short pullback to re-accumulate liquidity.
If a pullback occurs, the Premium Zone 4,080 – 4,085 USD and FVG 4,025 – 4,035 USD will be ideal areas to look for buy signals.
The bullish structure is only invalidated if the H1 candle closes below the Support 4,006 USD zone.
💎 Key Technical Zones
• Order Block: 4,140 – 4,150 USD → main supply zone, where profit-taking pressure appears
• Premium Zone: 4,080 – 4,085 USD → medium-term rebalancing zone
• FVG Zone: 4,025 – 4,035 USD → potential discounted price zone for BUY orders
• Support Zone: 4,000 – 4,006 USD → critical defense zone
🎯 Trading Plan
1️⃣ SELL Scalp – Reaction at OB 4,145 USD
If the price continues to react downwards at the 4,140 – 4,150 USD supply zone:
• Entry: 4,143 – 4,147
• SL: 4,155
• TP1: 4,085
• TP2: 4,035
→ Short-term setup, targeting the rebalancing zone before buying back in line with the trend.
2️⃣ BUY Setup – Continuation from FVG Zone
When the price pulls back to the FVG / Premium Zone and creates a confirmed bullish signal:
• Entry: 4,030 – 4,035
• SL: 4,006
• TP1: 4,090
• TP2: 4,145
• TP3: 4,170
→ Trend-following setup, preferred when the price re-accumulates and a clear rejection appears.
🧠 Vincent’s View
Buyers still control the market, but the current OB touch may trigger a short pullback before the bullish wave continues.
The ideal scenario is “tap OB → pullback FVG → continuation,” maintaining a stable bullish structure towards the 4,170 USD target.
“Buy the dip where fear replaces greed — that’s where the next impulse begins.” ⚜️
⏰ Timeframe: 1H
📅 Updated: 11/11/2025
✍️ Analysis by: Captain Vincent
Trade ideas

Gold (XAU/USD): Potential bullish scenarioHey traders 👋
Wishing you a successful trade and a clear mindset today 💫
Gold (XAU/USD): Potential bullish scenario
After a deep correction, gold is showing signs of recovery above the 3980 area. A short-term accumulation zone is forming, which could serve as a base for further upward movement.
The first target is 4050 (TP1) — a breakout of this level may open the way toward 4140 (TP2), where a stronger resistance zone awaits.
However, a confirmed break below 3919 would invalidate this bullish scenario and signal renewed bearish pressure.
📈 TP1: 4050
📈 TP2: 4140
🛑 Invalidation: below 3919
Stay patient and disciplined — consistency always pays off.
Have a successful trade, traders 🌿
— Ivanna Trader

XAU/USD – Retest Before Takeoff📊 Market Structure
After several days of fluctuating within a narrow range, gold has finally broken through the main descending trendline extending from the peak of 4,108 USD.
Buyers are currently controlling the short-term structure by continuously creating BoS (Break of Structure) in the price range of 3,965 – 3,980 USD.
The Order Block 3,970 – 3,975 USD area has become an important dynamic support zone , converging with the newly formed trendline.
If the price continues to hold above this area, there is a high possibility of a light retest to absorb liquidity before breaking out to higher resistance zones.
Above, the Resistance 4,028 USD zone is the first barrier to overcome to confirm the medium-term uptrend, while the Liquidity Zone around 4,070 – 4,080 USD is the extended target of the breakout.
💎 Key Technical Zones
• Order Block (Support): 3,970 – 3,975 USD → potential retest area.
• Resistance Zone: 4,028 USD → first profit-taking point for buyers.
• Liquidity Zone: 4,070 – 4,080 USD → extended target if resistance is successfully broken.
🎯 Trading Scenarios
1️⃣ BUY Scenario – Retest OB:
If the price adjusts to the 3,970 – 3,975 USD area and a confirming candle signal appears (bullish rejection / engulfing):
• Entry: 3,972 – 3,975
• SL: 3,960
• TP1: 4,015
• TP2: 4,028
• TP3: 4,070
→ Prioritize trading with the trend after the uptrend structure is confirmed.
2️⃣ SELL Scenario – Reaction at Resistance:
If the price hits the 4,028 – 4,070 USD area and there is a strong reversal signal:
• Entry: 4,045
• SL: 4,065
• TP1: 4,015
• TP2: 3,985
→ Short-term scalp, only activate if a clear rejection signal appears.
🧠 Vincent’s View
Gold is showing signs of transitioning from accumulation to range expansion .
Breaking the descending trendline is the first signal for a new upward move, as long as the OB 3,970 area remains intact.
Buyers can take advantage of pullbacks to increase their position, targeting 4,070 USD – where significant liquidity converges above.
“Break the line, respect the retest — that’s where smart money joins the move.” ⚜️
⏰ Timeframe: 1H
📅 Updated: 07/11/2025
✍️ Analysis by: Captain Vincent

Gold daily analysisintermediate 5 th wave completed rounded black numbers.Primary 3 wave also completed and now 4 th wave pull back is going on.it has not retraced 23.6 percent as of now.this rounded 3 rd wave red colour is extended one.primary 2 nd wave had retraced 50 percent of 1 st wave. we are waiting for completeion of the red colour 4 th wave .When 3 rd wave is extended it can jump after retracing even 23.6 percent. not sure of it.how it unflods.Daily chart.
Follow me to get updates.
Like this post if it helps you

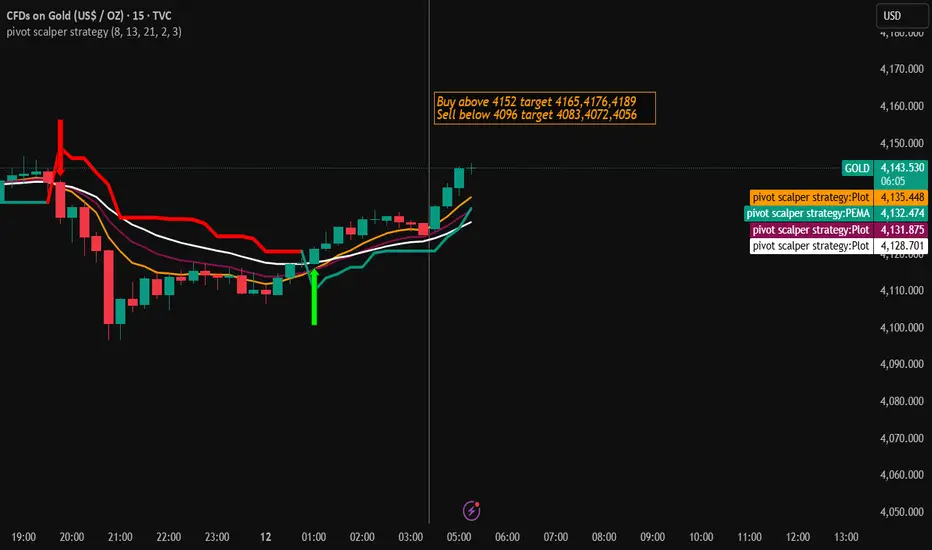
Gold Trading Strategy for 12th November 2025🪙 GOLD Trading Setup (Intraday Strategy)
📈 Buy Setup (Bullish Scenario)
👉 Condition to Enter Buy:
Wait for the 1-hour candle to close above $4152.
This confirms bullish momentum (buyers are taking control).
🎯 Targets after Buy Entry:
Target 1: $4165
Target 2: $4176
Target 3: $4189
🛑 Stop Loss (SL):
You can place your SL just below the breakout candle’s low or around $4140 (for risk control).
💡 Explanation for Beginners:
When the 1-hour candle closes above $4152, it means price has broken an important resistance level. This often attracts more buyers, pushing the price higher toward the target levels.
📉 Sell Setup (Bearish Scenario)
👉 Condition to Enter Sell:
Wait for the 30-minute candle to close below $4096.
This confirms bearish pressure (sellers are taking control).
🎯 Targets after Sell Entry:
Target 1: $4083
Target 2: $4072
Target 3: $4056
🛑 Stop Loss (SL):
Place SL slightly above the breakout candle’s high or near $4110 for protection.
💡 Explanation :
When the 30-min candle closes below $4096, it means the market is showing weakness. This setup allows you to follow the selling momentum as price moves toward lower levels.
⚠️ Risk Management Tips
Never trade without a stop loss.
Risk only 1–2% of your capital per trade.
Avoid entering trades before candle closes — always wait for confirmation.
Stick to your plan; don’t chase trades emotionally.
🧾 Disclaimer
⚠️ This analysis is for educational purposes only and not financial advice. Trading in gold or any financial market involves risk. Always do your own research or consult a financial advisor before making trading decisions.
GOLD SHOWING A GOOD UP MOVE WITH 1:10 RISK REWARD GOLD SHOWING A GOOD UP MOVE WITH 1:10 RISK REWARD
DUE TO THESE REASON
A. its following a rectangle pattern that stocked the market
which preventing the market to move any one direction now it trying to break the strong resistant lable
B. after the break of this rectangle it will boost the market potential for break
C. also its resisting from a strong neckline the neckline also got weeker ald the price is ready to break in the outer region
all of these reason are indicating the same thing its ready for breakout BREAKOUT trading are follws good risk reward
please dont use more than one percentage of your capitalfollow risk reward and tradeing rules
that will help you to to become a bettertrader
thank you

XAUUSD – PRIORITISE BUYING ON TUESDAY💛 XAUUSD – PRIORITISE BUYING ON TUESDAY 🎯
🌤 Overview
Hello everyone 💬
Gold continues its upward momentum in the first two days of the week, supported by the cash distribution policy for low-income individuals and the reopening moves by the US government under President Trump.
These factors are putting downward pressure on the USD, helping gold prices maintain a short-term upward trend.
💹 Technical Analysis
🟣 Currently, the price is touching the VAH area according to the Volume Profile and showing a slight reaction – however, the support trendline around 4110–4113 remains an ideal buying zone to continue following the trend.
🔹 The 4200–4203 area (Fibonacci Extension 2.618) coincides with the strong resistance of H4, likely to see a short adjustment reaction before continuing to extend to the 43xx area.
🎯 Trading Plan Reference
💖 BUY Scenario (priority trend-following)
Entry: 4110–4113 | SL: 4106
TP: 4132 – 4150 – 4175 – 4200 – 4250
💢 SELL Scenario (short-term reaction)
Entry: 4200–4203 | SL: 4207
TP: 4188 – 4165 – 4148
⚠️ Important Notes
Prioritise buying according to the main upward trend, especially when the price reacts at the H4 trendline.
Sell orders are only for short-term reactions, and profits should be secured early when the first TP is reached.
USD volatility remains a key factor to closely monitor this week.
🌷 Conclusion
The upward trend of gold is still maintained 💛
Be patient and wait for the price to react at the 4110–4113 area to buy according to the trend, and take advantage of pullbacks at resistance to manage orders effectively.
If you find this useful, don't forget to 💛 like – 💬 comment – 🔔 follow LanaM2 for daily gold insights ✨

XAUUSDGold is approaching supply zone. From there it can fall to sweep sell side liquidity.
Then again continue to push up from Demand as soon as we get confirmation

Gold Trading Strategy | November 6-7✅ From the 4-hour timeframe, gold experienced a significant pullback after touching 4019 and is currently in a consolidation phase following a short-term rebound failure. The candlesticks have fallen back below the short-term moving averages, while the MACD continues to weaken.
🔸 Moving Average Structure:
MA5 and MA10 have flattened and are slightly turning downward → indicating weakening bullish momentum. MA20 continues to suppress the price, showing clear overhead pressure. Price has returned below the short-term MA cluster, reflecting weakening mid-term upside momentum and fading rebound strength.
🔸 Bollinger Bands Structure:
The middle band (3978–3980) has become a key short-term support. The upper band is narrowing downward, suggesting reduced volatility and short-term consolidation. Candlesticks failed to hold above the middle band, indicating insufficient rebound strength and a corrective sideways structure.
✅ From the 1-hour timeframe, gold staged a technical rebound after a sharp decline, but the strength remains limited and failed to stand above MA20, leaving the price in a weak rebound pattern.
🔸 Moving Average Structure:
MA5 and MA10 are flattening and intertwining, while MA20 applies downward pressure. The moving average convergence signals a consolidation phase.
🔸 Bollinger Bands:
The middle band (3994) serves as short-term resistance, while the lower band (3967) continues to rise, indicating supportive pressure at the bottom. After the bearish momentum was released, a minor technical rebound is reasonable, but the upside remains limited.
🔴 Resistance Levels: 3994–3996 / 4003–4005 / 4015
🟢 Support Levels: 3978–3980 / 3966–3968 / 3942
✅ Trading Strategy Reference
🔰 Rebound Short Setup
If gold rebounds to:
3994–3996 or 4003–4005 and faces rejection → consider light short positions
🎯 Targets: 3980 / 3970
⛔ Stop Loss: above 4008
🔰 Pullback Long Setup
If gold pulls back to:
3978–3980 and stabilizes → consider light long positions
🎯 Targets: 3994–3996
⛔ Stop Loss: below 3968
✅ Overall Outlook:
Gold is currently showing a weak corrective rebound and remains overall bearish. Short-term rebound strength is limited. Unless price can stabilize above 4010–4015, further downside support tests are likely.

StevenTrading – XAUUSD from an Elliott Perspective | Stick to...⚡️ StevenTrading – XAUUSD from an Elliott Perspective | Stick to the trend, wait for precise retest
Hello Trader 👋
📰 Fundamental Analysis
The White House has indicated that the October CPI may not be released on time due to the shutdown impact; a series of data (NFP, CPI 10–11) remains uncertain in timing.
The market, therefore, reduces risk appetite, safe-haven flows keep gold steady, but thin liquidity → prone to two-way swings.
→ This week, prioritise following the main uptrend, but wait for a retest before entering trades.
📊 Technical (H3/H4) – Elliott & S/R, Trendline
Elliott: Wave 5 has hit resistance at 4,150–4,162 and shows signs of an ABC correction.
Key level: 4,075 (support box – point A on chart). Holding above here maintains the uptrend structure.
The H4 uptrend line still supports the price, deeper areas around 4,040–4,043 are potential “point C” if a strong correction occurs.
Important zones:
Resistance: 4,150 – 4,162 – 4,185
Support: 4,108 – 4,076 – 4,063 – 3,986
🎯 Trading Scenarios (for reference)
🟢 Buy following the trend (priority)
Buy #1: 4,076–4,078 · SL 4,070 · TP 4,088 → 4,102 → 4,125 → 4,140
Logic: Retest Key 4,075 + hold trendline ⇒ bounce with the main trend.
Buy #2: 4,040–4,043 · SL 4,036 · TP 4,060 → 4,075 → 4,094 → 4,125
Logic: “Point C” of the ABC wave + lower trendline edge; buy in high liquidity zone.
🔴 Sell reaction (short scalp)
Sell zone: 4,121–4,124 (branch B of ABC) · SL 4,128 · TP 4,110 → 4,098
Note: Enter only with clear rejection on M15–M30 (pin/engulf, false break). Do not hold overnight.
⚠️ Risk & Invalidation
Invalidation of buy setup: H4 candle closes below 4,063 (losing mid-support) or deeper < 3,986 → pause long, wait for new structure.
Invalidation of sell setup: H4 closes above 4,162 (clearly surpassing resistance), especially holding above 4,150 after retest → stop selling, switch to waiting for pullback to buy.
Risk management: maximum 1%/trade; do not chase price in between zones, prioritise orders in identified zones.
Wishing you successful trading.

StevenTrading – XAUUSD continues with the upward scenario⚡️ StevenTrading – XAUUSD continues with the upward scenario
Hello Trader
📰 Fundamental Analysis
Gold prices opened higher in Europe as concerns about the US economic health boosted safe-haven demand.
The Senate reached a temporary agreement to end the government shutdown, reducing systemic risk but not eliminating defensive cash flows.
→ This week's inclination remains upward, prioritising trading in line with the main trend.
📊 Technical
Breakout confirmed: the 4.035 zone has been clearly broken, prices closed above and are forming a retest move in the 4.035–4.045 box.
The H4 uptrend line remains strong, acting as a “support base” for the continuation scenario.
Important zones:
Support: 4.035–4.045 (retest box), 4.006–4.010 (secondary support along the trendline).
Resistance: 4.077–4.100 (near supply), 4.150 (resistance/candlestick & psychology), 4.225–4.292 (higher resistance).
🎯 Trading Scenario (for reference)
🟢 Buy in trend – prioritise when retest holds
Entry: 4.043–4.045
SL: 4.039
TP: 4.077 → 4.100 → 4.150 → 4.225
Logic: Pullback to the 4.035–4.045 box + holding above the trendline ⇒ continuation to upper supply zones.
Adaptation: if the market retests deeply to 4.035–4.038, only consider entering when M30 gives a clear rejection signal (pin bar/engulf) and volume supports.
🔴 Sell reaction – only short scalp at resistance
Zone: 4.150
SL: 4.156
TP: 4.125 → 4.100
Note: Only enter when there is a clear rejection on M15–M30; do not hold overnight when the major trend still supports upward.
⚠️ Risk & Invalidation
Invalidation of buy setup: H4 candle closes below 4.035 (losing retest box); especially below 4.006 (breaking secondary support/trendline) ⇒ pause long, wait for new structure.
Invalidation of sell scalp setup: H4 closes above 4.156/holds 4.150 ⇒ stop selling, wait for pullback to buy.
Risk management: ≤ 1%/trade; enter/exit according to plan, do not chase prices within the zone.
—
The article reflects the personal views of StevenTrading. If you find it useful, please Like & Comment so I can update the plan daily.

XAUUSD Tape readingwaiting for a correction and a sign of continuation on htf , then i will start looking for longs

Advanced Chart Patterns in Technical Analysis1. Introduction to Advanced Chart Patterns
In trading, patterns repeat because human behavior is repetitive. Fear, greed, and hope drive market movements, and these emotions get imprinted in price charts. Advanced chart patterns are an extension of classical technical formations, combining structure, volume, and momentum to forecast price trends. Mastering them helps traders differentiate between false breakouts and genuine opportunities.
Advanced patterns generally fall into two main categories:
Continuation Patterns – Indicating a pause before the prevailing trend continues.
Reversal Patterns – Signaling the end of a trend and the beginning of a new one.
2. Head and Shoulders (Reversal Pattern)
The Head and Shoulders pattern is one of the most reliable reversal signals. It indicates a change in trend direction — from bullish to bearish (standard form) or from bearish to bullish (inverse form).
Structure:
Left shoulder: A price rise followed by a decline.
Head: A higher peak than the left shoulder, followed by another decline.
Right shoulder: A lower rise, followed by a breakdown through the neckline.
Neckline: Connects the lows between the shoulders and serves as a key breakout level.
Once the price breaks below the neckline, it confirms a bearish reversal. The target is estimated by measuring the distance from the head to the neckline and projecting it downward.
Inverse Head and Shoulders works similarly but in the opposite direction — signaling a bullish reversal after a downtrend.
3. Cup and Handle Pattern
The Cup and Handle is a bullish continuation pattern resembling a teacup. It was popularized by William O’Neil in his book How to Make Money in Stocks.
Formation:
Cup: A rounded bottom, showing a gradual shift from selling to buying.
Handle: A short pullback or consolidation that follows the cup, forming a downward-sloping channel.
When the price breaks above the handle’s resistance with strong volume, it often signals a continuation of the prior uptrend.
Target: The depth of the cup added to the breakout point.
This pattern is often seen in growth stocks and long-term bullish markets.
4. Double Top and Double Bottom
These patterns are classic but essential to advanced technical traders due to their reliability and frequency.
Double Top:
Appears after a strong uptrend.
Price makes two peaks at similar levels separated by a moderate decline.
A breakdown below the “neckline” confirms a bearish reversal.
Double Bottom:
Appears after a downtrend.
Two troughs form around the same level with a peak in between.
A breakout above the neckline signals a bullish reversal.
Volume confirmation is crucial — rising volume on the breakout adds credibility to the pattern.
5. Flag and Pennant Patterns
Flags and Pennants are short-term continuation patterns that often appear after a strong price movement, known as the “flagpole.”
Flag: Forms as a small rectangular channel sloping against the main trend.
Pennant: Appears as a small symmetrical triangle following a sharp move.
These patterns typically consolidate the market before the next strong move in the same direction.
Breakout Rule:
When price breaks in the direction of the previous trend, accompanied by high volume, it confirms continuation.
Target Projection:
Length of the flagpole added to the breakout point.
6. Wedge Patterns
Wedges are advanced chart patterns signaling either continuation or reversal depending on their position and direction.
Rising Wedge:
Forms when price makes higher highs and higher lows, but the slope narrows upward.
Typically appears in an uptrend and indicates weakening bullish momentum — a bearish reversal signal.
Falling Wedge:
Forms with lower highs and lower lows converging downward.
Usually appears in a downtrend, indicating a potential bullish reversal.
Volume generally declines during formation and expands during breakout, confirming the move.
7. Symmetrical, Ascending, and Descending Triangles
Triangles represent consolidation phases and serve as reliable continuation patterns.
Symmetrical Triangle:
Characterized by converging trendlines with no clear direction bias.
Breakout direction typically follows the prior trend.
Ascending Triangle:
Horizontal resistance with rising support.
Usually forms during an uptrend, signaling bullish continuation.
Descending Triangle:
Horizontal support with declining resistance.
Typically bearish, indicating continuation of a downtrend.
Triangles are volume-sensitive patterns — declining volume during formation and surge during breakout strengthens reliability.
8. Rectangle Pattern
A Rectangle or Trading Range represents a period of indecision between buyers and sellers.
Formation: Price oscillates between horizontal support and resistance.
Interpretation:
Breakout above resistance → bullish signal.
Breakdown below support → bearish signal.
Traders often trade within the rectangle until a confirmed breakout occurs, using stop-losses near the opposite boundary.
9. Diamond Pattern
The Diamond Top is an advanced reversal pattern that forms after a prolonged uptrend. It begins as a broadening formation (wider price swings) and ends with a narrowing triangle — resembling a diamond shape.
Indicates distribution and market exhaustion.
Once price breaks below the support line, it confirms a bearish reversal.
This pattern is rare but highly reliable when spotted correctly.
10. Harmonic Patterns (Advanced Category)
Harmonic patterns use Fibonacci ratios to predict potential reversals with high precision. These include Gartley, Bat, Butterfly, and Crab patterns.
Gartley Pattern: Indicates retracement within a trend, typically completing at the 78.6% Fibonacci level.
Bat Pattern: Uses deeper retracement levels (88.6%) to identify precise turning points.
Butterfly Pattern: Suggests a reversal near 127% or 161.8% Fibonacci extensions.
Crab Pattern: Known for extreme projections (up to 224% or more), signaling deep retracements.
These patterns require advanced understanding of Fibonacci tools and are used by professional traders for precision entries.
11. Rounding Bottom and Top
Rounding Bottom:
Gradual shift from bearish to bullish sentiment.
Indicates long-term accumulation before a breakout.
Typically seen in major trend reversals in large-cap stocks.
Rounding Top:
Slow shift from bullish to bearish sentiment.
Represents distribution and is often followed by a sustained downtrend.
These patterns form over long durations (weeks or months) and are reliable for positional traders.
12. Broadening Formation
Also known as a megaphone pattern, it shows increasing volatility and investor uncertainty.
Formation: Two diverging trendlines — one ascending, one descending.
Meaning: Early sign of market instability; may precede major reversals.
Trade Setup: Enter once a confirmed breakout occurs beyond the pattern boundaries.
13. Volume and Confirmation in Chart Patterns
Volume plays a critical role in confirming pattern validity. Key principles include:
Decreasing volume during consolidation or pattern formation.
Increasing volume during breakout, confirming institutional participation.
False breakouts often occur on low volume, trapping retail traders.
Combining volume indicators (like OBV or Volume Oscillator) with pattern analysis enhances accuracy.
14. Practical Application and Risk Management
Even the most reliable patterns fail without proper risk management and confirmation strategies.
Wait for breakout confirmation with candle close beyond key levels.
Use stop-loss slightly below support or above resistance.
Combine patterns with momentum indicators like RSI or MACD for confirmation.
Avoid overtrading; focus on quality setups with clear symmetry and volume validation.
15. Conclusion
Advanced chart patterns bridge the gap between price action and trader psychology. They help traders interpret market behavior and anticipate future movements with a structured approach. Patterns like the Cup and Handle, Head and Shoulders, and Wedges reveal not just the direction but also the strength and conviction of trends.
Mastering these patterns requires practice, discipline, and confirmation through indicators and volume. When used correctly, advanced chart patterns empower traders to make informed, high-probability decisions — transforming random price data into profitable trading opportunities.
15 MINUTES CANDLE CHART ANALYSIS$XAU/USD BUY NOW
ENTERY NOW 4006.00
TP 1 4030.00
TP 2 4050.00
TP 3 4070.00
TP 4 4100.00
SL 3964.00
Do not use more than 2X leverage.

XAUUSD – AWAITING CONFIRMATION OF UPTREND – TARGET 4050💛 XAUUSD – AWAITING CONFIRMATION OF UPTREND – TARGET 4050 🎯
🌤 1. Overview
Hello everyone 💬
Gold today remains in a phase of indecision – waiting for signals to confirm a new trend.
On the H2 chart, the price has broken the downtrend line and is retesting this line. The structure of “higher lows” indicates that buying pressure is gradually gaining dominance.
The previous peak around 4018 is currently the decisive point for the trend – if the price confirms a breakout above, the upward momentum may extend towards the 4050 area.
Currently, the market is fluctuating within the range of 3964 – 4018, and needs to break out of this zone to determine a clearer direction.
💹 2. ICT Perspective
📈 The price has broken the downtrend line and retested the structure on the H2 chart – an early signal for the potential formation of an uptrend.
🟣 The area 3964–4018 is a short-term liquidity accumulation zone before the price expands.
🔹 OB 4040–4042 coincides with significant resistance, suitable for short sell orders (scalp) if there is a strong reaction.
💫 When the price surpasses 4018, the upward structure will be confirmed and the expansion target may aim towards 4050 – 4077.
🎯 3. Reference Trading Plan
💖 BUY scenario (priority when confirmed)
Entry: above 4018 | SL: 4011
TP: 4025 – 4033 – 4050 – 4077
💢 Short SELL scenario (scalping)
Entry: 4040–4042 | SL: 4046
TP: 4022 – 4015 – 3998
⚠️ 4. Important Notes
Clear confirmation is needed when breaking the 4018 zone before entering a buy order.
If the price continues to fluctuate within the 3964–4018 range, trading should be limited.
Today is Friday, manage risk more tightly, prioritise accuracy in each order.
🌷 5. Conclusion & Interaction with LanaM2
Gold is showing positive signals 💛
Be patient and wait for reactions around the 4018 zone – this could be the start of a new uptrend if clearly confirmed.

XAUUSD TRADE SETUP @3996.480
stop at AR low 3985.600
tp 4046.615
Last trading day of the week, so caution makes sense. There are a few potential news catalysts that could create some volatility. My bias here is long, and I’m scaling into the position gradually as confluences develop.
Add this pair to your watchlist and monitor price action. Only take the trade if it aligns with your own analysis and directional bias. This isn’t a chase setup — patience matters here.

XAUUSD LOOKING FOR LTF LONGS I'm breakeven out in the last one , I’ll still be actively watching for a lower-timeframe bullish shift during this session.

Gold start buying on dip if break 4060 then 4150-4180 come Gold start buying on dip for nex week 4150-4180 upside will come if break 4060
How My Harmonic pattern projection Indicator work is explained below :
Recent High or Low :
D-0% is our recent low or high
Profit booking zone ( Early / Risky entry) : D 13.2% -D 16.1 % is
range if break them profit booking start on uptrend or downtrend but only profit booking, trend not changed
SL reversal zone (Safe entry ) : SL 23.1% and SL 25.5% is reversal zone if break then trend reverse and we can take reverse trade
Target : T1, T2, T3, T4 and .
Are our Target zone
Any Upside or downside level will activate only if break 1st level then 2nd will be active if break 2nd then 3rd will be active.
Total we have 7 important level which are support and resistance area
Until , 16% not break uptrend will continue if break then profit booking will start.
If break 25% then fresh downtrend will start then T1, T2,T3 will activate
1,3,5,10,15,20 minutes are short term levels.
30 minutes 60 minutes , 2 hours,3 hours, ... 1 day and 1 week chart positional and long term levels

XAUUSD | Gold 4H Breakout Setup | Wait for Retest Before Long Gold is currently trading near the 4H resistance zone after a short-term recovery move. The price is approaching a key supply area where a breakout or rejection can decide the next direction. I am planning a long entry only after a proper retest to avoid chasing the move.
Key Levels:
• Resistance: 4045 – 4075
• Strong Support: 3955 – 3980 (200 EMA zone)
• Major Upside Target after breakout: 4210 – 4230
Trade Plan:
1. Let price approach the resistance zone
2. Wait for breakout and then retest near 4045 – 4075
3. Look for bullish rejection candle to confirm entry
4. If retest holds, next leg up toward 4210 is possible
Why Wait for Retest?
Retest reduces false breakout risk and improves risk to reward. Market is still recovering from a previous strong sell-off, so patience gives a more controlled entry.
Sentiment: Neutral to Bullish
Timeframe: 4H
Style: Swing / Position
Disclaimer:
This is not financial advice, just my personal price structure view.

Gold Breaks Above $4000, Bulls Take Control for $4100.Dollar Index Meets Resistance at 100.35 near 50 Week EMA
.ADP and ISM Non-Manufacturing data improved sentiments.
.Fed signals dovish tilt in monetary policy shift.
.Mid east tensions and global concerns on economic growth support safe haven demand.
.Gold gains strong momentum on breakout above $4000 psychological zone.
What's Going on in Gold?
After historical one sided bullish rally in Gold the technical indicators were extremely overbought with Monthly RSI reading above 92 screaming for a healthy price correction long overdue and the metal price has witnessed almost $500 correction since then, from $4380 down to $3886 which is very close, just $40 away from 50% Fibonacci retracement zone of $3846
The recent few weeks have witnessed dramatic volatility surge and several unseen records like a $300 intraday drop from the record high and wild swings like a giant roller-coaster.
The recent downward spike that dragged Gold prices to $3929 has attracted buyers once again leading to strong breakout above the psychological mark of $4000 reaching $4017 which is lower boundary of immediate resistance bracket $4017-$4028
What's Likely Scenario Ahead for Bulls?
This $4017-$4028 zone is significant as solid demand accumulation above this zone will extend rebound towards next resistance cluster of $4060-$4085 above which $4100 sits as next critical resistance.
If macro factors align together in favour of safe haven demand for Gold with consolidated break above $4100, the probability for bullish rebound extending further would increase with potential upside reaching $4130 followed by $4190 in near term.
Will the Bullish Rally Pause at $4200?
The probability of current rebound extending or pausing is purely subject to price reaction to key price levels aligned with Fibonacci retracements.
As of now considering the strong breakout above $4000 psychological mark and current consolidation above $4010, a strong push above $4018-$4020 will extend move to $4028-$4035-$4045 while next effective resistance areas are $4060 and $4085 with major hurdle $4100 which may act as supply zone.
If the rally has to pause, price action needs to be monitored at $4060 and $4085-$4100 for signs of rejection and momentum exhaustion.
If price resistance shows rejection on the critical areas, a sell off may be witnessed towards $4000-$3975
Short Term Outlook:
The breakout and price consolidation above $4000 is supportive for a short term bullish rebound which initially targets $4030-$4045-$4060 followed by $4085-$4100
Any pullback towards $3975-$3965 is likely to attract buyers on dips.

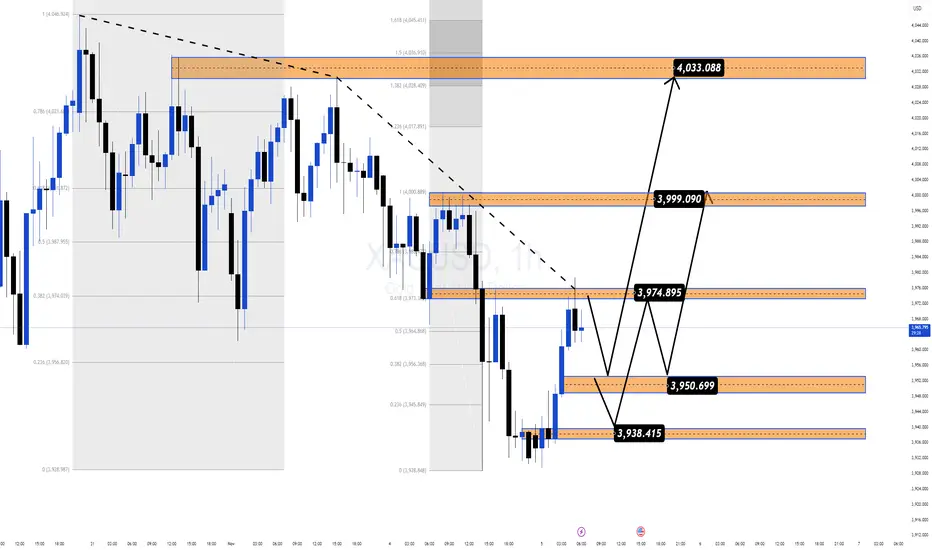
Gold Rebuilds Structure Above $3940, Eyeing $4030 Liquidity Pool🔍 Market Context
Gold is attempting to regain bullish momentum as safe-haven demand remains supported by rising geopolitical tensions and uncertainty around the upcoming US ADP employment data.
The market continues to oscillate between risk aversion and rate expectations — with the Fed’s hawkish tone keeping the Dollar capped but steady.
At the same time, capital flow rotation from equities into defensive assets is quietly supporting the metal’s structural recovery, with gold holding above key liquidity levels despite intraday volatility.
📊 Technical Analysis (H1–H4)
After forming a double-bottom structure near $3,938, XAU/USD has reclaimed the 38.2% retracement zone (3,974–3,975) from its previous bearish leg.
This area now acts as a pivot zone, separating short-term bullish continuation from potential retracement.
The chart reveals a classic liquidity cycle shift:
Phase 1: Sweep of downside liquidity below 3,930, marking an internal structural low.
Phase 2: Expansion leg reclaiming short-term FVGs, signaling a potential smart money accumulation phase.
Phase 3: Repricing toward upper liquidity targets aligned with Fibonacci extensions.
Key Technical Zones:
• 💎 Liquidity Base: 3,938 – 3,950 (recent demand re-entry area)
• 🎯 Rejection Zone 1: 3,974 – 3,999 (previous inefficiency block)
• ⚙️ Target Zone: 4,033 – 4,045 (1.272–1.618 Fibo extensions, liquidity pool)
• ⚠️ Invalidation: Break below 3,920 would shift structure back to distribution.
🎯 MMFLOW Scenario
If gold sustains above the 3,950 support cluster, buyers are likely to extend the retracement toward 3,999–4,033 where resting liquidity sits.
A clean rejection from 4,000 could trigger an intraday pullback — but as long as price holds above the 3,938 OB base, the bullish recovery structure remains intact.
The short-term narrative favors controlled accumulation, suggesting that smart money is building positions into liquidity zones before the next impulsive move.
⚜️ MMFLOW Insight:
“Liquidity isn’t random — it’s engineered. Every move leaves a footprint, and gold is tracing its next one above $3,950.”
Elliott Wave Analysis – XAUUSD | November 11, 2025🔹 Momentum
• D1 timeframe:
Daily momentum has closed, showing that bullish strength is fading. We’ll wait for today’s daily candle to confirm whether a reversal is forming.
• H4 timeframe:
The two momentum lines are sticking together — this indicates that while upward pressure remains, it is weakening, suggesting a possible formation of wave X top.
• H1 timeframe:
H1 momentum is turning down from the overbought zone. With all three timeframes (D1, H4, H1) aligned, the current price area is likely marking a wave top.
________________________________________
🔹 Wave Structure
• D1 timeframe:
The corrective wave (4) is still developing. Once D1 momentum fully reverses and moves into the oversold zone, it may mark the final stage of the correction phase.
• H4 timeframe:
Price has reached the wave X target area around 4145.
With both D1 and H4 momentum in the overbought zone and starting to turn down, this level is likely the completion of wave X.
After that, price may begin a decline to complete wave Y.
The duration of wave Y is expected to correspond to the time it takes for D1 momentum to move from overbought to oversold.
• H1 timeframe:
The red 5-wave structure has completed, with price currently in wave (5).
The target area for wave (5) lies between 4145 and 4050, overlapping with the wave X target zone.
Therefore, the sell entry from yesterday around 4145 remains valid.
________________________________________
🔹 Trading Plan
• Sell Zone: 4145 – 4147
• Stop Loss: 4165
• Take Profit 1: 4075
• Take Profit 2: 4046
• Take Profit 3: 3932
⚠️ Note: If price closes below 4046, it will confirm that purple wave Y is in progress.
In that case, the target of wave Y could extend below 3855.
