Gold Trading Strategy | November 5–6✅ On the 4-hour timeframe, gold has gradually entered a weak consolidation and corrective phase after the previous decline. The current candlesticks are fluctuating near the Bollinger middle band (around 3984).
🔸 The MA5 and MA10 are flattening and slightly pointing downwards, indicating limited short-term bullish momentum. MA20 is suppressing the price, reflecting clear upside pressure. The moving averages remain in a bearish alignment, suggesting strong overhead resistance. This implies that the medium-term structure is still weak, and the current rebound is corrective in nature.
🔸 The Bollinger Bands continue to narrow, with the middle band (3984) acting as a key resistance zone, while the upper band (4037) provides significant pressure. Lower highs in the candlestick structure indicate a weak rebound with pullback confirmations.
✅ On the 1-hour timeframe, gold is forming a continuous staircase-style rebound, showing obvious short-term bullish rhythm.
🔸 The MA5, MA10, and MA20 are aligned in a bullish formation, with the candlesticks consistently trading above the MA5, and the MA20 providing solid support from below. This reflects short-term strength. If the price breaks above the 3990–3995 resistance zone, it may open further upside potential.
🔴 Resistance levels: 3988–3990 / 3995–4000 / 4030
🟢 Support levels: 3975–3978 / 3963–3965 / 3930
✅ Trading Strategy Reference
🔰 Rebound Short Setup
If gold rebounds to 3990–3995 and faces rejection,
→ Consider light short positions,
🎯 Targets: 3978 / 3975
⛔ SL above 4002
🔰 Pullback Long Setup
If gold pulls back toward 3975–3978 and stabilizes,
→ Consider light-lot long positions,
🎯 Targets:3988–3990
⛔ SL below 3968
🔥Trading Reminder: Trading strategies are time-sensitive, and market conditions can change rapidly. Please adjust your trading plan based on real-time market conditions.
Trade ideas

LiamTrading – XAUUSD H2 | A corrective phase might occur todayLiamTrading – XAUUSD H2 | A corrective phase might occur today
Follow Liquidity 4090, FVG 4053–4069 & VAH ~4025
Quick glance: Gold remains in an uptrend but shows signs of stalling at the upper boundary of the rising channel. With the USD potentially volatile as the US nears “reopening”, a technical correction towards liquidity zones is a scenario to prepare for.
Technical Analysis
Trendline/Price Channel: Price is moving within an ascending channel; the channel top around 4130–4140 is prone to profit-taking/stalling.
Liquidity: 4085–4092 – a price pull/volume attraction point before choosing the next direction.
FVG #1: 4053–4069 – a price gap likely to fill and rebound.
VAH (Volume Profile): 4023–4028 – volume value peak; strong confluence support during deep corrections.
POC: ~3985–3990 – a magnetic level if the market weakens more than expected.
Resistance: 4135–4140 (near channel top + short-term offer), further 4166 (Fibo/channel top extension).
Fibonacci: The latest upward wave shows the expansion area around 4135–4166 as a “liquidity pocket” – suitable for scalp sell upon clear rejection; retracement levels 0.382–0.5 converge around 406x–402x, matching FVG & VAH → priority buy point if price corrects.
Trading Scenarios
Buy shallow pullback (trend-following)
Entry: 4083–4085
SL: 4077
TP: 4098 → 4112 → 4140 → 4166
Note: Require rejection/wick at Liquidity 4090; move SL to breakeven at +1R.
Buy deep at VAH/Volume Profile
Entry: 4025–4028
SL: 4020
TP: 4040 → 4065 → 4100 → 4112
Note: Prioritize when FVG 4053–4069 fills and rebounds; exercise caution with volume.
Sell scalp at channel resistance (counter-trend)
Entry: 4135–4140
SL: 4148
TP: 4122 → 4105 → 4090
Note: Only a scalp trade; abandon if H1/H2 closes strongly above 4140.
H1/H2 closes below 4077 → risk of testing 4053–4069; breaking further 4020 might drag to POC ~3990.
Each trade risks 0.5–1%, do not average against the trend; adhere to Dow (enter only when support/resistance is confirmed broken on entry timeframe).
Which level are you watching for gold today? Comment below & hit Follow on LiamTrading channel for the fastest updates.

LiamTrading – Gold confirms medium-term uptrendLiamTrading – Gold confirms medium-term uptrend
Gold has officially broken the downward trendline, confirming the transition phase to a medium-term uptrend. After a prolonged accumulation phase, the market is beginning to show clear buying power, and the potential for an extended rally is gradually forming.
Macro – Fundamental Analysis
The latest report from the World Gold Council (WGC) shows that central banks continued to increase gold purchases significantly in September, totalling 39 tonnes, the highest level since the beginning of the year.
Most notably, the Central Bank of Brazil – for the first time this year – added 15 tonnes of gold to its national reserves.
Since the beginning of the year, the net purchases by central banks have reached 200 tonnes, clearly reflecting the trend of moving away from the USD amidst global economic and geopolitical instability. This capital flow provides a solid foundation for the medium and long-term uptrend of gold.
Technical Analysis
On the H2 chart, gold prices have broken the downward trendline, signaling a reversal and establishing a new upward structure.
The 3985–3988 zone is acting as dynamic support, potentially serving as a retest point before prices continue to rise.
The POC of the Volume Profile at the 4015–4017 zone is a short-term resistance, where the market may see profit-taking reactions before breaking higher.
The 4046 mark is considered a decisive zone; if surpassed and held, the medium-term uptrend will be strongly reinforced.
Today's Trading Scenarios
Scenario 1 – Buy in line with the uptrend:
Entry: 3986–3988 (may wait for retest confirmation)
SL: 3980
TP: 4020 – 4045 – 4090
Scenario 2 – Short sell at resistance:
Entry: 4015–4017
SL: 4023
TP: 4002 – 3986
Summary
Gold is giving clear signals of establishing a medium-term uptrend, supported by buying flows from central banks. Traders should prioritise buying positions at strategic support zones and observe price reactions around the POC to confirm the next direction.

XAUUSD/GOLD 1H SELL PROJECTION 11.11.25XAUUSD/GOLD 1H Sell Projection (11.11.25) chart.
Here’s a quick technical breakdown of what this chart represents:
🟣 Setup Overview
Pair: XAUUSD (Gold)
Timeframe: 1 Hour (H1)
Bias: Bearish (Sell Setup)
🧩 Key Levels
Resistance / High: 4148.82
Stoploss: ~4141.63
Entry Zone: ~4129.45–4128.32
Target 1 (TP1): Around 4110 (S1 + FVG zone)
Target 2 (TP2): Around 4081 (S2 zone)
📉 Projection Logic
Price rejected from major resistance at 4148.
A short-term pullback / retracement is expected into the entry zone.
After possible retest, price is expected to drop towards TP1 and TP2.
The setup suggests a Risk-Reward Ratio (RRR) of roughly 1:2.5 to 1:3, favoring the sell side.
⚙️ Trading Idea Summary
Parameter Value
Bias Sell
Entry Range 4128–4130
Stop Loss 4141
Take Profit 1 (TP1) 4110
Take Profit 2 (TP2) 4081
R:R Ratio ≈ 1:3
Confirmation Bearish engulfing or rejection from resistance zone

XAUUSD Scalp Tape readingThese were my last two scalps on XAUUSD from the previous session (mid-NY). This is how I was reading the tape at that time.

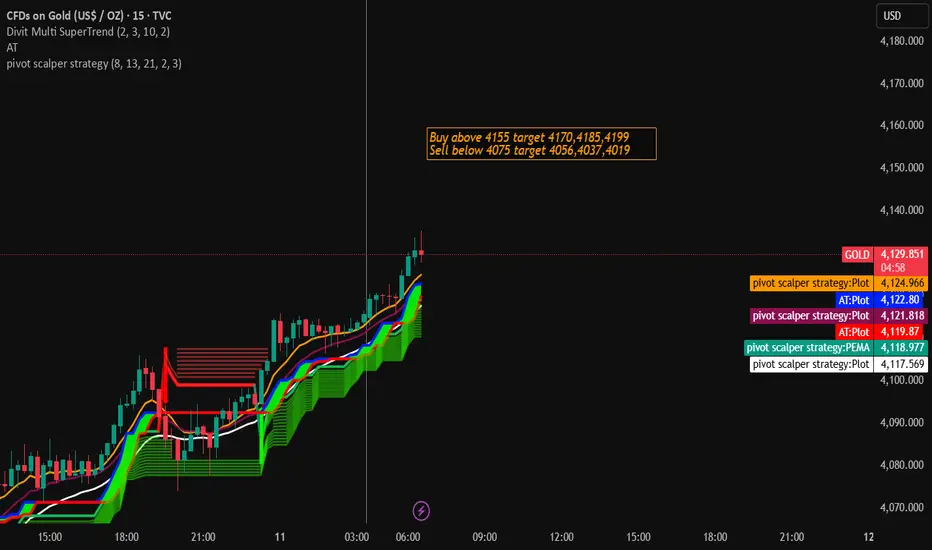
Gold Trading Strategy for 11th November 2025🟡 GOLD INTRADAY TRADING PLAN 💰
📈 BUY SETUP – BULLISH SCENARIO
If Gold shows strong momentum on the 1-hour chart and closes above $4155, it signals potential continuation of the uptrend.
Traders can look for buying opportunities once a candle closes and confirms above the high of that hour.
📋 Buy Entry Conditions:
✅ Wait for a 1-hour candle to close above $4155
✅ Confirm with good volume or strong bullish candle formation
✅ Enter above the candle’s high after confirmation
🎯 Upside Targets:
1️⃣ $4170 – Initial intraday resistance; partial profit zone
2️⃣ $4185 – Secondary resistance; hold with trailing stop
3️⃣ $4199 – Final target for the session
🛡️ Suggested Stop Loss:
Place a protective stop below $4140 or below the candle’s low (depending on your risk tolerance).
📊 Commentary:
A close above $4155 may attract fresh buying interest from intraday and short-term traders. Sustained trading above $4170 could strengthen bullish momentum toward higher targets.
📉 SELL SETUP – BEARISH SCENARIO
If Gold weakens and the 1-hour candle closes below $4075, it could indicate that sellers are gaining control.
A close below this level suggests a possible shift in short-term trend direction.
📋 Sell Entry Conditions:
✅ Wait for a 1-hour candle to close below $4075
✅ Enter below the candle’s low once price confirms breakdown
✅ Ensure downside momentum with volume confirmation
🎯 Downside Targets:
1️⃣ $4056 – First target; book partial profits
2️⃣ $4037 – Second target; hold position with trailing stop
3️⃣ $4019 – Final intraday target zone
🛡️ Suggested Stop Loss:
Place a stop loss above $4090 or above the breakout candle’s high.
📊 Commentary:
A confirmed close below $4075 can trigger a short-term bearish wave. Further weakness toward $4050–$4020 may be expected if sellers maintain control.
⚠️ Disclaimer
📜 This information is for educational and informational purposes only.
It is not financial advice or a recommendation to buy or sell any asset.
Trading in commodities like Gold involves risk of capital loss. Always do your own analysis and use strict risk management before entering any trade.
#Gold | #XAUUSD 4H Update🔴 Price testing key resistance zones
🚧 $4129-$4133 / $4160-$4162
⚠️ Strong supply area — consider booking profits or tightening stops on longs.
👀 Only a clean 4H close above $4162 can open the way to $4185-$4205 .
#Gold TVC:GOLD #XAUUSD #PriceAction #Commodities #Trading #Forex #ChartPattern
📌 #Disclaimer: This analysis is shared for educational purposes only. It is not a buy/sell recommendation. Please do your own research before making any trading decisions.

Gold Breaks Out from Accumulation, Eyes Wave 3 Expansion🔍 Market Context
Gold kicked off the new week with strong upside momentum, perfectly aligning with MMFLOW’s previous outlook — calling for a Wave 3 impulse from the accumulation base around 3,940$ – 3,970$.
The market’s reaction in early Asia confirmed a bullish structural shift, as gold continues to gain traction amid stable yields and cautious sentiment around the US Dollar.
Macro catalysts remain balanced, but liquidity behavior suggests smart money is loading into the breakout phase, positioning early for a potential run toward the 4,100$ handle this week.
If momentum sustains, this move could mark the official mid-term reversal that MMFLOW anticipated — setting up a broader recovery phase into year-end.
📊 Technical Outlook (H4 Structure)
Gold continues to follow its Elliott Wave recovery path, now developing Wave (3) within the medium-term bullish cycle.
Key Technical Zones:
• 💎 Support: 3,942$ – 3,982$ (accumulation base & breakout retest)
• 🎯 Target 1: 4,072$ – 4,133$ (Wave 3 completion zone)
• ⚙️ Target 2 / Extended: 4,189$ – 4,201$ (Fibo 1.618 extension)
• ⚠️ Invalidation: Below 3,940$ → loss of short-term momentum, return to neutral structure.
The breakout above 4,000$ reinforces bullish sentiment, while higher highs and sustained volume through 4,072$ would confirm a new impulsive phase with room to expand further.
🎯 MMFLOW TRADING View
This breakout isn’t random — it’s a smart-money-led accumulation exit after weeks of liquidity sweeps.
The narrative remains consistent: “Buy the dips inside strength.”
As long as gold stays above 3,970$, the probability of retesting 4,100$+ remains high, and a move toward 4,200$ before year-end cannot be ruled out.
⚜️ MMFLOW Insight:
“When the crowd hesitates, liquidity has already chosen direction.”

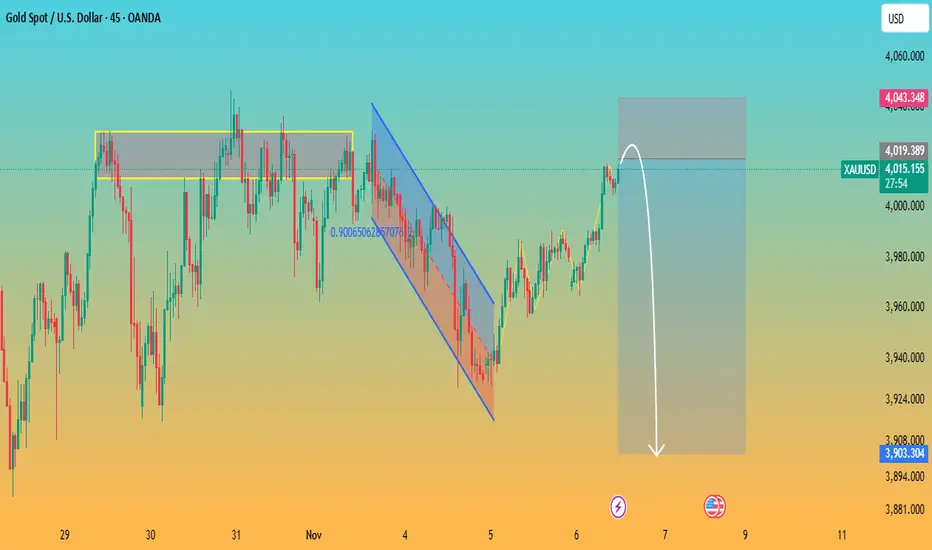
Gold Rejection at Resistance with Potential Bearish PullbackAnalysis:
The chart shows XAUUSD approaching a strong horizontal resistance zone around 4015–4020, a level where price has previously been rejected multiple times (highlighted in yellow). The market recently broke out of a falling channel, showing short-term bullish momentum, but now price is stalling again at this key resistance.
The grey zone above suggests a supply area, and the white arrow indicates a projected bearish move. As long as gold stays below this resistance, the probability of a downward correction increases.
A potential bearish target appears around 3900–3920 (previous support zone), where buyers may re-enter.
Key Points:
Strong multi-touch resistance at 4015–4020
Price showing early rejection signs
Bearish correction likely if price fails to break above resistance
Downside targets: 3920, possibly 3900
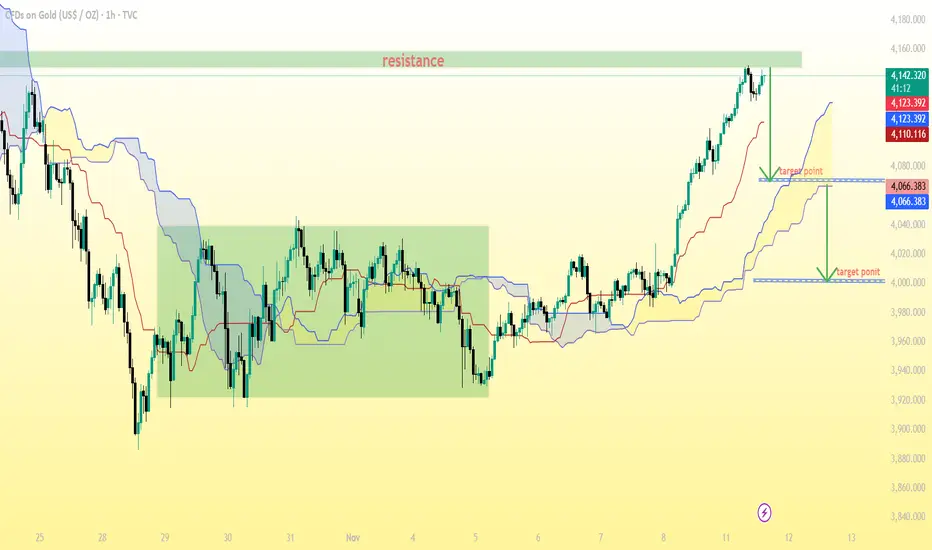
GOLD (XAU/USD) 1-hour chart Pattern..GOLD (XAU/USD) 1-hour chart with Ichimoku Cloud, and my marked resistance and two target points.
Here’s the analysis based on what’s visible:
Current price: Around $4,141 (based on my chart labels).
Resistance zone: Around $4,140 – $4,150, which is where price is currently testing.
Upper target point (minor correction target): Around $4,123 – $4,125.
Lower target point (major correction target): Around $4,066 – $4,070.
📊 Interpretation:
If price fails to break resistance (4,150) and forms rejection candles, it could retrace toward:
Target 1: $4,123 (short-term support)
Target 2: $4,066 (cloud base and major support zone)
If price breaks and holds above 4,150, then the bullish trend can extend further upward, possibly toward $4,180–$4,200.
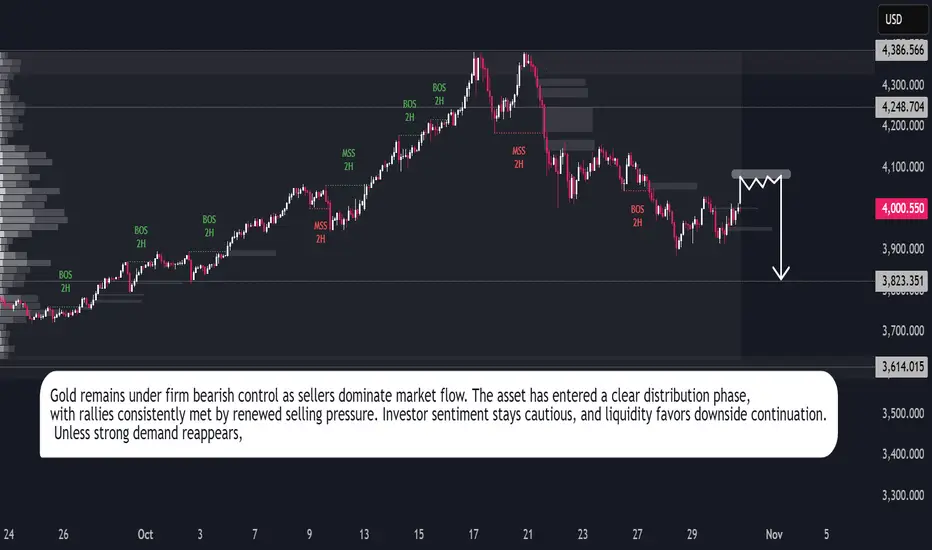
Gold Outlook: Bears Stay in ControlGold continues to operate within a bearish market environment characterized by persistent liquidation and declining momentum. The recent structural shift reflects an ongoing reallocation of capital away from defensive metals toward higher-yield instruments, signaling a broader change in market positioning.
Trading activity indicates that each upward movement is being met with renewed selling interest, suggesting limited participation from institutional buyers. This behavior aligns with the prevailing sentiment of caution, as investors prioritize stability over speculative exposure.
The broader outlook remains subdued, with market conditions favoring continued downside until clearer evidence of renewed demand emerges. Gold’s performance reflects a phase of market adjustment, where declining liquidity and moderate volatility reinforce the persistence of bearish sentiment across the short-term horizon.
StevenTrading – XAUUSD Strategy for Gold in an Upward ChannelStevenTrading – XAUUSD
Strategy for Gold in an Upward Channel
Hello everyone, StevenTrading is back with today's gold insights – a deeper analysis of price behaviour as global capital flows are undergoing significant shifts.
The latest data shows that gold investment funds recorded a net outflow of -7.5 billion USD last week as investors took profits after a historic rise. Notably, the previous week saw an inflow of +8.5 billion USD, reflecting the extreme volatility of capital flows.
In the last 4 months, gold funds have still attracted a total of +59 billion USD, indicating that institutional money maintains a positive trend, despite short-term adjustments.
📰 Fundamental Analysis – Market Perspective
The main driver keeping gold strong is the rotation of capital between assets amid abundant global liquidity.
With persistent inflation and central banks maintaining a cautious stance, investors tend to take temporary profits but still keep a portion of gold in their portfolios.
Short-term selling pressure is thus merely a phase of re-accumulation, not a signal of trend reversal.
As long as global liquidity is not tightened, gold will maintain its upward momentum in the medium to long term.
📊 Technical Analysis – Trading Strategy in the Price Channel
On the chart, gold continues to move within an upward price channel, with no signs of breaking the structure.
Currently, the price fluctuates within the 396x – 404x range, indicating a temporary equilibrium state.
The market respects the upper and lower boundaries of the price channel, creating opportunities for short-term trades at the boundaries while awaiting clear breakout signals.
Main mindset: As long as the price holds the upward channel structure, prioritize Buying at the lower trendline and short Selling at resistance areas, waiting for confirmation signals to enter trades.
🎯 Trading Scenarios (Action Plan)
🔴 Sell Scenario – When the price fails at resistance:
If the price slightly breaks the resistance and then reverses, a sell setup will be activated.
Entry: Sell 3978 after confirming price rejection.
SL: 3985
TP: 3962 – 3946 – 3922
🟢 Buy Scenario – Buy when the price bounces from the trendline:
If the price adjusts to touch the upward trendline and bounces strongly, this is the area for trend-following entries.
Entry: Buy 3993 after confirming trendline reaction.
SL: 3985
TP: 4010 – 4048 – 4103
📌 Steven's Notes
The overall structure still leans towards an uptrend, but the market is in a liquidity hunting phase, suitable for short-term and flexible trading.
Maintain discipline, only enter trades in clearly confirmed areas, and always manage risk tightly.
This week's success comes from patience and precision in every entry.

XAUUSD 1HRSWING TRADE
- EARN WITH ME DAILY 10K-20K –
XAUUSD Looking good for Downside..
When it break level 3929 and sustain.. it will go Downside...
SELL @ 3929
Target
1st 3887
2nd 3854
Enjoy trading traders.. Keep add this STOCK in your watch list..
Big Investor are welcome..
Like this Post??? Hit like button..!!!
Follow me for FREE Educational Post and Alert..

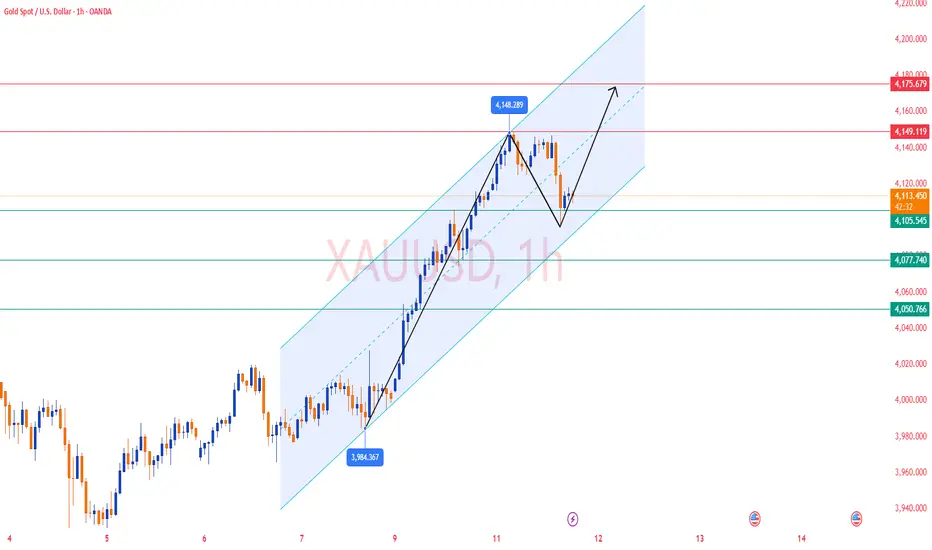
Gold Analysis and Trading Strategy | November 11-12✅From the 4H chart, gold experienced a strong bullish rally after breaking above the 4077 pivot level and reached a recent high of 4148.99.
However, after consecutive bullish candles, the price faced resistance near the upper Bollinger Band (4154.85) and has since pulled back slightly.
Currently, the price is hovering near 4110–4115, just above the MA10 (4104.83) and MA20 (4051.26) — this area serves as a short-term support zone.
The Bollinger Bands remain in an expanding state, indicating that overall volatility is still active.
If the price stabilizes above 4105–4110, the bullish structure remains intact; a break below this zone could trigger further pullback toward 4077–4050.
✅On the 1H timeframe, gold shows a short-term correction after peaking at 4148.
MA5 and MA10 have formed a bearish crossover, and the price is currently below them, signaling short-term bearish pressure.
Bollinger Bands are starting to narrow, reflecting decreasing volatility and a possible sideways consolidation phase.
The MACD has formed a dead cross, and the momentum indicator shows continued downside pressure, but near-term support appears around 4107–4090.
🔴 Resistance levels: 4148 / 4155 / 4175
🟢 Support levels: 4105 / 4077 / 4050
✅ Trading Strategy Reference
🔰 If gold rebounds to 4145–4148 and faces resistance, consider light short positions, targeting 4105–4077, with a stop loss above 4155.
🔰 If gold drops to 4100–4110 and stabilizes, consider short-term long positions, targeting 4130–4150, with a stop loss below 4065.
📈The overall structure remains bullish on higher timeframes, but short-term correction pressure is visible.
In the near term, focus on the 4100–4145 trading range — sell high, buy low within the band, and wait for a clear breakout to determine the next major direction.
Gold – Bullish Trendline Retest Points Toward Move to 4,120 USDAnalysis (English):
Gold (XAU/USD) is maintaining a clear bullish uptrend, supported by a strong ascending trendline. After a sharp push upward, the price is now pulling back, moving toward a key demand zone aligned with the trendline.
The chart projection indicates a likely scenario:
✅ Bullish Scenario (Most Probable)
Price corrects down into the demand zone and touches the trendline.
Buyers step in and defend the level.
A bullish continuation move develops, pushing price toward the upper resistance zones at:
4,100 USD
4,115 – 4,120 USD
As long as the price remains above the trendline, the bullish structure stays intact.
⚠️ Bearish Risk
If the price breaks below the trendline (around 4,050 USD), momentum could slow and shift into a deeper correction.

XAUUSD – PRICE STRUCTURE UPDATE: MAINTAINING THE TRADING ...💛 XAUUSD – PRICE STRUCTURE UPDATE: MAINTAINING THE TRADING SCENARIO 🎯
🌤 Overview
Hello everyone 💬
The price structure of gold is still on track as per the previous scenario — those who have bought according to the prior plan might have already profited and should continue to hold their ground.
The price in the Asian session at the start of the week has risen steadily, breaking through the 4021 zone, confirming a short-term uptrend and aiming to retest the upper edge of the H4 price channel.
This is a positive signal before the market might enter a deeper correction in the mid-week sessions.
In terms of news, the latest statement from US President Trump indicates that the government shutdown might soon end — this is a factor that could cause significant USD volatility, thereby having a short-term impact on gold prices.
💹 Technical Analysis
📈 On the H4 frame, the price remains within the medium-term upward channel, maintaining the structure of “higher lows”.
🟣 Breaking the 4021 zone confirms that upward momentum is prevailing, and the Sell Zone Liquidity 4090–4100 continues to be the short-term target for testing.
🔹 After hitting this zone, a correction is expected towards the 3920 – 3785 zone (Buy Zone Fibonacci) – where buyers might return strongly.
💫 The current price signal is entirely in line with the previous technical scenario, with no need to change the trading plan.
🎯 Reference Trading Plan
💢 SHORT scenario (short-term)
Entry: 4098–4102 | SL: 4112
TP: 4078 – 4025 – 3998 – 3920 – 3875 – 3785
💖 LONG scenario (long-term strategy)
Entry: 3785–3789 | SL: 3777
TP: 3810 – 3865 – 3925 – 3988
🌷 Conclusion
Gold prices are moving exactly as predicted in the structure 💛
Be patient, maintain discipline, and stick to the key price zones – this is the time when perseverance will yield the greatest advantage.

Gold 1H – Is This Pump Temporary or the Start of a Bigger Move?🟡 XAUUSD – Intraday Smart Money Plan | by Ryan_TitanTrader
📈 Market Context
Gold extended its bullish leg overnight, driven by a sharp upside displacement following a clean ChoCH on the H1 structure.
However, the impulsive rally is now pushing deep into premium territory, where higher-timeframe supply begins to re-enter the picture.
Market sentiment remains cautious ahead of U.S. consumer confidence data and upcoming comments from several Fed officials.
• A hawkish tone could strengthen the dollar intraday, making the current rally vulnerable to a pullback.
• A neutral or dovish signal may allow gold to sweep higher liquidity before forming its next decisive move.
Price is currently tapping into resting buy-side liquidity above 4060–4070, with the next pool sitting just beneath the 4090 supply zone, making this an ideal location for short-term reversals.
🔎 Technical Analysis (1H / SMC Style)
• Structure: H1 bias remains bullish after the major ChoCH, but price is now entering an exhaustion phase as it reaches unmitigated supply.
• Premium Zone: 4090–4088 aligns with the freshest H1 supply, formed right before the displacement — a prime location for a short-term reversal.
• Liquidity Sweep: The candles show aggressive wicks into higher liquidity, suggesting the market may engineer one final sweep into 4090 before rotating downward.
• Discount Zone: 3974–3976 lines up with unmitigated demand and sits directly below the previous accumulation range — an ideal discount level for continuation buys if price retraces.
🔴 Sell Setup (High-Probability Reversal)
• Entry: 4090 – 4088
• Stop-Loss: 4100
• Take-Profit Targets: → 4040 (first liquidity pocket) → 4005 (return to structure) → 3976 (discount zone & demand confluence)
🟢 Buy Setup (Demand Reaction Setup)
• Entry: 3974 – 3976
• Stop-Loss: 3967
• Take-Profit Targets: → 4005 → 4040 → 4080
(Only valid if price performs a liquidity sweep into 3976 and prints a clean M15 ChoCH.)
⚠️ Risk Management Notes
• Avoid entering early inside the premium zone — wait for bearish confirmation (M5–M15 BOS).
• The demand at 3974–3976 is strong but only valid once liquidity beneath the range has been fully taken.
• Do not chase buys near current levels; price is overextended and has no discount alignment.
• Partial profits should be secured at each liquidity point, with stops trailed using structural highs/lows.
• Intraday bias remains bullish-to-neutral, but current price is at an extreme, making shorts more favorable short-term.
✅ Summary
Gold is reaching into a major premium zone near 4090, where a short-term reversal becomes highly probable.
The 4090–4088 supply provides a clean, high-quality SMC continuation-short setup, while the 3974–3976 demand zone remains the strongest location for reactive long positions.
Stay patient — today’s movement will likely determine whether the recent pump is temporary or the beginning of a broader structural shift.
FOLLOW RYAN_TITANTRADER for daily SMC setups ⚡

LiamTrading – XAUUSD D1 | Scenario for Week 2 of NovemberLiamTrading – XAUUSD D1 | Scenario for Week 2 of November
Accumulation range 4047–3928, prioritise buying on breakout – watch for short at 4200 (FVG + Fib 0.382)
Overview: After the correction from the historical peak, gold is forming a bottom – accumulating in the price box 4047–3928. The D1 structure still leans towards a medium-term uptrend if the price holds above 3928; the ~4200 area coincides with a broad FVG + Fib 0.382, a “liquidity pool” prone to strong reactions.
Macro Summary
Hedging flows against public debt/deficit risks and net buying demand from some central banks/Asian bloc support the long-term trend.
Expectations of a cooling interest rate path in 2026 help ease pressure on gold, but pullbacks may still occur before major technical milestones.
Technical Analysis (D1 Frame – Trendline | S/R | Volume zone | Fibonacci)
Accumulation Range: 4047 (top of the box) ↔️ 3928 (bottom of the box). D1 closing above 4047 confirms an upper range expansion; breaking 3928 triggers a deeper decline to lower Fib levels.
Fibonacci of the most recent up wave:
The price is oscillating around 0.618 → tendency to form a base.
Deeper area if the base breaks: 0.5 ~ 3850 and 0.382 ~ 3710.
Key resistance: 4090–4120 (mid-box area), ~4200 (FVG + Fib 0.382) – expected large liquidity/short-term reversal zone.
Important support: 3990–4010 (psychological/trading cushion), 3928 (lower range – breakout mark).
Trendline: The medium-term uptrend line remains intact if corrections do not close below 3928.
Trading Scenario for the New Week
Scenario 1 – Buy with the trend on upper range breakout
Condition: D1 closes above 4047, retest holds firm at 4038–4047.
Entry: 4048–4055
SL: 4018
TP: 4090 → 4120 → 4185–4205 (FVG + Fib 0.382)
Management: Take partial profit at 4090/4120, move SL to breakeven at +1R.
Scenario 1b – Buy at the box bottom (fade range)
Entry: 3935–3945 (when there is a rejection candle/clear buying tail at 3928–3945)
SL: 3895
TP: 3995–4010 → 4040–4047
Note: If D1 closes below 3928, cancel the plan and switch bias to a bearish scenario.
Scenario 2 – Short reaction at the 4200 liquidity zone
Entry: 4185–4205 (FVG + Fib 0.382) when clear rejection appears on D1/H4
SL: 4225
TP: 4120 → 4047 → 4010 (extended target: 3850 if there is a breakdown signal)
Note: Counter-trend order; reduce volume, exit quickly if D1 closes above 4205.
Risk & Invalidation
The medium-term bullish bias remains valid as long as D1 does not close below 3928.
D1 closing below 3928 opens the path to 3850 (Fib 0.5), even 3710 (Fib 0.382).
Strong news (CPI, employment, central bank speeches) can disrupt signals; wait for candle closure according to the chosen frame.
Summary
Gold is “spring-loaded” within 4047–3928. Priority plan: Buy on breakout–hold 4047 to aim for 4090–4120 and test ~4200; simultaneously watch for short reaction at 4200. If 3928 breaks, switch scenario to decline towards 3850 → 3710.

XAUUSD SUPPORT, RESISTANCE & TRENDLINE ANALYSIS I am back!!
Go "LONG" if it breaks the trendline with 4023.97 as the first target and if it breaks that as well then aim for 4035 adn further breaking that might lead to 4045.
Go " SHORT" if it breaks 4005.20 with 3986.56 as the first target and breaking that trendline might lead to 3967.92 and if it breaks and sustains that as well then we might expect a move till 3949.10
Note: As long as it stays above 3977 you can expect the momentum to be Bullish. If only it breaks the 3977 mark then it might lead till the apbe mentioned Bearish targets.
Also kindly follow candle patterns as well and then go for confirmation.
Happy Trading.

Gold (XAU/USD) Testing Key Resistance – Potential Pullback BeforAnalysis:
Gold (XAU/USD) is currently trading around 4145, approaching a significant resistance zone between 4100 and 4120, marked as the first target region. This level previously acted as strong resistance, and price may experience a temporary pullback before resuming upward momentum.
The strong psychological support zone near 3890–3920 served as a solid foundation for the recent bullish reversal, confirmed by double-bottom formations and consistent higher highs.
If gold maintains momentum above 4120, the next upside target lies around 4210, aligning with previous structural highs and a major supply zone. However, rejection from the current resistance could trigger a short-term retracement toward 4100 before another push upward.
Summary:
Immediate Resistance: 4100–4120
Next Target: 4210
Key Support: 3890–3920
Bias: Bullish above 4100, potential retracement before continuation

Gold H1 – End of Wave 5: Is a Corrective ABC Coming?⚡ XAUUSD – Elliott Wave Intraday Outlook | 11/11
📈 Elliott Wave Context
Gold has completed a clean 5-wave impulsive structure on the H1 timeframe, with Wave 5 pushing into the premium zone above 4130.
Price now shows early exhaustion at the highs, suggesting the market is preparing to transition into a corrective ABC phase.
A confirmed reversal signal will be:
✅ H1 close below the Wave 2–4 trendline → confirming the start of Wave A.
🔎 Technical Breakdown (Wave Structure)
• Wave 1: Initial rally from 3964
• Wave 2: Shallow pullback near 3985
• Wave 3: Strong impulsive breakout toward 4070+
• Wave 4: Mid-cycle correction holding structure
• Wave 5: Final push topping around 4130–4140 (current swing high)
The 5-wave impulse is now completed → market likely moves into A–B–C correction.
📉 Expected Elliott Wave Path (ABC)
Wave A
• First levels: 4105 (Fibo 0.236)
• Main target zone: 4078 (Fibo 0.382)
Wave B
• Corrective rebound toward
o 4105, or
o 4115–4120
Wave C
• Strongest leg of correction
• Ideal target zones:
o 4035 (Fibo 0.618 retracement of the full 1–5 impulse)
o 4004 (Fibo 0.786 retracement)
• Wave C often ≈ Wave A → aligns with 4035–4004
📌 Intraday Trade Plan (Elliott-Based)
✅ Scenario 1 – SELL the upcoming correction (Preferred)
Entry:
• After H1 candle closes below the 2–4 trendline,
or wait for a Wave B retest into 4105–4120.
Stop Loss:
• Above the Swing High → 4145
Take Profit:
• TP1: 4078
• TP2: 4035
• TP3: 4004
✅ Scenario 2 – BUY only if wave invalidation occurs
If gold breaks and holds above 4145, Wave 5 may be extending.
Entry: above 4145
SL: 4120
TP: 4170–4200
✅ Summary
Gold has finished a textbook 5-wave impulse and is now likely entering a corrective ABC structure.
The highest-probability opportunity today is to sell the Wave B retracement and target deeper corrective zones at 4035–4004.

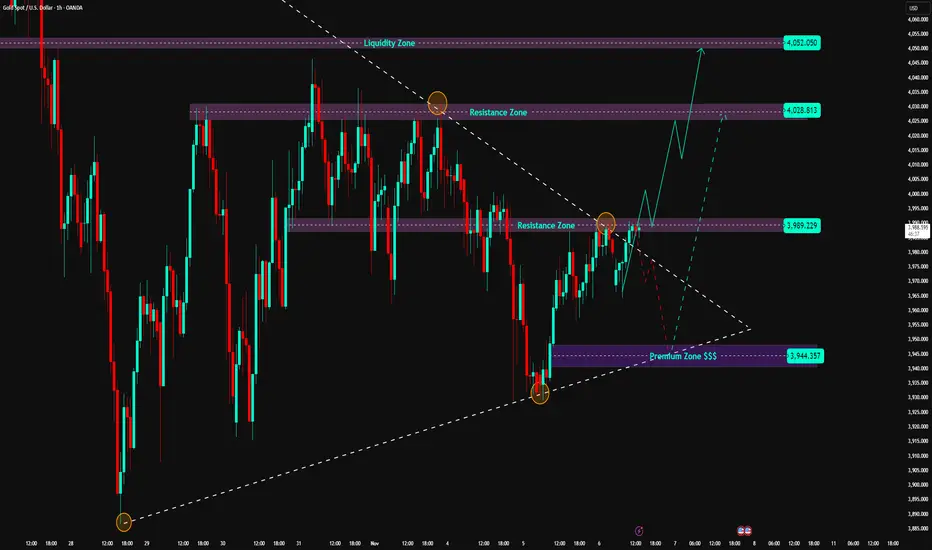
Gold Testing Resistance, Compression Structure Set to Break📊 Market Structure
On the H1 chart, gold is forming a compression structure between the Support 3,944 USD and Resistance 3,989 USD zones.
The recent lows create a series of Higher Lows along the rising trendline – indicating buyers are quietly absorbing supply around the lower region.
However, the 3,989 USD zone remains the central resistance axis , converging with the descending trendline formed from the previous peak (4,028 USD). Each time the price hits this zone, a short-term profit-taking reaction occurs, showing strong defense from sellers.
Below the support zone, the Premium Zone 3,944 USD continues to be the main pivot point – where the price has previously surged strongly in the last two sessions.
If this zone is breached, the short-term bullish structure will be invalidated, opening up the possibility of returning to the Liquidity Zone around 3,921 – 3,892 USD .
Conversely, if the price closes above 3,989 USD , the market will confirm a Bullish Break of Structure (BoS), triggering an extended target towards 4,028 – 4,052 USD .
💎 Key Technical Zones
• Resistance Zone 1: 3,989 USD → main resistance, strong reaction zone.
• Resistance Zone 2: 4,028 – 4,052 USD → upper liquidity target zone.
• Support Zone: 3,944 USD → dynamic support, converging with the rising trendline.
• Liquidity Zone: 3,921 – 3,892 USD → the last zone protecting the bullish structure.
🎯 Trading Scenarios
1️⃣ BUY Scenario – Await Confirmed Breakout:
If the price closes above 3,989 USD and successfully retests:
• Entry: 3,985 – 3,995
• SL: 3,965
• TP1: 4,015
• TP2: 4,028
• TP3: 4,052
2️⃣ SELL Scenario – React at Resistance:
If a reversal candlestick pattern appears at 3,989 USD:
• Entry: 3,985 – 3,990
• SL: 4,000
• TP1: 3,965
• TP2: 3,950
• TP3: 3,944
🧠 Vincent’s View
Gold is in a “compression before breakout” phase, with liquidity concentrated around the 3,989 USD zone.
If this zone is broken, the price could quickly surge to the supply area above 4,028 – 4,052 USD.
If it fails, a price rejection here could pull gold back to the rising trendline at 3,950 USD.
“Compression breeds expansion — let price show which side holds conviction.” ⚜️
⏰ Timeframe: 1H
📅 Updated: 06/11/2025
✍️ Analysis by: Captain Vincent
Gold Price Action: Healthy Pullback Within Broader UptrendGold is currently trading within a well-defined range on the daily timeframe, consolidating between 3,910 and 4,025 on a closing basis. Over the past several sessions, we've witnessed multiple attempts by buyers to reclaim the psychological 4,000 level, but sellers have consistently stepped in during intraday rallies, keeping the price action contained within this range.
From my perspective, this consolidation is likely to persist for a while longer. Looking ahead, I anticipate the range could potentially extend between 3,850 and 4,200 over the coming weeks as market participants digest recent moves. It's worth noting that we should prepare for a worst-case scenario where price breaks below 3,850 on a closing basis, especially given that volatility tends to pick up during year end trading.
That said, My view in this current phase as a healthy correction within the broader bull market. My bias remains tilted toward the buy side, and I'm expecting a potential resumption of the uptrend somewhere in the next 1-2 months, possibly around mid-January. The key here is patience with money management allowing this consolidation to play out while staying ready to capitalize on the next directional move. As always, proper risk management is crucial, particularly with year-end volatility on the horizon.
