Gold 4H – Key Liquidity Zones Ahead of US PMI & Fed Commentary🥇 XAUUSD – Weekly Smart Money Outlook | by Ryan_TitanTrader
📈 Market Context
Gold continues to consolidate within a tight 4H range as traders prepare for a week influenced by U.S. PMI releases, Fed speeches, and shifting rate-cut expectations.
Mixed economic signals — including softer labour data but resilient manufacturing prints — have kept gold trapped between supply overhead and stacked demand levels below.
Institutional flows remain cautious, with markets waiting for clarity on the Fed’s stance. This uncertainty often fuels liquidity-driven sweeps, making this week especially favourable for SMC-style setups.
Short-term volatility is expected as price interacts with major liquidity pools on both ends of the range.
🔎 Technical Analysis (4H / SMC View)
• Price is moving within a well-defined range structure, with repeated liquidity grabs on both sides indicating accumulation by larger players.
• The latest 4H ChoCH signals continued hesitation from buyers near the mid-range, hinting that the market may engineer another sweep before committing to a directional leg.
• A significant Premium Supply Zone at 4154–4152 sits just above recent equal highs — an attractive area for liquidity hunts followed by potential short-term distribution.
• Conversely, the Discount Demand Zone at 3907–3909 aligns with previous structural reaction levels and sits below a liquidity shelf, making it an ideal zone for re-accumulation.
• Expect engineered stop-hunts around mid-range liquidity (4000–4016) before a stronger move develops.
🟢 Buy Zone: 3907–3909
SL: 3900
TP targets: 3978 → 4003 → 4016 → 4125
Rationale:
• Discount zone within the current 4H range
• Liquidity resting below the structure lows
• Potential accumulation before the next bullish impulse
🔴 Sell Zone: 4154–4152
SL: 4161
TP targets: 4080 → 4016 → 3978 → 3920
Rationale:
• Premium supply positioned above equal-high liquidity
• Likely area for a sweep before corrective downside
• Confluence with previous 4H structure rejection
⚠️ Risk Management Notes
• Wait for M15 ChoCH or BOS confirmation inside each zone before entering.
• Expect liquidity manipulation around 4000–4016, especially during US session opens.
• Avoid entries 10–15 minutes before major Fed or PMI releases to limit spread expansion.
• Scale partial profits at each structural target to lock in gains while letting runners play out.
✅ Summary
Gold remains in a controlled 4H range with clear institutional footprints above and below the current price.
Smart Money is likely to engineer a move into either the 4150 supply or the 3900 demand before choosing its next major direction.
Both setups offer high-probability opportunities when combined with intraday confirmations.
Stay patient, wait for liquidity sweeps, and respect structure.
Premium sells remain valid at 4154–4152, while discounted buys are favoured at 3907–3909.
🔔 FOLLOW RYAN_TITANTRADER for daily SMC setups ⚡
Trade ideas

Gold Faces Strong Rejection at Supply Zone – Bearish ContinuatioThe chart shows Gold testing a strong supply zone around 4000–4025. Price attempted to push higher but failed, forming a clear rejection wick followed by consolidation.
Key observations:
Supply Zone (Resistance): 4000–4025 area has repeatedly rejected price, showing strong seller presence.
Structure: Market is forming lower highs, indicating weakening bullish momentum.
Break & Retest: Price pulled back to the broken structure level and is now reacting bearishly.
Projected Move: The arrow suggests a potential drop toward the 3900–3910 demand zone.
Momentum: Candlestick rhythm supports a bearish continuation scenario as long as price stays below 4000.
✅ Bearish Bias
If the rejection holds:
Downside target: 3900–3910
Invalidate bearish idea: A 4H close above 4025

XAU/USD: Powell vs. The Discount ZoneHello, Traders! Let's dive deep into Gold (XAU/USD). The price is currently caught in a crucial tug-of-war: a hawkish US Federal Reserve (Fed) is strengthening the Dollar, while the political risk of a potential US government shutdown offers strong support to Gold. This is where the opportunity lies!
📰 Key Fundamental Drivers (Watch Closely):
The Fed & Powell's Stance: The likelihood of a US rate cut in December has decreased significantly. This signals a Hawkish view, which generally makes the USD stronger and places DOWNWARD pressure on Gold prices.
US Government Shutdown Risk: Concerns are rising that a prolonged government closure could harm the US economy. This economic uncertainty acts as a strong tailwind for Gold, as it is a premier safe-haven asset.
📉 Technical Analysis (The Chart View):
We observe XAU/USD moving within a Rising Wedge pattern (often a signal for a bearish reversal) and is now heading towards a critical price level we call the Strategic Support Zone.
🔥 Strategic Support Zone (The Discount Zone): $3,941 - $3,953. This is the key zone where patient buyers typically look to enter Buy (Long) trades, ensuring a favourable risk/reward profile.
Major Resistance Zone: $4,004 - $4,025.
🎯 Our Two-Sided Trading Strategy:
1. The Bullish Scenario (Long):
Action: Wait for the price to test and show a strong reversal signal (like a rejection candlestick) from the $3,941 - $3,953 support area.
Target: $4,004 - $4,025.
2. The Bearish Scenario (Short):
Action: SELL (SHORT) if the price is strongly rejected at the $4,004 - $4,025 resistance zone, OR if it decisively breaks and closes below $3,941.
Target: Below $3,900.
🚨 Important Note: We must closely monitor any further statements from FOMC members this week. They will dictate the short-term direction. Trade wisely and always use a Stop Loss!
#xauusd #forexindia #powell #fomc #technicalanalysis #gold #usd #indiaforex #tradingview #marketanalysis

POWER OF 30_M VS LONDONAfter years of trading XAUUSD, I’ve discovered that each market session forms its own unique characteristics and patterns shaped by time, price movement, and volume behavior. This setup highlights how session-based dynamics influence downside movements in gold.
GOLD TRADING INSIGHTS TODAY WITH LUCYGOLD TRADING INSIGHTS TODAY WITH LUCY 💛
Hello everyone 🌸
The gold market (XAUUSD) today is showing many interesting signals as the price continues to test the crucial trendline area. Traders' sentiment is quite cautious at the moment – both buyers and sellers are “squaring off” around the liquidity balance zone.
🔍 Technical Analysis
On the chart, gold is moving within a narrowing triangle price channel – this indicates momentum is accumulating, and when the price breaks in either direction, the subsequent volatility will be very strong ⚡
Currently, the price is reacting around the main trendline, but there is no clear breakout signal yet.
In my personal view, the probability of a decline remains higher, however, further confirmation is needed before entering a trade.
The important point to note is the support area at 3965, which is the key boundary to confirm a clear downtrend.
If the price breaks through this area, the possibility of extending towards the Fibonacci 2.618 area around 3890 is entirely possible.
⚙️ Price Levels to Watch
Currently, the 3990 – 4012 area is short-term resistance, where sellers may reappear.
Meanwhile, the 3965 – 3945 – 3920 areas are the main supports that need close observation.
If the price continues to hold above 3945, the likelihood of a short-term rebound is quite high.
🎯 Today's Trading Scenario
💼 Buy: 3945
⛔ SL: 3938
🎯 TP: 3958 – 3977 – 3992 – 4012
💼 Sell: When the price clearly breaks below support 3965
⛔ SL: Above the breakout area
🎯 Expected TP: extending towards the Fibonacci 2.618 area around 3890
I still prefer to observe the price reaction at the trendline area, and only act when there is clear confirmation — because in a triangle pattern, the patient one will always be the winner 🌙
⚠️ Note & Conclusion
The above analysis reflects only Lucy's personal perspective, based on Trendline – Fibonacci – ICT factors 📊
This is not investment advice.
Please share your views on gold in the comments section 💬
And don't forget to follow Lucy for daily updates on insightful analyses —
where technical analysis merges with market emotions 💫🌸

GOLD CONFIRMS SHORT-TERM DECLINE AFTER BREAKING TRENDLINEXAUUSD – GOLD CONFIRMS SHORT-TERM DECLINE AFTER BREAKING TRENDLINE
🪞 1. Overview
🌤️ In the Asian session this morning, gold broke the upward trendline even though the selling pressure wasn't particularly strong.
However, this is the first signal indicating that the short-term trend is leaning towards the sellers.
💬 Currently, the 3996 level is a significant resistance, and the price might retest this area before continuing to decline.
If the price surpasses the FVG at 4007, the trend might temporarily rebound in the short term.
💹 2. Technical Analysis (ICT Perspective)
🔸 Market structure: After breaking the trend, the structure temporarily shifts to short-term bearish.
🔸 Liquidity & FVG: Liquidity is drawn to the 3960–3940 area, while FVG 4007 is the first barrier.
🔸 Order Flow: Smart Money may lightly sweep up to the resistance area before pushing the price further down.
🎯 3. Reference Trading Scenarios
💔 MAIN SELL
Entry: 3996 | SL: 4004
TP: 3985 – 3972 – 3948
💢 SELL scalping
Entry: 4007 | SL: 4014
TP: 3998 – 3978
💖 REACTIVE BUY
Entry: 3965 | SL: 3957
TP: 3976 – 3988 – 3999
🌸 DEEP BUY
Entry: 3941 | SL: 3931
TP: 3955 – 3968 – 3988 – 4012 – 4066
🔍 4. Price Levels to Note
✨ 4007 → FVG resistance, short-term trend confirmation area
✨ 3996 → Retest area of the broken trendline
✨ 3965 – 3941 → Strong support area, likely to see reversal reactions
💬 5. Notes & Call for Interaction
⚠️ This is not an investment recommendation, but merely a personal technical perspective following the ICT method.
Observe the price reaction around the trendline carefully before making a decision 💭
If you find this post helpful, please 💛 like – 💬 leave a comment – 🔔 follow LanaM2
to stay updated with daily gold insights and learn more about the Smart Money Concept 🌷✨
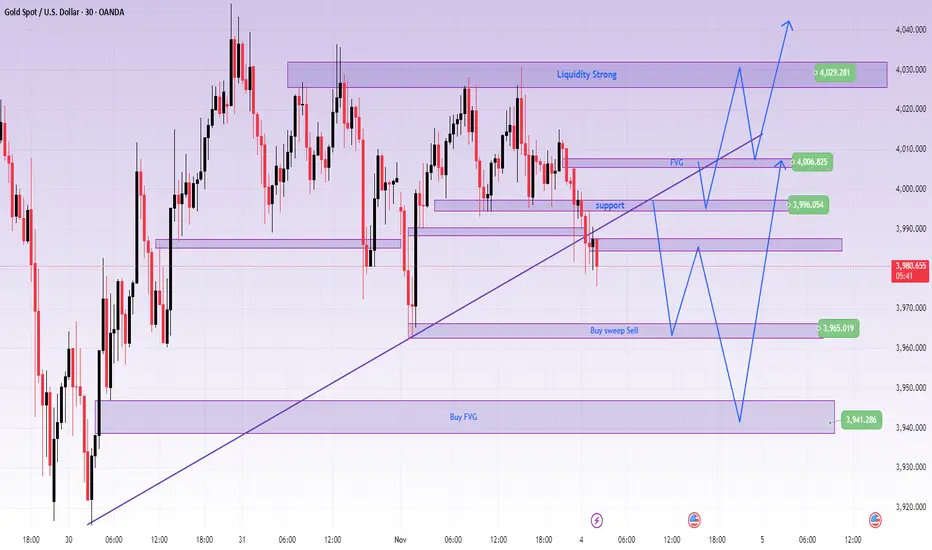
Gold Pauses Below $4,000 as Markets Digest Hawkish Fed Tone🔍 Market Context
Gold struggles to find direction in early Asia, hovering just below the $4,000 psychological level after the Fed’s hawkish remarks dampened bullish momentum.
Chair Jerome Powell reaffirmed that another rate cut this year is “not a given”, keeping yields supported and safe-haven demand balanced.
Meanwhile, ISM Manufacturing PMI fell to 48.7, signalling cooling momentum but not enough to alter the Fed’s cautious stance.
With odds of a December rate cut near 70%, gold remains trapped between policy uncertainty and soft macro sentiment.
📊 Technical Outlook (H1–H4)
Price is consolidating within a tight structure between 3,963$ and 4,024$, showing compression before a potential expansion move.
The 3,984$–3,963$ zone acts as short-term liquidity support, aligning with the rising intraday trendline.
Key Levels
• 💎 Liquidity Support: 3,963$ – 3,984$
• 🎯 Immediate Resistance: 4,024$
• ⚙️ Bullish Target: 4,046$ (liquidity sweep + expansion zone)
• ⚠️ Invalidation: Below 3,923$, bias shifts to neutral
A clean breakout above 4,024$ could trigger a move toward 4,046$, while failure to hold above 3,963$ may invite another liquidity grab before buyers re-enter.
🎯 MMFLOW View
Smart money remains patient.
As long as 3,963$ holds, dips are seen as accumulation rather than weakness.
But conviction only returns when liquidity confirms above 4,024$ — that’s where momentum aligns with intent.
⚜️ MMFLOW Insight:
“Liquidity doesn’t chase price — it creates the path for it.”

Gold Squeeze: Range Breakout Can Trigger $4,100+ MoveLooking at the current gold price action on the H1 chart, we're seeing a technical setup that's been developing over the past several sessions. The market has clearly established a well-defined range between approximately $3,900 and $4,040, with price respecting both the upper and lower boundaries quite consistently.
price is holding above this ascending support while simultaneously testing the middle-to-upper zone of the range suggests building bullish momentum.
We've seen multiple attempts to push lower get absorbed by buyers, creating a series of higher lows that demonstrate underlying strength. The grey horizontal zone around $4,020-$4,040 represents the key resistance level where sellers have previously shown up, but notice how price action is becoming increasingly compressed near this level a classic sign that a breakout may be imminent.
From a probability standpoint, the combination of higher lows, sustained buying interest, and the current positioning near range highs favors an upside breakout. If gold manages to close convincingly above $4,040, we could see an accelerated move toward the $4,100+ zone fairly quickly, as there's limited technical resistance overhead once this range ceiling is breached.
However, it's worth noting that range-bound markets can be deceptive, and false breakouts are always a possibility. The key will be watching for a decisive move with strong volume and follow-through. Until we get that confirmation, remaining patient with existing positions while maintaining appropriate risk management makes sense.
The market appears coiled and ready to make its next significant move all signs point to higher prices, but as always, let the price action confirm the breakout before adding to positions.

Gold Trading Strategy for 03rd November 2025🏆 GOLD INTRADAY TRADE PLAN 💰 (03 NOV 2025)
📊 Market Overview:
Gold is currently trading within a crucial intraday range. A strong breakout on either side of this zone may provide directional opportunities. Traders should observe the price action and candle closes before entering trades. Always confirm momentum with volume and candle strength.
📈 🟢 BUY SETUP:
📍 Entry Trigger:
→ Buy only if the 30-Min candle closes above $4023 — this confirms bullish strength and potential breakout continuation.
🎯 Upside Targets:
🎯 Target 1: $4035 – First resistance zone; partial booking recommended.
🎯 Target 2: $4050 – Momentum continuation level.
🎯 Target 3: $4065 – Extended intraday target.
🛡️ Stop Loss: Below $4010 (Keep risk-to-reward ratio around 1:2 minimum).
💡 Tip: Wait for a clear bullish candle with volume confirmation before entering. Avoid early entries on spikes.
📉 🔴 SELL SETUP:
📍 Entry Trigger:
→ Sell only if the 15-Min candle closes below $3967 — this indicates weakness and potential bearish breakdown.
🎯 Downside Targets:
🎯 Target 1: $3950 – Immediate support zone.
🎯 Target 2: $3938 – Continuation support.
🎯 Target 3: $3921 – Extended downside target.
🛡️ Stop Loss: Above $3980 (Maintain strict discipline).
💡 Tip: Ensure there’s a confirmed breakdown candle and not a false wick rejection. Avoid trading in a sideways range.
⚠️ DISCLAIMER:
📢 This content is for educational and informational purposes only and should not be considered financial advice. Trading involves substantial risk and is not suitable for all investors. Always use stop loss, manage your capital wisely, and consult with a certified financial advisor before making investment decisions.
✨ Summary:
✅ Wait for candle close confirmations before entry.
✅ Avoid over-leveraging and trade with discipline.
✅ Follow trend strength and volume confirmation.
✅ Keep emotions out — follow your trading plan strictly.
💵 Trade Smart | Manage Risk | Stay Consistent 💵

Gold expected to Crash to levels on 3200$ from 4000$evaluating Monthly gold chart, my calculation says atleast a 1000$ drop from current levels of 4000$. This is purely based on Technical indicator hence dont just take your buying or selling decision basis this post... do your research yourself ..

XAUUSD MULTI TIME FRAME ANALYSISHello traders , here is the full multi time frame analysis for this pair, let me know in the comment section below if you have any questions , the entry will be taken only if all rules of the strategies will be satisfied. wait for more price action to develop before taking any position. I suggest you keep this pair on your watchlist and see if the rules of your strategy are satisfied.
🧠💡 Share your unique analysis, thoughts, and ideas in the comments section below. I'm excited to hear your perspective on this pair .
💭🔍 Don't hesitate to comment if you have any questions or queries regarding this analysis.

XAUUSD Down TrendMultiple confirmation shows and confirms that XAUUSD Down Trend entry made on next candle opening good to go
Deslamer: not a financial advice do your own research and enter in a trade its for just educational purpose only to know more message

Part 2 Intraday Tradiing Master ClassHow Option Pricing Works
Option prices (premiums) are influenced by several factors. The most important are:
Underlying Price: The current price of the stock/index.
Strike Price: The difference between the current price and strike determines moneyness.
Time to Expiry: The more time left, the higher the premium (time value).
Volatility: Higher volatility increases the premium since there’s a greater chance of price movement.
Interest Rates & Dividends: These also affect option pricing slightly.
A famous model called the Black-Scholes Model is commonly used to calculate theoretical option prices based on these factors.

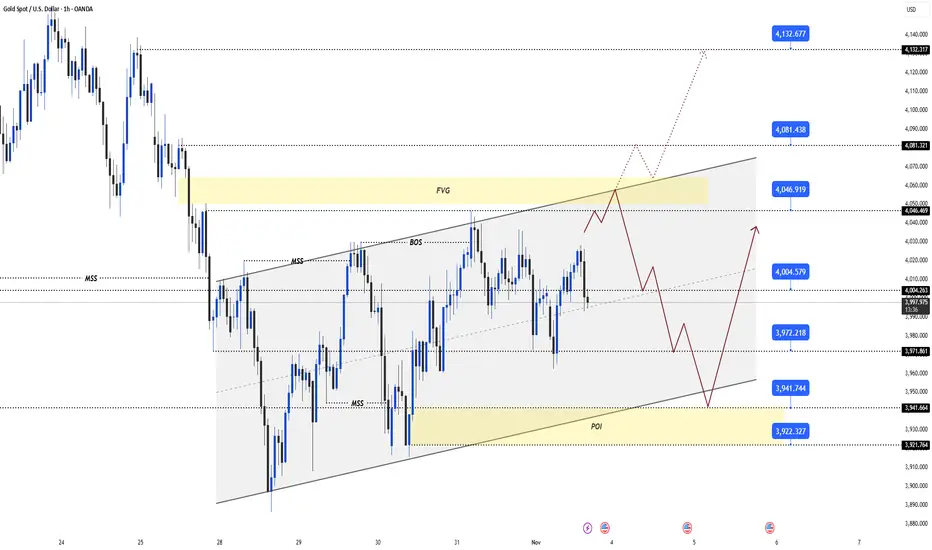
XAU/USD – Gold Maintains Short-Term Uptrend, Target $4,108🔍 Market Context
Gold continues to uphold a short-term uptrend structure after forming a clear Change of Character (ChoCH) around the 3,926 USD zone.
Buyers are in control as prices consistently create higher lows and react positively at the Order Block + Supporting Trendline zone.
As long as prices remain above the 3,940–3,926 USD area, the uptrend structure is preserved.
💎 Key Technical Zones
• Order Block Bullish: 3,926 USD → main support zone, confluence with rising trendline.
• Fair Value Gap (FVG): 3,942 – 3,972 USD → potential liquidity absorption zone.
• Resistance Zone: 4,032 USD → short-term resistance, needs to be broken to confirm continued uptrend.
• Liquidity Zone: 4,108 USD → expansion target if the above resistance is breached.
🎯 Trading Scenarios
1️⃣ BUY Setup – Prioritise catching the retracement from support zone
• Entry: 3,942 – 3,926 USD
• Stop Loss: 3,910 USD
• Take Profit:
– TP1: 3,972
– TP2: 4,032
– TP3: 4,064
– TP4: 4,108
✳️ “Buy the discount” – Prioritise orders in the confluence zone of OB + FVG to follow Smart Money flow.
2️⃣ SELL Scalp – Short-term at resistance zone
• Entry: 4,032 – 4,048 USD
• Stop Loss: 4,060 USD
• Take Profit:
– TP1: 4,010
– TP2: 3,972
– TP3: 3,942
✳️ “Sell the premium” – Activate only if clear price rejection signals appear at resistance.
💬 Summary
The current structure still leans towards bullish short-term with the 3,926 USD zone as the key invalidation zone .
As long as prices stay above the trendline, the immediate target is the 4,108 USD liquidity zone.
Optimal strategy: Buy on dip – Sell on reaction.
“Smart Money buys fear, sells greed — follow the footprints, not the noise.”
⏰ Timeframe: 1H
📅 Update: 31/10/2025
✍️ Analysis by: Captain Vincent

XAUUSDPrice Action Trading is a method of financial market analysis where traders make buying and selling decisions solely based on the asset's price movements over time, without relying on technical indicators.
It's essentially the art of reading a "naked" or clean chart to understand the psychology and behavior of market participants.

XAU/USD – Gold in Equilibrium Zone: Sell Opportunities Around...🔍 Market Context
Gold is currently consolidating within a triangle structure , showing short-term accumulation before a potential breakout.
Buyers are trying to maintain a minor bullish structure, but the series of lower highs indicates that sellers still hold the upper hand.
At the moment, price is reacting within the FVG 3,942–3,979 USD area, staying below the descending trendline.
If this zone fails to break, selling pressure may return.
💎 Key Technical Levels
• Bearish Order Block: 4,022 USD → main supply zone, aligning with the descending trendline.
• FVG Zone 1: 3,979 USD → short-term liquidity test area.
• FVG Zone 2: 3,942 USD → potential retracement zone before further downside.
• Bullish Order Block: 3,882 USD → key support aligning with long-term bullish trendline.
• Liquidity Zone: 3,789 USD → extended target if main support breaks.
🎯 Trading Scenarios
1️⃣ Sell Setup – Reaction from Resistance Zone
• Entry: 4,012 – 4,022 USD
• Stop Loss: 4,035 USD
• Take Profit:
– TP1: 3,979
– TP2: 3,942
– TP3: 3,900
– TP4: 3,882
– TP5: 3,789
✳️ “Sell the premium” – utilise supply and FVG reactions following Smart Money flow.
2️⃣ Buy Setup – Reaction from Demand Zone
• Entry: 3,882 USD
• Stop Loss: 3,865 USD
• Take Profit:
– TP1: 3,910
– TP2: 3,942
– TP3: 3,979
– TP4: 4,012
– TP5: 4,022
✳️ “Buy the discount” – valid when strong absorption or reversal signal forms near the lower OB.
💬 Summary
Current structure remains short-term bearish , yet the market is balanced.
The most efficient approach is to sell near premium zones (4,022) and buy back near discount (3,882) .
Expected range in the next 24–48 hours: 3,880–4,020 USD .
💡 Tagline:
“Trade where institutions act — not where retail reacts.”
⏰ Timeframe: 1H
📅 Updated: 30/10/2025
✍️ Analysis by: Captain Vincent

XAU/USD (Gold Spot vs. U.S. Dollar) 1-hour chart XAU/USD (Gold Spot vs. U.S. Dollar) 1-hour chart on TradingView.
Here’s what I can observe:
There is a symmetrical triangle pattern (a type of consolidation pattern) drawn on the chart.
The price appears to be breaking out upwards from the triangle.
There’s an arrow drawn upward with a “target point” marked above current price levels.
To calculate the target from this breakout:
📈 Symmetrical Triangle Target Formula:
Target = Breakout Point ± (Height of the Triangle)
1. Measure the height of the triangle:
From the highest point of the pattern to the lowest point within the triangle.
Approximate values (from the chart):
High ≈ 4,080
Low ≈ 3,940
→ Height ≈ 140 points
2. Add the height to the breakout level:
Breakout ≈ 4,000
→ Target ≈ 4,000 + 140 = 4,140
🎯 Estimated Target: 4,140 USD
That matches closely with the dashed horizontal line labeled “target point” on my chart — right around 4,120–4,140.
So, my bullish target zone after breakout is approximately 4,120–4,140 USD per ounce.

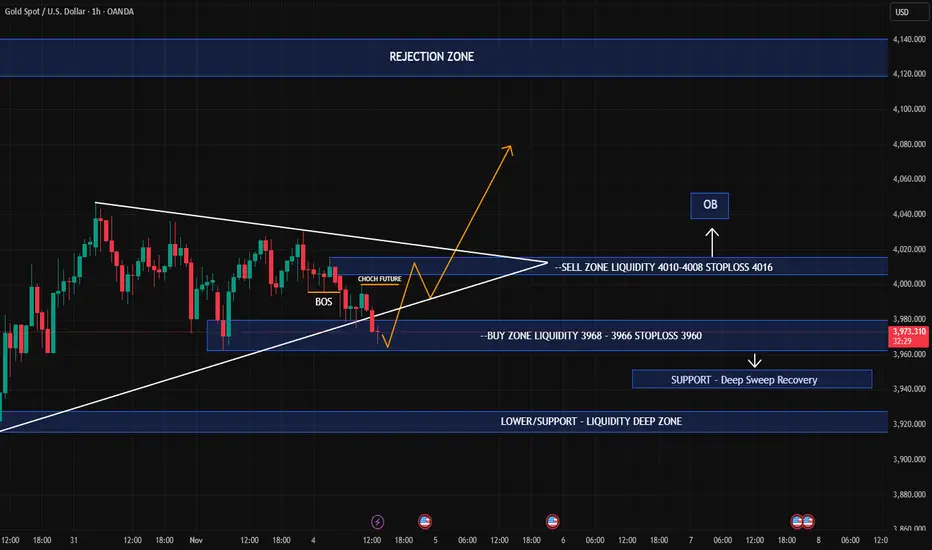
GOLD (XAU/USD): ISM DHAMAKA Awaited! Ready for the Big Move, BosI. MACRO KA SCENE (Current Situation):
Mind you, Gold is in a TIGHT SPOT, caught between two heavy-duty forces:
⬆️ BULL CASE (Buy Power): Safe-Haven demand is on because of US Political TENSION (shutdown issues) and global uncertainty (like that Nvidia chip drama). Good for paisa up.
⬇️ BEAR CASE (Sell Power): USD is showing STRENGTH! Hawkish Fed guys are pushing rate cut hopes away, which is putting pressure on our Gold.
🔥 MAIN GAME-CHANGER: The US ISM Manufacturing PMI tonight. This data is the main trigger for the next BIG move. Wait and watch, folks!
II. APNA TRADING PLAN (Actionable Zones):
We are sticking to two high-probability zones. Remember: Only trade after proper Price Action Confirmation! No JUMPING.
🔴 SELL SCENARIO
SELL ZONE (Supply/FVG): $4,050 - $4,055
Reason: We're hunting a SOLID rejection where the Smart Money (Bade Khiladi) is waiting to sell off.
SL (Stop Loss): $4,065
TP Targets (Book Profit): $4,045 - $4,035 - $4,025 - $4,015
🟢 BUY SCENARIO
BUY ZONE (POI/Demand): $3,952 - $3,948
Reason: Looking for the market to find STRONG support here and give a sharp bounce.
SL (Stop Loss): $3,940
TP Targets (Book Profit): $3,958 - $3,968 - $3,978 - $3,988
🚨 FINAL WORD (Very Important, Yaar!):
Risk Management is the ultimate key. Boss, wait for a CLEAR Price Action Confirmation in these zones. NO gambling on the news release.
#XAUUSD #Gold #ISM #PriceAction #TradingIndia #ForexIndia #IndianTrader #SmartMoneyConcept #USD #SafeHaven #Paisa
Gold Trading Strategy | October 29-30✅ From the 4-hour timeframe, gold remains within a medium-term bearish trend channel. The price has repeatedly been rejected around the MA10/MA20 levels, indicating that short-term rebounds are limited and sellers still dominate the market.
The Bollinger Bands have opened downward, and the middle band (around 4003) is pressing lower, showing that recent rebounds are merely weak corrective moves rather than a trend reversal. Candlesticks have failed multiple times to stand above the middle band, facing pressure on every rebound — a typical weak, oscillating, downward structure. The support near 3886 is an important short-term defense level; if broken, price may further test the 3860–3840 region.
✅ On the 1-hour timeframe, gold briefly rebounded to the 4030 area before retreating sharply and breaking below the cluster of moving averages, showing heavy selling pressure above. Candles are currently running below the MA5 and MA10, with both sloping downward, suggesting ongoing bearish momentum. The Bollinger middle band is also turning lower, strengthening the current downward pressure. Rebounds are repeatedly capped around the middle band, and there is a high chance of testing the lower band near 3888.
🔴 Resistance Levels: 3853 / 3980–3990 / 4000
🟢 Support Levels: 3920–3915 / 3886 / 3855
✅ Trading Strategy Reference:
🔰 If gold rebounds to 3980–3990 and shows rejection, consider scaling into short positions, targeting 3920–3886
🔰 If gold drops to 3885–3890 and stabilizes, consider light-lot long positions, targeting 3950-3960.
🔥Trading Reminder: Trading strategies are time-sensitive, and market conditions can change rapidly. Please adjust your trading plan based on real-time market conditions.

Gold updated levels sell on rise until 4050 not break How My Harmonic pattern projection Indicator work is explained below :
Recent High or Low :
D-0% is our recent low or high
Profit booking zone ( Early / Risky entry) : D 13.2% -D 16.1 % is
range if break them profit booking start on uptrend or downtrend but only profit booking, trend not changed
SL reversal zone (Safe entry ) : SL 23.1% and SL 25.5% is reversal zone if break then trend reverse and we can take reverse trade
Target : T1, T2, T3, T4 and .
Are our Target zone
Any Upside or downside level will activate only if break 1st level then 2nd will be active if break 2nd then 3rd will be active.
Total we have 7 important level which are support and resistance area
Until , 16% not break uptrend will continue if break then profit booking will start.
If break 25% then fresh downtrend will start then T1, T2,T3 will activate
1,3,5,10,15,20 minutes are short term levels.
30 minutes 60 minutes , 2 hours,3 hours, ... 1 day and 1 week chart positional and long term levels

gold bullish setup and ath recoveryhaving found support and also bouncing off of golden zone and 200 sma on 4 hour time frame, gold is set to test for ath again.

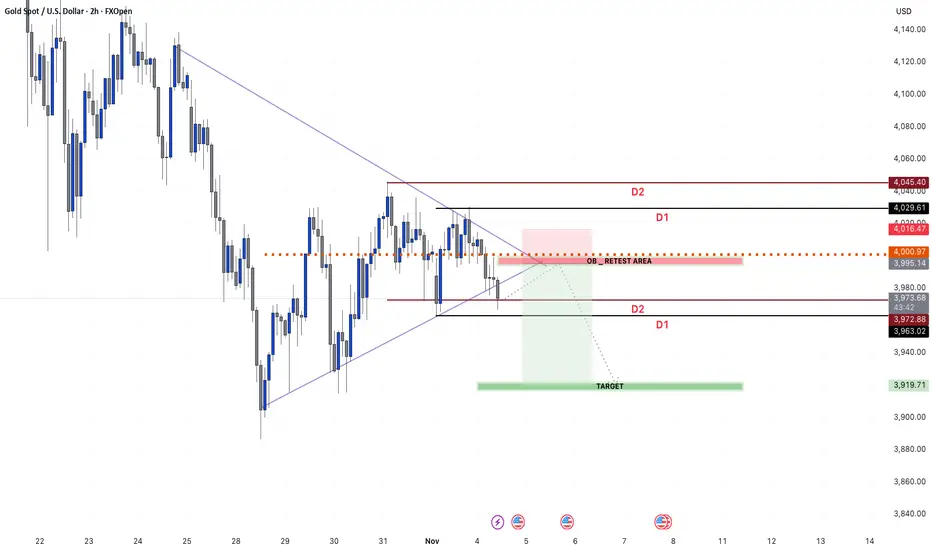
XAUUSD – Intraday H1 Plan: Liquidity Sweep or Reversal Base?Date: November 4, 2025
Timeframe: H1
🌐 MARKET CONTEXT
Gold is consolidating between $3,976 and $4,006 after a volatile session yesterday.
Market sentiment remains mixed, as traders weigh the rebound in U.S. Treasury yields against ongoing geopolitical and inflation concerns.
Recent move: Gold rebounded from the $3,975 low after a minor liquidity sweep below last week’s range.
Sentiment: Neutral-to-bullish in the short term — safe-haven demand still provides a soft floor.
Sessions to watch:
London session: Expect retracement and liquidity grab below intraday lows.
New York session: Possible expansion to the upside if $4,000 zone holds as support.
Macro Bias: Mildly bullish if price maintains structure above $3,980–$3,985; potential liquidity sweep downside before reversal.
📉 TECHNICAL ANALYSIS (SMC + LIQUIDITY STRUCTURE)
Market Structure:
H1 is forming a short-term accumulation range with liquidity resting below $3,976 (SSL) and above $4,006 (BSL).
A break and close above $4,005.5 may trigger a short-term BOS → potential push toward $4,015–$4,020.
Key SMC Confluences:
$4,200–4,230 Extended Resistance – higher untested supply if momentum returns.
Demand Zone: $3,978–$3,980 → aligned with FVG + previous sweep low.
Supply Zone: $4,004–$4,006 → previous OB + high liquidity.
🔑 KEY PRICE ZONES
Price Zone Type Explanation
4,006–4,004 🔴 Supply Previous high + BSL liquidity
3,996–3,994 🟡 Resistance Equilibrium rejection zone
3,986–3,984 🟢 Demand OB + CHoCH base support
3,980–3,978 🟢 Strong Demand SSL sweep + FVG confluence
3,976–3,974 ⚠️ Liquidity Sweep Deep liquidity / stop-hunt zone
⚙️ TRADE SETUPS
✅ BUY SCENARIO 1– Deep Sweep Recovery
Entry: 3,968–3,966
Stoploss: 3,960
TP1: 3,988
TP2: 3,996
TP3: 4,004
Logic: SSL sweep below the range + FVG mitigation → bullish reaction expected during London open.
🚫 SELL SCENARIO – Supply Rejection
Entry: 4,010–4,008
Stoploss: 4,016
TP1: 3,994
TP2: 3,986
TP3: 3,980
Logic: Price sweeps the previous BSL liquidity above $4,006 → look for bearish CHoCH + confirmation candle M5 before entry.
⚠️ SCALPING SELL – Aggressive Short
Entry: 4,008–4,009
Stoploss: 4,012
TP: 3,998 – 3,990 – Open
Logic: High-risk scalp at liquidity spike above day’s high; confirm rejection with volume drop.
🧠 NOTES / SESSION PLAN
Prioritize long setups near $3,980–3,984 zone during London open.
Look for liquidity sweep before entering — avoid premature entries.
During NY session, re-evaluate if gold re-tests the $4,004–$4,006 supply zone.
Avoid overtrading; use smaller position sizing due to narrow range ($30).
Always wait for H1 close confirmation before committing.
🏁 CONCLUSION
Gold remains range-bound within $3,976–$4,006, but the structure hints at a potential bullish bias if liquidity below $3,978 is swept first.
The preferred buy zones are $3,984–$3,986 and $3,978–$3,980, while sell reactions may occur near $4,004–$4,006.
Expect whipsaw volatility between London and NY overlap; trade only with clear SMC confirmations and proper risk control.
Leading Diagonal possibleIts still possible to complete a leading diagonal and then a wave 2 down.
Or it will turn into a running flat inside an expanding flat.
