Part 1 Ride The Big Moves Option Expiry and Settlement
Every option has an expiry date. In India:
Index options (like Nifty and Bank Nifty) are cash-settled.
Stock options are physically settled, meaning actual delivery of shares can occur if positions are held until expiry.
As the expiry date approaches, time decay (Theta) reduces the option’s value if the underlying doesn’t move in the trader’s favor.
Trade ideas

LiamTrading - $XAUUSD$: Second Scenario – BUY UP Priority ...LiamTrading - OANDA:XAUUSD $: Second Scenario – BUY UP Priority After BREAKING RESISTANCE $4002$
With the Support of the US Treasury Secretary
Hello traders community, LiamTrading is back with detailed OANDA:XAUUSD $ analysis for the start of the week!
The Gold market is receiving strong support from policy: US Treasury Secretary Scott Bessent calls on the Fed to continue cutting interest rates as the PCE inflation is currently at $2.7\%$.
This call, aimed at reducing mortgage rates and supporting the housing market, strengthens the long-term outlook for Gold.
Technical Analysis: We prioritize continuing to buy up following the main trend. The best strategy is to enter orders at strong resistance/support zones to ensure the lowest risk.
📰 MACRO FUNDAMENTALS: CALL FOR RATE CUT
Impact: The Treasury Secretary's statement on cutting interest rates to support the "transitioning" economy increases expectations of policy easing, which is a strong support factor for Gold (although not yet an official decision).
Suitable Strategy: Market sentiment is being driven by expectations of easing policy, reinforcing the priority for a BUY (Long) position.
📊 TECHNICAL ANALYSIS: IMPORTANT PIVOT POINT
Resistance Zone $4002$: This area acts as an important pivot point.
Buy Entry will be triggered after the price breaks resistance $4002$ and retests.
Sell Entry: Look for short-term scalping at the resistance zone $4030$ to secure profits. Highlighted Zone: Prioritize entering orders at confirmed Trendline zones.
🎯 DETAILED TRADING PLAN (ACTION PLAN)
We will wait for Gold to break structure and create a BUY setup.
🟢 Main BUY Scenario (BUY Break & Retest)
Logic: Buy at $4002$ after breaking resistance and retesting, leveraging new upward momentum.
Entry (BUY): $4002$
SL: $3995$ (tight SL)
TP1/TP2: $4020$ | $4035$
TP3: $4070$
🔴 SELL Scalping Scenario
Logic: Short-term scalping at the strong resistance zone $4030$ (near Sell Liquidity zone).
Entry (SELL): $4030$
SL: $4038$
TP1/TP2: $4015$ | $4004$
TP3: $3990$
📌 SUMMARY & DISCIPLINE (Liam's Note)
Our BUY strategy is reinforced by policy outlook and technical break at $4002$. Strictly adhere to SL $3995$ to manage risk before the upward structure is confirmed.
Are you ready for Gold's movement at $4002$? Please LIKE and COMMENT!

Gold Range Compression — Breakout Imminent🟥 Resistance Zone (Key Supply Zone): 4028 – 4045
Price has tested this zone multiple times but failed to break through.
A clean break above this red zone will signal strong bullish continuation.
🟦 Support Zone (Key Demand Zone): 3995 – 4005
This is the immediate support keeping price from falling lower.
A break below this blue zone will confirm bearish momentum.
✅ Bullish Scenario
If price breaks and retests the red zone (4028–4045):
Expect upward continuation
Target 1: 4060
Target 2: 4095 – 4105
This matches the upward blue arrows on your chart.
✅ Bearish Scenario
If price breaks below 3995 and retests the blue zone as resistance:
Expect strong downward momentum
Target 1: 3960
Target 2: 3925
This matches the downward blue arrows shown.
✅ Current Bias
Market is neutral right now — sitting between support and resistance.
A breakout from either zone will decide the next direction.

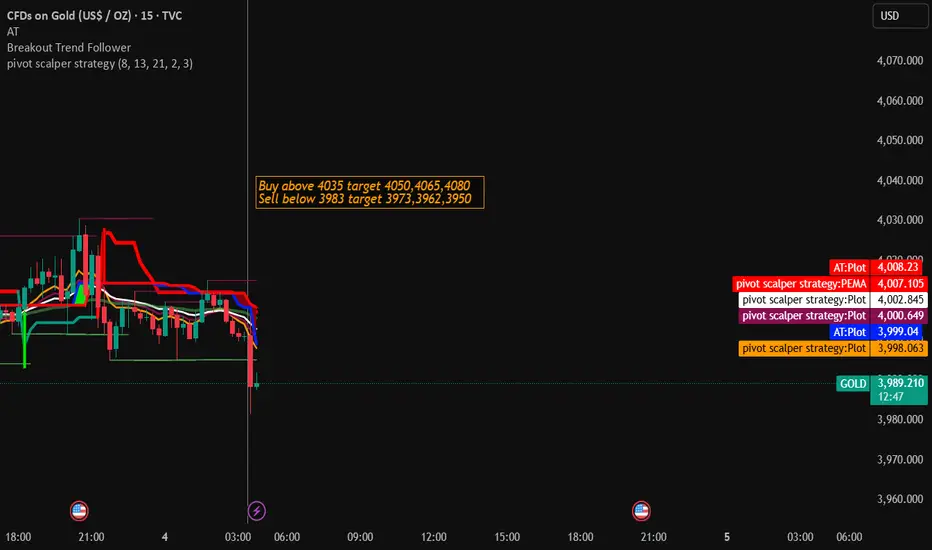
Gold Trading Strategy for 04th November 2025💰 GOLD TRADING PLAN (INTRADAY STRATEGY)
🟢 BUY SETUP (Bullish Scenario)
📈 Condition to Enter (Buy Entry):
➡️ Wait for a 30-minute candle to close ABOVE $4035.
➡️ Once a candle closes above this level, look to buy above the high of that same candle.
💵 Example:
Suppose a 30-min candle closes at $4036, and its high is $4038.
Then your Buy Entry would be above $4038.
🎯 Target Levels:
🎯 1st Target: $4050
🎯 2nd Target: $4065
🎯 3rd Target: $4080
🛑 Stop-Loss (SL):
Place SL below the low of that 30-minute candle (for example, if the candle’s low is $4025, set SL around $4024–$4025).
🔴 SELL SETUP (Bearish Scenario)
📉 Condition to Enter (Sell Entry):
➡️ Wait for a 1-hour candle to close BELOW $3983.
➡️ Once a candle closes below this level, look to sell below the low of that same candle.
💵 Example:
Suppose a 1-hour candle closes at $3982, and its low is $3980.
Then your Sell Entry would be below $3980.
🎯 Target Levels:
🎯 1st Target: $3973
🎯 2nd Target: $3962
🎯 3rd Target: $3950
🛑 Stop-Loss (SL):
Place SL above the high of that 1-hour candle (for example, if the candle’s high is $3992, SL can be set around $3993–$3995).
⚖️ RISK MANAGEMENT (Must-Read for Beginners)
✅ Risk only 1–2% of your total capital per trade.
✅ Always use a stop-loss — never trade without it.
✅ Avoid entering both buy and sell trades at the same time.
✅ Track your trades in a journal to improve over time.
⚠️ DISCLAIMER
⚠️ This analysis is for educational and informational purposes only.
📊 It is not financial advice or a guarantee of profit.
💡 Always do your own research or consult a certified financial advisor before trading.
🚫 Trading in gold and financial markets involves risk of capital loss.
Emotional Discipline and Risk Control in Trading🧠 1. Why Emotional Discipline Matters
Emotional discipline means sticking to your plan regardless of fear or greed.
Markets are designed to test your patience, confidence, and decision-making. Every losing trade tempts you to change your system — but consistency wins.
✅ Key habits of emotionally disciplined traders:
They accept losses without revenge trading.
They follow rules, not impulses.
They manage expectations — no trade will make them rich overnight.
💰 2. Risk Control — Protect Before You Profit
Your risk management defines your survival. Successful traders think in probabilities, not certainties. They never risk too much on one idea.
📏 Golden Rules of Risk Control:
Risk 1–2% of your capital per trade.
Always use a stop-loss, never a “mental” one.
Define your R:R ratio (minimum 1:2 or better).
Never add to a losing position — only to confirmed winners.
Risk control is not about avoiding losses — it’s about limiting damage and staying consistent over time.
🧩 3. How to Strengthen Emotional Discipline
Like a muscle, discipline grows with routine. Try this daily:
Pre-trade routine – review your plan before every session.
Post-trade journal – log your emotions, not just results.
Take breaks – emotional fatigue leads to poor judgment.
Detach from outcomes – focus on process, not profit.
💡 Tip: When you reduce emotional pressure, your clarity and accuracy both improve.
⚙️ 4. Professional Mindset Shift
Amateurs chase profit; professionals protect capital.
Each trade is just one data point — not a reflection of your worth. Once you start thinking like a risk manager first, your results change naturally.
🗣️ “Discipline is choosing what you want most over what you want now.”
📊 Conclusion
To grow as a trader, focus on controlling yourself before controlling the market.
Emotional stability + strict risk control = long-term success.
Be the trader who executes with logic, not emotion. 🧘♂️
XAUUSDTrading is easy, but trading with convection is only possible after you have 5-6 years of experience trading in every market.
It is this experience that can tell you how high the market can go, if you are tracking the stock correctly, and only then can you estimate how much profit booking can happen.
This is possible only with experience.

LiamTrading - $XAUUSD$: NEW WEEK TRADING SCENARIO...LiamTrading - OANDA:XAUUSD $: NEW WEEK TRADING SCENARIO – PRIORITISE SELLING After BREAKING THE TRENDLINE
Hello traders community,
The new week opens with a clear strategy: Prioritise SELLING after Gold has broken the previous upward trendline.
Although fundamental economic news (like interest rate policies and politics) supports Gold potentially reaching the $5,000$ USD mark, we must trade according to the current Price Action. The technical selling pressure is strong. We will SELL at key resistance zones and continue SELLING as the price breaks the downward structure.
📰 FUNDAMENTALS & LONG-TERM OUTLOOK
$5,000$ Prospect: Fundamental and political factors continue to support the scenario of Gold reaching $5,000$ USD in the long term (due to geopolitical risks and potential loss of Fed independence).
Short Term 🔴: Gold is under technical selling pressure after breaking through the $4,000$ USD mark.
📊 TECHNICAL ANALYSIS: TRENDLINE BREAK
Structure: Gold has exited the upward price channel and is retesting the broken trendline.
Priority: SELL at the retest resistance zone $4024$.
🎯 DETAILED TRADING PLAN (ACTION PLAN)
🔴 SELL Scenario (SELL Primary) - Preemptive Resistance
Entry 1: $4024$ (Sell retest trendline zone)
SL: $4032$
TP1/TP2: $4012$ | $4000$
TP3: $3989$
Entry 2 (Continuation SELL): When price breaks the next trendline at $3992$
SL: $4000$
TP: $3940$
🟢 BUY Scenario (BUY Reversal) - Buy at Strong Support
Logic: Only buy when price hits strong liquidity support, potential for a short-term rebound.
Entry (BUY): Around $3960$ (Buy Scalping Zone)
SL: $3954$
TP1/TP2: $3972$ | $3988 FWB:TP3 : $4000$
📌 SUMMARY & DISCIPLINE (Liam's Note) Don't let the $5,000$ USD prospect affect short-term risk management. Trade according to Price Action. Adhere to SL and prioritise SELL positions at resistance zones.
Are you ready for the SELL strategy at the start of this week?

GOLD SHORT SWING IDEA📊 Weekly Gold Trade Plan (XAUUSD)
Gold is currently in a liquidity-seeking phase after last week’s correction.
Here’s the plan for the coming week 👇
🧠 Institutional Outlook:
If gold opens with a gap-up and shows rejection from our marked supply zone (4050–4070) — that will confirm the presence of institutional selling pressure.
🎯 Swing Trade Setup:
Entry:4040
Stop Loss: 4060
Targets: 4000 / 3980 / 3950 / 3920
Bias:Short (Distribution phase / Liquidity grab scenario)
Trade Type:Swing
⚡ Scalping Plan:
We’ll observe live price behavior at market open.
If gold reacts with volatility or sweeps key liquidity near our zone, we’ll plan short-term scalp setups accordingly.
🧩 Key Note:
No early entries — we’ll wait for confirmation of rejection or displacement before executing.
Our focus this week is discipline + precision not prediction.
Stay sharp. Institutions are hunting liquidity — let’s trade with them, not against them. 💼

LiamTrading - XAUUSD: Outlook $5,000 USD and Priority BUY... LiamTrading - XAUUSD: Outlook $5,000 USD and Priority BUY Strategy at POC $3973
Hello traders community,
Gold is positioned between an extremely optimistic long-term outlook (forecast $5,000 USD in the next 12-18 months by Bank of America) and short-term technical adjustments.
Although Gold has broken the upward trendline, a sustainable downward trend has not been confirmed.
BUY positions are still prioritised!
🔥 LONG-TERM CONTEXT & INFLATION
Long-Term Push: Gold prices adjusted for inflation have DOUBLED in the past 4 years.
Highlight: Gold reinforces its role as an anti-inflation asset as real prices soar to all-time highs.
📊 DETAILED TRADING PLAN (ACTION PLAN)
Strategy: Buy at POC Zone to leverage liquidity advantage.
🟢 BUY Scenario (BUY Primary) - Buy at High Value Zone
Logic: The $3973 - 3975$ zone is right above the Buy POC (highest value zone).
Entry (BUY): $3973 - 3975$
SL: $3968$
TP1: $3988$ | TP2: $4000
Buy Up Target 2: Buy when price retests the trendline around $4002$.
🔴 SELL Scenario (SELL Scalping) - Preemptive strike at resistance zone
Entry (SELL): $4032 - 4034$
SL: $4040$
TP1: $4022$ | TP2: $4015
📌 SUMMARY & DISCIPLINE (Liam's Note)With the $5,000 USD forecast and inflation factors, the risk of SELL is increasing.
Focus on BUY at POC $3973$ and absolute SL.
Trade responsibly and with discipline!

Arbitrage as the Invisible Hand of Market BalanceUnderstanding the Concept of Arbitrage and Why Cross-Market Opportunities Exist.
Introduction: The Timeless Appeal of Arbitrage
In the world of finance and trading, arbitrage is one of the oldest and most reliable concepts for making profits with minimal risk. The idea is simple yet powerful — taking advantage of price discrepancies for the same asset across different markets or instruments. Arbitrageurs act as the balancing agents of the financial ecosystem. By exploiting small differences in prices, they help maintain market efficiency and price stability.
While it might sound straightforward — buy low here, sell high there — in practice, arbitrage is an intricate process driven by technology, timing, and global financial linkages. Cross-market arbitrage, in particular, shows how interconnected today’s world is, where an event in New York or London can instantly impact prices in Mumbai or Singapore.
Let’s delve deeper into what arbitrage means, its types, and why cross-market opportunities continue to exist despite the rise of advanced trading systems and AI-driven algorithms.
1. What is Arbitrage?
Arbitrage is the practice of simultaneously buying and selling an asset in different markets to profit from the difference in price. The key here is simultaneity — both transactions occur at the same time to lock in a risk-free profit.
In essence, arbitrage ensures that the law of one price holds true: an identical asset should have the same price across all markets. When this is not the case, arbitrageurs step in, quickly exploiting the gap until prices converge again.
Example:
Suppose shares of Company X trade at ₹1,000 on the National Stock Exchange (NSE) and ₹1,005 on the Bombay Stock Exchange (BSE). A trader can buy on NSE and sell on BSE simultaneously, earning ₹5 per share in profit before transaction costs. While this seems small, when executed at scale with automation, such trades can generate significant returns.
2. The Core Principle: The Law of One Price
At the heart of arbitrage lies the law of one price, which states that in an efficient market, identical assets should trade for the same price when exchange rates, transaction costs, and other frictions are considered.
If gold is priced at ₹6,000 per gram in India and $70 per gram in the U.S., and the exchange rate is ₹85 per dollar, then ₹6,000/₹85 = $70.5 per gram — nearly identical. Any meaningful difference would invite traders to move gold (physically or virtually) from one market to another until prices align.
However, real-world markets aren’t always perfectly efficient, which gives rise to temporary price imbalances — and hence, arbitrage opportunities.
3. Types of Arbitrage in Financial Markets
Arbitrage comes in several forms, each suited to different asset classes and market structures. Below are the most common:
a) Spatial (Geographical) Arbitrage
This is the classic form of arbitrage where an asset is bought in one location and sold in another. Common examples include commodities, currencies, or stocks listed on multiple exchanges.
b) Temporal Arbitrage
This occurs when traders exploit price differences across time periods. For instance, buying a stock today and selling a futures contract for delivery next month when the future price is higher.
c) Statistical Arbitrage
Here, traders use quantitative models to identify mispriced securities based on historical relationships. It’s not purely risk-free but relies on probability and mean reversion.
d) Triangular Arbitrage (Currency Markets)
In the forex market, triangular arbitrage involves exploiting discrepancies among three currency pairs. For instance, if EUR/USD, USD/GBP, and EUR/GBP don’t align mathematically, a trader can profit by cycling through the three conversions.
e) Merger or Risk Arbitrage
This form occurs during corporate events such as mergers or acquisitions. Traders speculate on price movements between the target company’s current price and the offer price.
f) Cross-Market Arbitrage
This involves exploiting price differences for the same or related assets across different markets or asset classes — such as spot and futures, or equity and derivatives markets.
Cross-market arbitrage is increasingly important in today’s globalized, interconnected trading landscape.
4. Understanding Cross-Market Arbitrage
Cross-market arbitrage happens when traders take advantage of price differences for the same security, index, or commodity across multiple exchanges or platforms — often across borders.
For example, if Reliance Industries trades at ₹2,500 on the NSE but ₹2,507 on the Singapore Exchange (SGX) as a derivative instrument, an arbitrageur could buy the cheaper one and sell the higher-priced version, profiting from the spread until prices converge.
This form of arbitrage often occurs between:
Spot and futures markets (cash-and-carry arbitrage)
Domestic and international exchanges
Equity and derivative markets
Cryptocurrency exchanges across countries
The profit margins may be narrow, but in high-volume or algorithmic environments, these trades can yield consistent gains.
5. Why Do Cross-Market Opportunities Exist?
If markets are efficient, one might wonder — why do such price differences exist at all? Theoretically, arbitrage should eliminate inefficiencies quickly. However, several real-world frictions allow opportunities to emerge and persist, at least temporarily.
Let’s explore the main reasons:
a) Market Segmentation
Not all investors have access to all markets. Regulatory barriers, currency restrictions, or exchange-specific membership requirements can create segmented markets, allowing the same asset to trade at different prices.
For instance, Chinese A-shares often trade at higher valuations on mainland exchanges compared to Hong Kong-listed H-shares of the same company due to limited investor access in mainland markets.
b) Currency Exchange Rates
When assets are priced in different currencies, exchange rate movements can create temporary mispricing. Even slight discrepancies in forex rates can lead to arbitrage between markets.
c) Liquidity Differences
Some markets are more liquid than others. Lower liquidity can lead to price delays or inefficiencies, allowing faster traders to exploit differences between high-liquidity and low-liquidity venues.
d) Information Asymmetry
Not all markets react to information simultaneously. If news reaches one market faster, prices there adjust sooner, creating short-lived arbitrage opportunities elsewhere.
e) Transaction Delays and Infrastructure Gaps
Even in an era of high-frequency trading, minor lags in data transmission or order execution can result in tiny but exploitable differences between exchanges.
f) Demand and Supply Imbalances
Cross-market demand differences — due to institutional orders, fund flows, or hedging needs — can push prices temporarily away from equilibrium, creating room for arbitrage.
g) Regulatory and Tax Factors
Different tax structures, capital controls, or transaction charges across countries can cause effective price differences for the same asset.
6. How Arbitrage Helps Maintain Market Efficiency
Arbitrage isn’t just about making profits — it plays a crucial stabilizing role in the global financial system.
Whenever arbitrageurs exploit price gaps, their actions force prices back toward equilibrium. For example, buying in the cheaper market increases demand (raising the price) while selling in the expensive market increases supply (lowering the price). This self-correcting mechanism ensures that prices remain aligned across regions and instruments.
In this sense, arbitrage acts as a natural regulator of market inefficiencies, contributing to:
Price uniformity
Efficient capital allocation
Market liquidity
Reduced volatility
7. The Role of Technology in Arbitrage
In earlier decades, arbitrage required manual observation, phone calls, and physical trade execution. Today, it’s dominated by algorithms and high-frequency trading (HFT).
Modern arbitrageurs use advanced systems to:
Track price discrepancies in microseconds
Execute simultaneous trades across exchanges
Manage massive volumes with minimal latency
Technological advancements such as co-location (placing servers near exchange data centers), API connectivity, and AI-driven analytics have transformed arbitrage from human-driven intuition to machine-executed precision.
However, this also means that arbitrage opportunities now close much faster — often within milliseconds — requiring traders to invest heavily in technology.
8. Risks and Challenges in Arbitrage
While arbitrage is considered “risk-free” in theory, in reality, several factors can turn it risky:
Execution Risk: Prices may change before both sides of the trade are completed.
Latency Risk: Delays in order processing can erase profits.
Transaction Costs: Fees, taxes, and slippage can turn a profitable trade into a loss.
Regulatory Restrictions: Some countries restrict cross-border or high-frequency trading.
Currency Risk: Exchange rate fluctuations can alter effective profits.
Thus, while arbitrage is low-risk compared to speculative trading, it demands precision, capital, and infrastructure to succeed consistently.
9. Real-World Examples of Cross-Market Arbitrage
a) NSE–BSE Price Differentials
Large-cap Indian stocks often trade simultaneously on both exchanges. Automated systems constantly scan for minute price differences to execute cross-exchange arbitrage.
b) SGX–Nifty Futures Arbitrage
For years, the SGX Nifty index futures in Singapore traded slightly differently than Indian NSE Nifty futures. Arbitrageurs would buy in one market and sell in the other, balancing the two indices.
c) Cryptocurrency Exchanges
Crypto markets, being decentralized and fragmented, often exhibit significant cross-exchange price differences. For instance, Bitcoin might trade at a premium in South Korea compared to the U.S. — known as the “Kimchi Premium.”
10. The Future of Arbitrage in a Globalized Market
As technology continues to advance and global connectivity deepens, traditional arbitrage margins are shrinking. However, new forms of arbitrage are emerging, especially with the rise of:
Digital assets and tokenized securities
Decentralized finance (DeFi) platforms
Algorithmic and machine-learning-based trading strategies
Cross-market inefficiencies will likely persist in newer, evolving markets where regulatory fragmentation, liquidity gaps, and data asymmetry continue to exist.
In other words, while arbitrage profits might be slimmer, the scope of opportunities is expanding — not disappearing.
Conclusion
Arbitrage is more than just a trading strategy — it’s a mechanism that keeps the global financial system efficient and interconnected. By seizing fleeting opportunities born from imperfections, arbitrageurs ensure that prices reflect true value across geographies and instruments.
Cross-market opportunities exist because no market is perfectly efficient. Differences in time zones, liquidity, regulation, and information flow continuously create temporary imbalances. For traders equipped with speed, strategy, and precision, these moments translate into consistent profits — and for the broader system, into greater market harmony and stability.
In a world that trades 24/7 across borders, arbitrage will always find a way — adapting to new technologies, instruments, and markets — remaining one of the purest expressions of financial logic and opportunity.

Xauusd TradePrice has just touched my entry zone and trade is active. Now staying patient and focused — will hold until it reaches the target zone. Trusting the setup, not emotions 💪✨

StevenTrading - $XAUUSD$: New Week's Perspective – Prioritise...StevenTrading - OANDA:XAUUSD $: New Week's Perspective – Prioritise BUYING UP According to Elliott Wave 5, Awaiting Range $3961$
Hello everyone, StevenTrading is back with the Gold scenario for the new trading week!
After a period of strong fluctuations, I am leaning more towards buying scenarios according to Elliott Wave 5.
Although retesting deeper support levels is possible, the technical structure indicates that the potential for price increase remains.
For now, the structure on H1 shows that the price is moving sideways within a wide range.
We will watch the price range to trade before Gold officially breaks the barrier!1.
📊 TECHNICAL STRUCTURE ANALYSIS
Elliott Wave: Prioritise the development scenario of Wave 5. This reinforces the medium-term uptrend.
H1 Structure: The price is fluctuating within a wide range, creating opportunities for Scalping/Day Trade transactions at the upper/lower boundaries.2.
🎯 DETAILED TRADING PLAN (ACTION PLAN)
Our trading strategy this week is to proactively buy at the lower boundary and defensively sell at the upper boundary to maximise the price range.
Primary BUY Scenario (BUY Primary):
We will patiently wait for Gold to adjust to the $3961$ area, a key liquidity support zone (near the Buy Liquidity/Buy Zone on charts).
This is an ideal entry point to participate in the upward movement according to Elliott Wave 5.
The Buy order will be activated at $3961$ with a stop loss SL $3950$ (placed below the $3954$ support) to preserve capital.
Profit targets are divided into increasing levels: TP1 $3975$, TP2 $3990$, TP3 $4012$, and the final target is $4035$ when the price approaches the upper boundary.
SELL Scalping Scenario: To defend and take advantage of the adjustment phase, we will look to Sell just below the strong resistance area at $4050$ (near old resistances and barriers). The Sell order will be placed with a tight stop loss SL $4060$. Profit targets will be prioritised short-term (Scalping) to quickly secure profits.3.
📌 SUMMARY & DISCIPLINE (Steven's Note)The goal is to patiently wait for $3961$ to execute the BUY position with the lowest risk, pursuing the Elliott Wave 5 target. Capital management discipline and adherence to SL are mandatory in this wide-range trading phase.
Are you ready to take advantage of this price range?

Gold Trading Strategy for 31st October 2025📈 TVC:GOLD TRADING PLAN (31 OCT 2025)
💰 BUY SETUP:
➡️ Enter GETTEX:BUY above the high of the 1-hour candle — only after candle closes above $4063
🎯 Target Levels:
1️⃣ $4073
2️⃣ $4083
3️⃣ $4095
🛡️ Stop Loss: Low of the breakout candle or as per your risk appetite
📊 Confirm with strong bullish momentum (RSI rising / volume spike) before entry.
📉 SELL SETUP:
➡️ Enter $Sell below the low of the 1-hour candle — only after candle closes below $3993
🎯 Target Levels:
1️⃣ $3983
2️⃣ $3973
3️⃣ $3963
🛡️ Stop Loss: High of the breakdown candle or as per your risk appetite
📊 Wait for bearish confirmation (strong red candle / volume support) before selling.
⚠️ DISCLAIMER:
📜 This analysis is for educational and informational purposes only. Trading in TVC:GOLD or any other financial instrument involves market risk. Always perform your own analysis or consult a certified financial advisor before taking any trade. The author is not responsible for any profits or losses.

XAUUSDGold has been going down from the beginning of the week. There is possibility of retracement to the up side and take out Buy side liquidity.
Price slows down as it moves down.
Daily is closing bullish. Giving us Inside bar.
We can expect a sell side liquidity sweep and then reverse to target buy side liquidity.
Expect a pull back as price opens on Friday 31 Oct. then reverse to go up.

Short Gold Positionaly#GoldUSD | Swing Setup
Price has completed an extended rally near the psychological 4000 zone and is showing early signs of exhaustion.
A corrective phase is expected as momentum cools off and structure aligns with prior breakout zones.
📉 Setup: Short Gold
🎯 Target: 3445
🛑 Stop Loss: 4148
📅 Expected Completion: 26 Dec 2025
Chart View: Breakdown confirmation below key short-term support with cyclical timing alignment for Q4 2025.
Risk–reward favors a short bias until the 3445 support area is tested.
#BullsBearsClub #GoldAnalysis #SwingTrade #Commodities #TechnicalAnalysis

XAU/USD – Gold Eyes 4,100$ as Safe-Haven Demand Holds Firm🔍 Market Context
Gold continues to attract buyers for the second consecutive day, as renewed safe-haven demand supports a modest recovery from last week’s lows near 3,890$.
While the Fed’s hawkish stance keeps the Dollar firm, concerns over a prolonged US government shutdown and weaker macro sentiment have limited further USD gains — allowing gold to stabilize above the 3,970–3,990$ zone.
Still, with mixed fundamentals in play, traders remain cautious ahead of next week’s US data releases and policy speeches.
📊 Technical Outlook (H1–H4)
Gold has successfully broken its short-term downtrend, reclaiming momentum from the 3,933–3,973$ liquidity zone.
Price is now consolidating below the psychological 4,000$ handle, forming a clean breakout–retest structure.
Key Levels:
• Immediate Support: 3,973$ – 3,933$ (Breakout & Retest Zone)
• Resistance 1: 4,035$ – 4,050$
• Resistance 2 / Target: 4,114$ – 4,127$ (Fibo 1.618 extension)
• Extended Bull Target: 4,148$+ if momentum sustains
Invalidation: A breakdown below 3,930$ would invalidate the bullish scenario and re-open short-term downside liquidity toward 3,890$.
🎯 Trading Outlook
If gold holds the breakout above 3,970$, the bias remains bullish —
buyers may continue driving price toward 4,100$+, aligned with fib extensions and prior supply structure.
However, any hawkish narrative from Fed speakers could trigger intraday pullbacks before continuation.
⚜️ MMFLOW Insight:
“Smart money never rushes the breakout — it builds conviction where liquidity confirms direction.”

Gold Continues to Struggle at 4000We're seeing a familiar story play out in gold as it makes multiple attempts to reclaim and hold above the 4000 level, but none of these efforts are showing the conviction we need to see from buyers. The price action on the hourly chart is particularly telling ,we're witnessing similar structural patterns repeating themselves, which often indicates indecision or a lack of strong directional commitment from either side. Once again, we've seen the rising support trendline get broken, which is not ideal for the bullish case in the short term.
However, there's a small silver lining worth noting. Today's CPR is showing an ascending structure, which typically carries some positive implications for intraday sentiment. It's not a game-changer by itself, but it does suggest that the technical setup isn't completely bearish. The key level to focus on for today's session is the CPR BC at 3971. This becomes our pivotal point ,if bulls can sustain trading above this level throughout the day, we could see another recovery attempt materialize toward the higher side. The ability to hold above 3971 would at least keep the door open for further upside exploration.
On the flip side, if we fail to maintain support at 3971 during the intraday session, it could trigger another leg down toward lower levels. Given the repetitive failed attempts at 4000 and the breakdown of support trendlines, the market is clearly at a crossroads here. We need to see some decisive action one way or the other to break out of this choppy, repetitive pattern.
As for my positioning, there's no change to my approach. I'm still holding my buy positions and actively managing the trades as this price action develops. The patience game continues, and while these repeated failures at 4000 are testing that patience, the broader picture still supports the long-term bullish thesis.

Gold Trading Strategy | October 30-31
✅ From the 4-hour chart, gold has pulled back from the upper highs and remains within a medium-term bearish structure. The current candlestick is attempting to test the upper Bollinger Band (around the 4040–4045 zone). The MA5 and MA10 are starting to converge upward, suggesting the possibility of continued short-term rebound momentum. However, the MA20 is still sloping downward, indicating that the medium-term trend remains weak. Therefore, the current rise is mainly a technical correction.
✅ From the 1-hour chart, gold has broken above short-term moving average pressure and is now operating above the MA5, MA10, and MA20, forming a short-term bullish consolidation structure. Price has repeatedly tested the upper Bollinger Band, and although bullish momentum is sufficient, it is gradually slowing down. The Bollinger Bands are widening, indicating increased volatility in the short term. The 4028–4032 area forms strong resistance (previous high + upper band pressure). If price fails to break above, this zone may cap further upside. Overall, the 1-hour timeframe remains bullish, but caution is required near key resistance levels to avoid a sharp pullback.
🔴 Resistance Levels: 4028–4032 / 4050 / 4072
🟢 Support Levels: 3995–3990 / 3977 / 3955
✅ Trading Strategy Reference:
🔰 If gold tests the 4028–4032 zone but fails to break through, consider light short positions, targeting 3995–3977.
🔰 If gold pulls back to the 3990–3995 zone and stabilizes, you may consider short-term long positions, targeting 4020–4028.
🔰 If gold breaks above 4035, consider light long positions, targeting 4050–4070.
🔥Trading Reminder: Trading strategies are time-sensitive, and market conditions can change rapidly. Please adjust your trading plan based on real-time market conditions.

PCR Trading Strategies How Option Trading Works
Let’s take an example. Suppose you believe Infosys stock will go up from ₹1,500 to ₹1,600 soon. You buy a call option with a strike price of ₹1,500 for a premium of ₹20.
If the stock rises to ₹1,600, your option’s value also rises. You can sell it for a profit.
If the stock stays below ₹1,500, the option expires worthless, and you lose only the ₹20 premium.
Risks and Rewards
Option trading can be highly rewarding but also risky. The risk for buyers is limited to the premium paid, but sellers (writers) of options can face unlimited losses if the market moves against them. Hence, it’s important to understand how options work before investing.

Part 10 Trade Like Institutions Types of Options
There are two main types of options: Call Options and Put Options.
A Call Option gives the holder the right to buy an asset at a predetermined price, known as the strike price, within a specific time frame. Investors buy calls when they expect the asset’s price to rise.
A Put Option gives the holder the right to sell an asset at the strike price before expiration. Traders buy puts when they anticipate a price decline.

Gold Extends Decline Below $4,000 as Risk Appetite Returns🔍 Market Context
Gold continues to weaken as renewed optimism over US–China trade relations reduces safe-haven demand.
Despite the Fed’s dovish tone after the latest FOMC meeting, the Dollar remains relatively capped, offering limited support to bullion.
However, the technical landscape remains bearish — the decisive break below the $4,000 handle signals a continuation of the downside structure that’s been unfolding since early in the week.
📊 Technical Analysis
• Structure: Clear downtrend across H1–H4, with consistent lower highs and controlled liquidity sweeps.
• Key Resistance: 3,985 – 4,000 (former support now turned supply).
• Short-Term Targets:
– 3,925 – 3,930 → initial liquidity pocket.
– 3,880 – 3,860 → extended bearish target aligned with Fibo 1.618 extension.
• Invalidation: Only a confirmed break & hold above 4,020 – 4,030 would shift bias neutral-to-bullish.
🎯 Trading Outlook
If gold retests the 3,985–4,000 zone and fails to reclaim it, sellers are likely to extend control toward 3,920 or lower ahead of the FOMC-driven volatility.
Momentum remains bearish as long as the market trades below the 4,000 pivot — liquidity below 3,900 may attract smart money before any meaningful rebound.
⚜️ Summary
This decline isn’t random — it’s a structural reset.
The market is rebalancing after months of overextended bullish sentiment.
Watch how price reacts between 3,920–3,880 — this zone could define the next shift in gold’s short-term direction.
📊 MMFLOW TRADING Insight:
“Smart money doesn’t chase candles — it waits for liquidity to shift.”
XAUUSD SUPPORT, RESISTNACE & TRENDLINE ANALYSIS I hope whosoever followed my levels should have captured some good moves.
My levels will remain the same as last times.
The bias is now Bullish. Let it break 4025.25 for an up move towards 4044 and breaking that would lead to 4091.25 or 4100.
Note: If it only breaks 3953 then only we can plan for downside

DAILY TRADING PLAN — GOLD (XAU/USD) | Pullback Buy Zones 🧭 DAILY TRADING PLAN – GOLD (XAU/USD)
Date: Oct 29, 2025
Main timeframe: M15 – M30
Strategy: SMC + Trendline + Fibo confluence
🧩 MARKET CONTEXT
Price created a BOS at 3983, indicating short-term bullish momentum within an ascending channel. The current structure supports pullback buys from demand / OB zones before targeting key resistance levels 4018 → 4085–4102 (Fibo reaction zone).
🎯 TRADE SETUPS
1️⃣ BUY #1 (Preferred – Retest Trendline / CP)
Entry: 3961
SL: 3955 (6 pts)
TP1: 3983
TP2: 4018
Structure-based retest at 50% trendline + CP zone
2️⃣ BUY #2 (OBS / OB Zone)
Entry: 3934 – 3932
SL: 3928 (6 pts)
TP1: 3983
TP2: 4018
TP3: 4085 – 4102 (extension target)
3️⃣ SELL (Counter-trend only)
Entry: 3992 – 3994
SL: 4000 (6 pts)
TP1: 3934
TP2: 3910
Use only if there is a clear rejection candle around the 3990s zone.
📈 BIAS
Short-term bullish while above 3930–3910.
Watch 3961 / 3932 zones for buy reactions.
Shorts valid only if strong rejection occurs at 3990s.
