Banking Sector Leadership & PSU Bank Rally – A Deep Dive1. Introduction
The Indian stock market has witnessed several phases of leadership rotation over the years. At times, technology stocks dominate; at other times, energy or infrastructure sectors take the front seat. However, whenever the broader market gears up for a major uptrend or a new bull cycle begins, the Banking sector often takes the leadership role — and within that, Public Sector Undertaking (PSU) banks frequently emerge as key outperformers.
The recent rally in PSU banks and the resurgence of the banking sector as a whole highlight not just cyclical market behavior but also deep structural changes in the Indian economy. To understand this movement, it’s important to analyze both why banking leads and what’s fueling the PSU bank rally in particular.
2. Why Banking Sector Often Leads the Market
a. Core to Economic Growth
Banks are the financial backbone of any economy. When economic activity expands — whether through manufacturing, infrastructure, or consumer spending — banks benefit directly. Credit growth picks up, deposit bases rise, and loan demand strengthens. Therefore, the health and momentum of the banking sector often act as a mirror of economic strength.
b. Credit Cycle Expansion
A strong economy usually corresponds to an expanding credit cycle. When businesses borrow more for expansion, and individuals take more loans for consumption (homes, vehicles, education), banks record higher net interest income (NII) and better profitability.
During the early-to-mid phase of a bull market, credit growth typically accelerates sharply, turning the banking sector into a market leader.
c. Interest Rate Cycle and Net Interest Margins
The interest rate environment plays a crucial role. When rates stabilize after a hiking cycle, banks — especially those with a large low-cost deposit base — witness margin expansion. With loan yields rising faster than deposit costs, Net Interest Margin (NIM) improves.
This scenario often unfolds in the mid-stages of economic recovery — precisely when the stock market’s optimism about growth is at its peak.
d. Heavy Market Weightage
In indices like the Nifty 50 and Bank Nifty, banking and financial services account for around 35–40% of total weightage. Naturally, whenever large investors — both domestic and foreign — turn bullish on India, their first entry point is often the banking sector, leading to index-level leadership.
3. Banking Sector’s Structural Transformation
The Indian banking landscape has undergone a major transformation over the last decade — both in private and public sectors.
a. Clean-up of Balance Sheets
Post the 2014–2018 NPA crisis, Indian banks, particularly PSUs, faced massive challenges due to bad loans, corporate defaults, and poor asset quality. The Insolvency and Bankruptcy Code (IBC) and RBI’s asset quality reviews forced banks to recognize, provision, and resolve bad assets.
Today, most major banks — especially SBI, Bank of Baroda, Canara Bank, and Union Bank — have net NPA ratios below 1%–1.2%, compared to 5–6% a few years ago. This clean-up has set the stage for a sustainable recovery.
b. Digitization & Efficiency Gains
The digital transformation in banking — UPI, mobile apps, digital KYC, and paperless loans — has enhanced operational efficiency, reduced cost-to-income ratios, and improved customer acquisition. PSU banks, once lagging behind in technology, have now made significant progress through partnerships with fintechs and internal digital drives (like SBI’s YONO or BoB World).
c. Government Recapitalization and Consolidation
Between FY2017 and FY2021, the Indian government infused over ₹3 lakh crore into PSU banks, strengthening their capital buffers. Additionally, bank mergers created stronger entities — for example:
Bank of Baroda absorbed Dena and Vijaya Bank,
Canara Bank merged with Syndicate Bank,
Union Bank merged with Andhra and Corporation Bank.
This consolidation reduced fragmentation, created scale, and enhanced competitiveness.
4. The PSU Bank Rally – What’s Driving It?
The PSU bank rally has been one of the most notable themes in the Indian stock market in recent years. After a decade of underperformance, these stocks have turned into multi-baggers, with several PSU banks delivering 200–500% returns in just 2–3 years.
Let’s decode the reasons behind this rally:
a. Massive Valuation Re-rating
For a long time, PSU banks traded at deep discounts to book value — often between 0.3x to 0.6x — reflecting investor pessimism. With the clean-up of balance sheets, profitability return, and stable management, the market started to re-rate these banks.
Currently, large PSU banks trade at 1.0–1.5x P/B, still lower than private peers (2.5x–4x), leaving room for further revaluation.
b. Return of Profitability
Post-2020, PSU banks started showing consistent quarterly profits, driven by lower provisioning costs and higher NII.
Example:
SBI’s FY2025 profits are expected to exceed ₹75,000 crore,
Canara Bank, BoB, and Union Bank are recording ROEs above 15%, levels not seen in over a decade.
These results changed investor sentiment from skepticism to confidence.
c. Credit Growth Momentum
PSU banks are witnessing robust credit growth of 12–14%, led by retail loans (housing, personal, auto), SME lending, and corporate capex revival. Their strong presence in rural and semi-urban areas gives them an edge in deposit mobilization, leading to stable funding costs.
d. Capital Adequacy & Improved Asset Quality
Thanks to recapitalization and internal profit generation, most PSU banks now have Capital Adequacy Ratios above 14%, giving them room to expand their balance sheets. Their Gross NPA ratios have fallen below 4%, compared to 10–12% in 2018.
e. FII and DII Interest
Foreign Institutional Investors (FIIs) and Domestic Institutional Investors (DIIs) have both turned net buyers of PSU banks. The segment is considered a proxy for India’s growth story — benefiting from both cyclical and structural drivers.
Moreover, PSU banks offer attractive dividend yields (3–5%) and stable earnings visibility, making them a favorite in the current interest rate environment.
5. Comparing PSU vs Private Banks
Parameter PSU Banks Private Banks
Valuation (P/B) 0.9–1.5x 2.5–4.0x
ROE/ROA Improving (12–15%) High (16–18%)
NIM 3–3.3% 3.5–4.5%
Asset Quality Improved, but slightly lower Very strong
Technology Adoption Rapidly catching up Already advanced
Growth Drivers Retail, Infra, SME, Rural Credit Premium Retail, Digital, Corporate
Investor Sentiment Recovering fast Already strong
The valuation gap between PSU and private banks has started narrowing, but PSUs still remain value plays, whereas private banks are seen as quality growth plays.
6. Banking Sector as Market Leader in 2025 Cycle
In the ongoing market cycle, banking is again showing signs of leadership emergence, driven by several factors:
a. Capex Revival
India’s private and public sector capex is gaining momentum — from roads and ports to data centers and manufacturing. Banks will play a financing role in this multi-trillion-rupee expansion phase.
b. Liquidity & Deposit Growth
Despite competition from small finance and fintech banks, traditional banks — especially PSUs — have maintained strong CASA (Current Account Savings Account) ratios, ensuring liquidity. This gives them pricing power in a tightening liquidity environment.
c. Credit Quality Cycle at Its Best
With low slippages and strong recoveries, India is in the best credit quality cycle in two decades. Credit costs (provisions as a % of assets) are at multi-year lows, directly boosting profitability.
d. Government Support & Reforms
The government continues to push for PSU bank modernization, privatization of smaller entities, and improvement in governance. The “bad bank” (NARCL) initiative has further helped clear legacy NPAs.
e. Rising Financialization of Savings
With rising income levels and formalization, more money is flowing into banking and financial systems — deposits, mutual funds, and loans — further deepening the sector’s dominance.
7. Technical & Market Structure Perspective
From a market structure angle, the Bank Nifty index is often the leading indicator for Nifty’s trend direction. Historically:
When Bank Nifty outperforms Nifty, it signals broad-based bullishness.
When PSU banks outperform private banks, it often indicates a mid-stage bull market, where value stocks catch up with growth stocks.
As of 2025, both Bank Nifty and Nifty PSU Bank Index are trading near record highs, showing strong volume support, healthy price structure, and institutional accumulation — confirming that leadership lies with the banking pack.
8. Risks & Challenges
Despite strong fundamentals, certain risks remain:
Interest Rate Volatility: A sharp rate hike cycle can squeeze margins.
Global Slowdown: If export demand or global growth falters, corporate loan demand may soften.
Competition from Fintechs: Fintechs may eat into certain profitable retail segments.
Policy Risks: Privatization delays or regulatory tightening can temporarily hurt PSU valuations.
However, these are manageable risks in the current macro setup, as most PSU and private banks maintain high provisioning buffers and stable management practices.
9. Outlook for 2025 and Beyond
The outlook for the banking sector remains constructive and bullish. Analysts expect:
Credit growth of 12–14% CAGR,
NIMs to remain steady,
ROEs to sustain above 14%,
Asset quality to remain stable.
PSU banks are expected to narrow the valuation gap with private banks as they continue to deliver consistent profits, higher dividends, and improved governance.
In the medium term (2025–2027), the PSU Bank Index could potentially outperform broader indices, supported by:
Credit growth in infrastructure, housing, and MSMEs,
Rising investor confidence,
India’s macroeconomic resilience.
10. Conclusion
The Banking sector’s leadership in the market is not accidental — it is rooted in economic cycles, financial system dominance, and investor psychology. Every major bull market in India’s history has been led, directly or indirectly, by banks.
The PSU Bank rally represents not just a price recovery but a structural turnaround story — from being crisis-hit entities plagued by NPAs and inefficiency to becoming profitable, tech-savvy, dividend-paying institutions aligned with India’s growth narrative.
As India’s GDP moves toward the $5 trillion mark, and capex, consumption, and credit cycles expand together, banks — both private and public — will remain the torchbearers of the next leg of India’s equity bull market.
Trade ideas

GOLD DIP ALERT! Sniping the $3,89x FIBO Floor Ahead of FOMC!FranCi$$_FiboMatrix Quick Insight (H1/M30 Focus)
Welcome Traders! Gold paused its sell-off near $4,065 as safe-haven demand returned pre-FOMC. Dovish Fed expectations are weakening the USD, setting the stage for a major rally. This is the final BUY ON DIPS setup!
🧠 INSIGHT & LOGIC
Fundamental Anchor: Weak US inflation and strong expectations for a Fed rate cut are the key drivers limiting downside. Long-term bias is Bullish.
Technical Focus: We are tracking the final deep correction to the $3,89x zone (Fibo 1.5 - 1.618 Extension). This is the ultimate technical floor for the ATH rally.
Action Plan: WAIT for the price to hit this extreme zone and confirm reversal (H1/M30).
🎯 KEY ACTION ZONES
🔥 CRITICAL BUY: $3,89x region ($3,881.435$).
Strategy: BUY on confirmation here.
TP TARGET 1: $4,037.647 (Immediate Resistance).
TP TARGET 2: $4,232.374 (Major Structural Resistance).
SL MANDATE: Place SL safely below the 1.618 Fibo zone.
Patience is key. Do NOT rush the entry! Is the $3,89x$ floor strong enough for the ATH rally? 👇

XAUUSDWe have a consolidation at the bottom of the week. Selling momentum is down.
Friday could be reversal. Taking out the previous week low liquidity and then reversal.

Gold Gathers Momentum Ahead of Fed's Move as Bulls Aim $4070Gold is in a bullish consolidation as prices made sharp upward bounce back off the lows of 3915 and reached a tad higher at 3982 which again faces intermediate resistance.
This may be an attempt to reset institutional order flows for some recovery towards 4050-4100-4150 before any major breakthrough in the directional move or a correctional A-B-C before the next impulse.
Intraday perspective shows buying dips around 3945-3935 as long as swing low of 3915 is intact, with potential upside move in the pipeline.

Elliott Wave Analysis – XAUUSD | 12 November 2025🔹 Momentum
• D1: The daily momentum has completed its upward phase, indicating that we may expect a bearish wave to bring the D1 momentum back to the oversold zone.
• H4: The H4 momentum is currently preparing to turn upward, suggesting a potential bullish move lasting 4–5 H4 candles before the next larger decline.
• H1: The H1 momentum is also about to turn upward, implying that a short-term rally could begin from the current levels.
🔹 Wave Structure
• D1: On the daily chart, price remains within wave (4) yellow. We expect a downward move aligned with D1 momentum, lasting 4–5 daily candles, to complete this corrective wave.
• H4: On the H4 chart, price is currently inside wave X (purple). As H4 momentum approaches the oversold zone while price continues to move sideways, it suggests that one more upward leg may occur to complete wave X.
• H1: On the H1 chart, price has already formed a 3-wave correction, which I mentioned in yesterday’s update. Currently, wave 4 (red) is forming, and once price breaks above the top of wave 3 (red), wave 5 (red) will be confirmed.
🎯 Wave 5 (red) is expected to target the 4200 zone, which is our primary Sell Zone.
If price breaks above 4145 and RSI forms a lower high compared to RSI at wave 3, this will create a bearish RSI divergence, confirming that wave 5 is forming — a good opportunity to look for Sell setups.
However, if price breaks below the bottom of wave 4 (red), it may indicate a truncated wave 5, which would trigger strong selling pressure and lead to a sharp, steep decline.
📈 Trading Plan
• Sell Zone: 4199 – 4201
• Stop Loss: 4215
• Take Profit 1: 4145
• Take Profit 2: 4046
• Take Profit 3: 3932

XAU/USD – Tug of War Before CPI: Sideway or Breakout? 1. MARKET CONTEXT
The US government reopens after a 40-day shutdown (a historic record).
Investors are on the sidelines observing ahead of tomorrow's CPI announcement → the market is likely to sideway awaiting news.
2. TECHNICAL ANALYSIS (H1–M30)
Main fluctuation range: 4097–4148
Break 4097 → adjust deeply to 407x – 403x
Break 4148 → trigger short-term increase, target 418x – 4205
Decision zone: 4097 & 4148
3. TRADING PLAN
🎯 Main strategy: Trade within the range (Sideway)
→ “Buy low – Sell high” according to support/resistance zones
RR ratio: 1:1 – 1:2 | SL: 10 points | TP: 10–20 points
BUY zone:
4097–4100 (strong support) → TP 4110–4120
Buy scalp: 4120–4124 → TP 4140–4145
Buy swing: 407x / 403x (if there is a candle reaction)
SELL zone:
4145–4147 → TP 4125–4100
If break 415x & retest, switch to Buy breakout
→ Entry 4140–4145 | TP 416x–418x–4205
4. SUMMARY
Main trend: Sideway awaiting CPI news
Strategy: “Break whichever range, trade that range”
Focus zones:
Upper range: 414x (Sell)
Lower range: 4095–4100 (Buy)

Gold Continues Its Recovery JourneyHello traders! Let’s take a closer look at what’s happening with OANDA:XAUUSD today.
Gold is currently hovering around the $4,150 level during Wednesday’s Asian session, facing some pressure from a stronger U.S. Dollar. However, this pullback doesn’t seem to disrupt the broader bullish momentum. The precious metal remains supported by growing expectations that the Federal Reserve (Fed) will continue cutting interest rates as the U.S. labor market shows signs of weakness.
On the daily chart, XAU/USD maintains a range that leans from neutral to bullish. A decisive close above the immediate resistance zone could trigger a strong upside breakout, pushing prices toward higher levels. The key question now is: how soon can gold overcome this barrier?
With this outlook in mind, my near-term target remains the $4,200 mark.
What about you — do you agree with this view? 💬 Share your thoughts below!

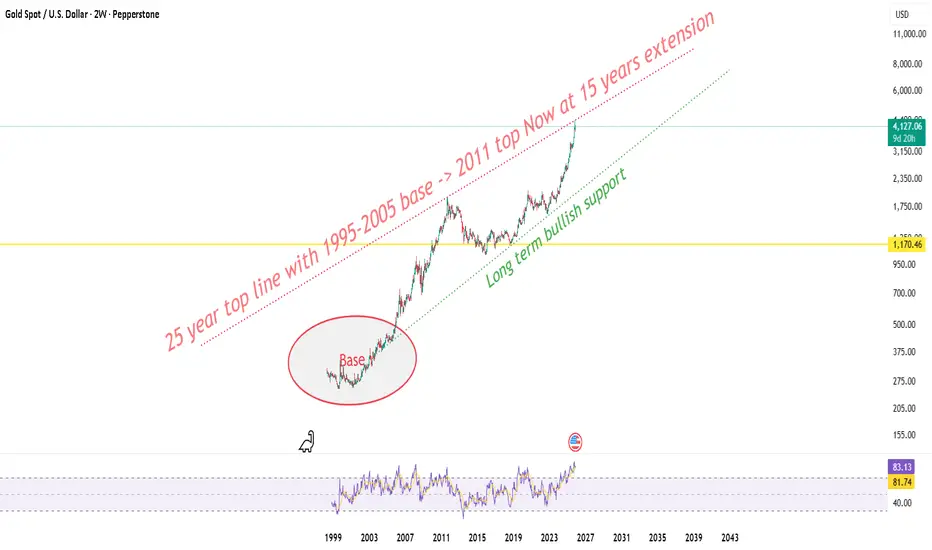
Gold at 25 year top line ! Macro view !Zooming out to the 2 week frame gold’s now touching the same top line that was drawn from the 1995-2005 base to the 2011 cycle high. This upper rail has acted like a generational ceiling and after nearly 15 years, price has stretched back into that very band again, this time near 4150–4350.
This zone isn’t just any resistance it’s the outer wall of gold’s entire super-cycle structure. Historically, whenever price came here with RSI above 80 on the 2-week frame, it marked exhaustion or at least a multi-month digestion phase before the next leg higher. And right now, RSI is sitting around 83 a clear signal of overheated momentum.
Macro context still favors gold in the long term global rate-cut expectations, slower real yields, and consistent central-bank accumulation keep the long-term green base trendline (drawn from 2005 lows) fully intact. As long as that line holds, the long-term structure stays bullish-biased.
But here’s the catch the higher we climb without a structural reset, the more fragile the rise becomes.
So 4365 stands as a major decision point.
Reject from here: we could see a healthy pullback toward 3750-3800 — still within the bullish channel.
Break and close above: that opens the door for a true macro breakout, with next expansion targets sitting around 4800–5200 over the coming years.
For now, this run feels more like a macro stretch ice sitting on sand. Looks shiny, but needs solid ground before it can hold.
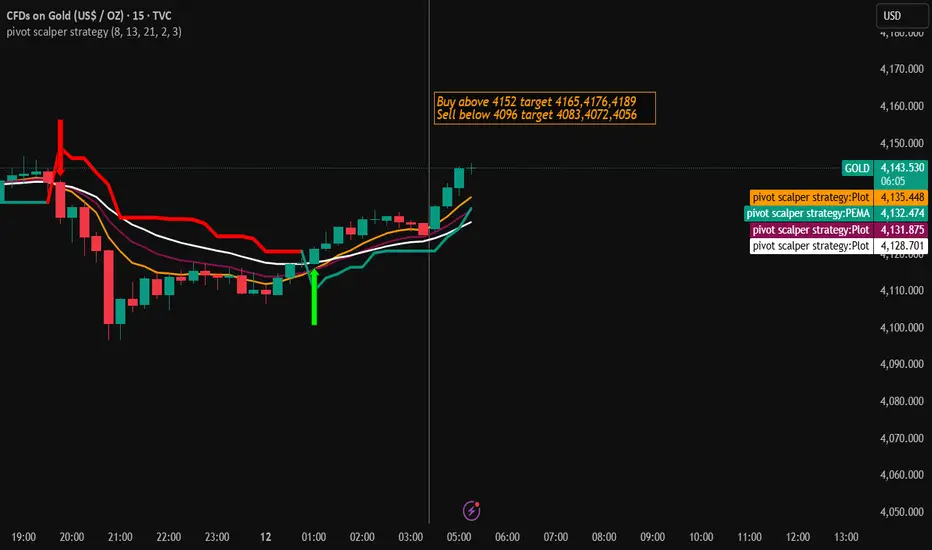
Gold Trading Strategy for 12th November 2025🪙 GOLD Trading Setup (Intraday Strategy)
📈 Buy Setup (Bullish Scenario)
👉 Condition to Enter Buy:
Wait for the 1-hour candle to close above $4152.
This confirms bullish momentum (buyers are taking control).
🎯 Targets after Buy Entry:
Target 1: $4165
Target 2: $4176
Target 3: $4189
🛑 Stop Loss (SL):
You can place your SL just below the breakout candle’s low or around $4140 (for risk control).
💡 Explanation for Beginners:
When the 1-hour candle closes above $4152, it means price has broken an important resistance level. This often attracts more buyers, pushing the price higher toward the target levels.
📉 Sell Setup (Bearish Scenario)
👉 Condition to Enter Sell:
Wait for the 30-minute candle to close below $4096.
This confirms bearish pressure (sellers are taking control).
🎯 Targets after Sell Entry:
Target 1: $4083
Target 2: $4072
Target 3: $4056
🛑 Stop Loss (SL):
Place SL slightly above the breakout candle’s high or near $4110 for protection.
💡 Explanation :
When the 30-min candle closes below $4096, it means the market is showing weakness. This setup allows you to follow the selling momentum as price moves toward lower levels.
⚠️ Risk Management Tips
Never trade without a stop loss.
Risk only 1–2% of your capital per trade.
Avoid entering trades before candle closes — always wait for confirmation.
Stick to your plan; don’t chase trades emotionally.
🧾 Disclaimer
⚠️ This analysis is for educational purposes only and not financial advice. Trading in gold or any financial market involves risk. Always do your own research or consult a financial advisor before making trading decisions.

Gold likely to come downAs obvious from my previous chart.
the correction is major 4 th wave correction.
After 5 wave up move forming 3 rd wave major
gold had undergone correction to form A wave
and this pull back is B wave and C wave correction
has started.it should violate low of wave A and come down more.
please go through the chart and my previous posts to understand
clearly.
like this post if it helps you..follow me to get updates

XAU/USD – Gold Technical Adjustment Before Continuing Uptrend⏰ Timeframe: 30m
📅 Updated: 11/11/2025
🔍 Market Context
After a strong rally from the start of the Asian session, gold paused around 4,130–4,140 USD, indicating a temporary cooling off after a series of consecutive Break of Structure (BOS).
The current price is situated between a short-term resistance zone and a technical support (Order Block) – clearly reflecting a rebalancing behavior after a rapid expansion.
📊 Technical Structure
Resistance Zone (4,145 USD): a short-term reaction area, coinciding with a Weak High. If the price surpasses this, the uptrend structure will continue towards the Liquidity Zone around 4,198 USD.
Order Block (4,111 USD): a confluence area between 0.382–0.5 Fibonacci, likely to attract buying interest when the price adjusts.
OB Deep (4,081 USD): a deep support area, coinciding with the 0.618 Fibonacci level — where buyers might defend the main trend.
Liquidity Zone (4,198 USD): a potential expansion target if the uptrend structure is reconfirmed.
🎯 Market Outlook
High probability scenario:
1️⃣ Price technically adjusts to OB 4,111 or OB Deep 4,081, creating a reaction at the Discount area.
2️⃣ As buying momentum returns, the price may retest the Resistance Zone 4,145, then expand towards the Liquidity Zone 4,198 USD.
3️⃣ Breaking below 4,081 USD will weaken the short-term structure, shifting to a deeper rebalancing state.
🧠 Analyst’s View
This is a natural “cooldown” phase after a strong rally — the market is seeking liquidity before establishing the next upward move.
As long as the price holds above the 4,081 USD area, the main trend remains bullish.
Observing reactions at the OB will help determine if the upward momentum will continue to dominate in the US session.
🛡️ Risk Note
The market is adjusting within a larger trend — avoid emotional actions when the price has not completed the retracement phase.

XAUUSD BUYINGA strong support for XAUUSD 4105 market will regain the Fall till London session on 12/11/2025

XAU Short 11/11/25 Newyork session I am seeing SMT between Gold and Silver on London Highs and Asian Highs both, combined with a Change in State of Delivery. This is totally a time based setup not using PD Arrays.
Do your own research

SONA (XAU/USD): BREAKOUT DONE! FED CUT KA FAYDA. KAB KHARIDEIN?📰 Fundamental Analysis: Bada Game Changer (MUST READ)
Bhaiyon aur Behnon, fundamental factors are very strong for Gold (Sona)!
Rate Cut Ki Umeed (Expectation): Market is expecting more than 60% probability for another Fed Rate Cut in December.
Kam rates means Dollar (DXY) will be weak, aur Gold (non-yielding asset) becomes dhamakedaar (explosive/exciting)!
Economy Thodi Slow Hai: US Consumer Sentiment slid to 50.3 (lowest since June 2022). Yeh data supports a 'Dovish' Fed, jisse Sona ko aur support milta hai (which gives more support to Gold).
💡 Is Hafta Ka Main Focus: Watch out for FOMC member speeches on Wednesday. Poora market unki taraf dekh raha hai (The entire market is looking towards them) for the next direction!
📊 Technical Analysis: Setup Ekdum Solid Hai!
Gold ne ek powerful Breakout diya hai from the consolidation range (4,044 - 4,060). Matlab, trend ab pakka Bullish ho gaya hai! (Meaning, the trend is now definitely Bullish!)
Entry Ka Wait Karo (Patience is key): DON'T JUMP IN NOW! Wait patiently for a pullback to the Demand Zone/CP (4,081 - 4,114). This is the best place to initiate a Long position.
Targets (TP): If the CP zone holds, the targets are 4,155, 4,185, and the big level at 4,236.
Stop-Loss (SL): Keep it safe below 4,044.
🎯 Strategy Summary: Fatafat Dekho!
Strategy: Wait and Buy (Long) in the 4,081 - 4,114 area.
Risk: Dhyaan rakhna (Be careful) if price closes below 4,044.
#XAUUSD #Gold #Sona #FedRateCut #Breakout #TechnicalAnalysis #FOMC #IndianTraders

Trade Journal XAUUSD LONG 11/11/2025Price has tapped H1 FVG on XAUUSD
SMT between Silver and Gold
Turtle soup of lows
Target 1 to 2 Risk to Reward

Gold Holds Firm Above $4,140, Aiming for a $4,200 Breakout🔍 Market Context
Gold continues its strong upward momentum, trading around a 3-week high at $4,146 as buyers maintain full control of the trend.
Despite a slight recovery in the USD due to cautious sentiment in the Asian market, gold's upward drive remains intact — supported by expectations that the Fed might cut interest rates in December.
Weak U.S. economic data and a sharp drop in consumer sentiment have further reinforced this expectation, reducing real yields and increasing safe-haven demand for gold.
📊 Technical Analysis (H1–H4 timeframe)
The market structure remains clearly bullish, with the ascending channel pattern being maintained.
The price has broken through the previous resistance area at $4,086 and is currently consolidating around $4,140, indicating potential preparation for the next upward move.
Important Levels:
• Support: $4,086 – $4,039 → potential retest area for buyers
• Short-term Resistance: $4,146
• Breakout Target: $4,203
• Extended Target: $4,382 (all-time high – ATH)
As long as the price holds above $4,080, the bullish trend is favored.
Only a clear close below this area might trigger a short-term correction before continuing higher.
⚜️ MMFLOW Insight:
“Momentum always follows liquidity. When the price reclaims the main structure, Smart Money stops observing – they start building the next upward wave.”

Gold comex fresh buy given at 4000$ near 4150-80 target Key Highlights (Locked Permanently)
- Supports/Resistances: 4,080 is the critical support; breach flips bias.
- Indicators: ADX >25, RSI 62, PCR 0.94 — all thresholds confirmed.
- Liquidity: Turnover $12.9B, VWAP 4102 — strong institutional activity.
- Volatility: IV 14.3%, RV 13.2% — both below 20% threshold.
- Sentiment: Fear/Greed Index 66 = bullish confirmation.

Elliott Wave Analysis – XAUUSD (Week 2, November 2025) Momentum
W1 timeframe:
Weekly momentum is approaching the oversold zone, suggesting a high probability of a bullish reversal within the next 1–2 weeks. Once confirmed, this could mark the beginning of a new medium- to long-term uptrend.
D1 timeframe:
Daily momentum is moving toward the overbought area. During the first 1–2 trading days of the week (starting Monday), there is a strong likelihood of a downward reversal. If that occurs, the price may enter a short corrective phase to bring D1 momentum back to the oversold zone.
When both D1 and W1 momentums turn upward together from oversold levels, it would signal the potential start of a new bullish trend.
H4 timeframe:
H4 momentum is currently declining, suggesting a possible short-term drop during the Asian session. However, since price is being compressed within the major liquidity zone (POC) highlighted on the chart, the next direction remains unclear. It’s best to wait for a clear breakout beyond this liquidity area before confirming the next move.
________________________________________
🔹 Wave Structure
W1 timeframe:
The larger structure remains within wave (4) in yellow. With weekly momentum nearing oversold territory, wave (4) is likely to complete within the next 1–2 weeks, paving the way for the development of wave (5).
D1 timeframe:
The market is currently deep within the corrective phase of wave (4) in yellow, forming a W–X–Y pattern in purple.
• Wave W (purple) has been completed.
• Price is now likely forming wave X. Once wave X finishes, a downward move to complete wave Y is expected.
Wave W has already reached the 0.382 Fibonacci retracement of wave (3), meaning the minimum price objective for wave (4) has been met. When price achieves its target quickly, Elliott theory suggests the structure often extends sideways to complete in terms of time rather than depth.
A notable possibility:
• Wave W is complete.
• Wave X may have finished as a three-wave a-b-c correction (black).
• Wave Y may now be evolving as a contracting triangle (a-b-c-d-e).
This scenario will be reinforced if D1 momentum moves into the oversold zone simultaneously with a bullish reversal on W1, while price holds above 3897.
H4 timeframe:
Since D1 momentum is likely to turn downward soon, the primary short-term bias remains toward the W–X–Y structure shown on the chart.
Price is currently oscillating around the POC (Point of Control – green line), the highest liquidity area.
Price is approaching this POC from below while both D1 and H4 momentums are near reversal points — signaling potential for another short-term decline to complete wave y.
The 4038 and 4145 zones act as strong resistances and could serve as potential completion points for wave X (purple).
At present, wave X is consolidating within a triangle pattern. Since triangles typically form through contracting, overlapping waves, it’s essential to wait for a clear breakout candle above or below the triangle to determine the next trend direction.
________________________________________
🔹 Trading Plan
In the short term, avoid opening new positions while the price remains within the compression zone.
It’s recommended to observe Monday’s market open for a confirmed breakout direction — once clarity appears, a more precise and safer trading plan can be established.

XAUUSDGold is almost at the Supply. There might be possibility of reversal from here. Buy side liquidity is done. Now it can start targeting sell side Liquidity.

GOLD LIKELY TO RETRACE INTO DEMAND BEFORE EXTENDING HIGHER📅 November 10, 2025 | XAUUSD Daily Trading Plan 💰
🧭 Market Structure Overview
Gold continues to trade within a bullish structure, confirmed by multiple Breaks of Structure (BOS) and a Change of Character (CHoCH) on the 30M timeframe.
The market recently printed a Weak High at 4070, indicating that liquidity remains above and buyers are still in control.
After a strong impulsive leg to the upside, price is expected to retrace into the nearest demand zones before resuming the bullish leg. The unmitigated order blocks around 4001–3999 and 3969–3967 present high-probability re-entry areas.
📊 Technical Breakdown
Structure: Bullish
Liquidity: Equal highs at 4070 likely to be swept before deeper retracement.
Zones of Interest:
Demand #1 → 4001–3999
Demand #2 → 3969–3967
Fair Value Gap: Between 4005–3990 offers potential rebalancing area.
🎯 Trading Plan (LONG Bias)
Entry Zone 1: 4001 – 3999
Entry Zone 2: 3969 – 3967
Take Profit (TP): 4078
Stop Loss (SL): 3994 (6$ risk)
Bias: ✅ LONG
🧩 Rationale
The recent bullish impulse following the CHoCH confirms a structural shift to the upside.
With liquidity resting above the Weak High, we anticipate a short-term retracement to fill imbalance and tap into discount demand zones.
From these zones, bullish continuation towards 4078 remains the most probable scenario — unless price breaks below 3965, which would invalidate the setup.
📌 Summary
Price remains bullish with strong momentum.
Wait for retracement into the identified demand zones for a high-probability long continuation setup.

Gold Neowave Forecast (10-11-2025)Hello everyone
Sorry for absence as I go in research mode with Neowave and found something interestin, anyway lets talk about gold.
# Gold is started walking again in daily charts and its going or atleast try for the time being to break its all time again.
# I also added a blue box on the chart which is an time box, mean price must cross high within this time limits.
## Stoploss will be 3964 if breaks dont sell just exit.
Rest we will talk in the video along with BTC and Tesla.
Thank You.

XAUUSDGold is in bullish phase. It can retrace back to the demand zone in near future. Keep patience and wait for it to tap into the demand. Target whatever the recent new high would be, just above that.
