Gold Mini Futures
In-depth trading ideas
Trading Masterclass #1Institutional trading means trading like hedge funds, banks, prop firms, and professional desks. They do not trade based on emotions, random tips, or gambling. They use systems, probabilities, risk control, position sizing, discipline, and psychology.
Retail traders often lose because they focus only on “entry.” Institutions focus on:
Risk Management
Capital Protection
Position Sizing
Probability
Psychology
Consistency
Repeatable Edge
In options trading, if you think like institutions, your r
How To Understad Option?Institutional Option Trading (7 Key Points):
Smart Money Activity – Institutions like banks, hedge funds, and FIIs trade options with large capital, creating strong directional moves in the market.
Option Chain Analysis – They focus on OI buildup, unwinding, and PCR to identify accumulation/distribution zones.
Liquidity Zones – Institutions trade where liquidity is high (ITM/ATM strikes), ensuring easy entry and exit without slippage.
Hedging Strategies – Use advanced strategies like spreads
Institution Option Trading Part-3PCR means Put Call Ratio
It tells us how many Put options and Call options people are buying or trading.
Why it matters for institution trading
Big players mostly use options. So PCR helps us understand what big money may be thinking.
If PCR is high
More puts than calls.
Means traders are scared or taking protection.
Sometimes big players expect weakness.
If PCR is low
More calls than puts.
Means confidence in upside.
Sometimes market is bullish.
GOLD INTRADAY LEVELS - 14-OCT-2026GOLD Intraday Levels to Watch — 14 October 2026
Key zones marked on the chart for today’s session:
🔴 Supply Zones
150,497– 150,097
149,348– 149,091
🟢 Demand Zones
148,177 – 147,920
147,178 – 146,778
These are the key Demand & Supply zones to watch during the session. Price reaction around these areas can provide important intraday information.
No directional bias or trade call — just the levels to watch.
Levels are based on the chart structure and are for educational purposes only.
GOLD LEVELS - 12-OCT-2026GOLD Levels to Watch — 12 October 2026
Key zones marked on the chart for today’s session:
🔴 Supply Zones
153,483 – 153,094
152,329 – 152,061
🟢 Demand Zones
151,135 – 150,867
150,115 – 149,699
These are the key Demand & Supply zones to watch during the session. Price reaction around these areas can provide important intraday information.
No directional bias or trade call — just the levels to watch.
Levels are based on the chart structure and are for educational purposes only.
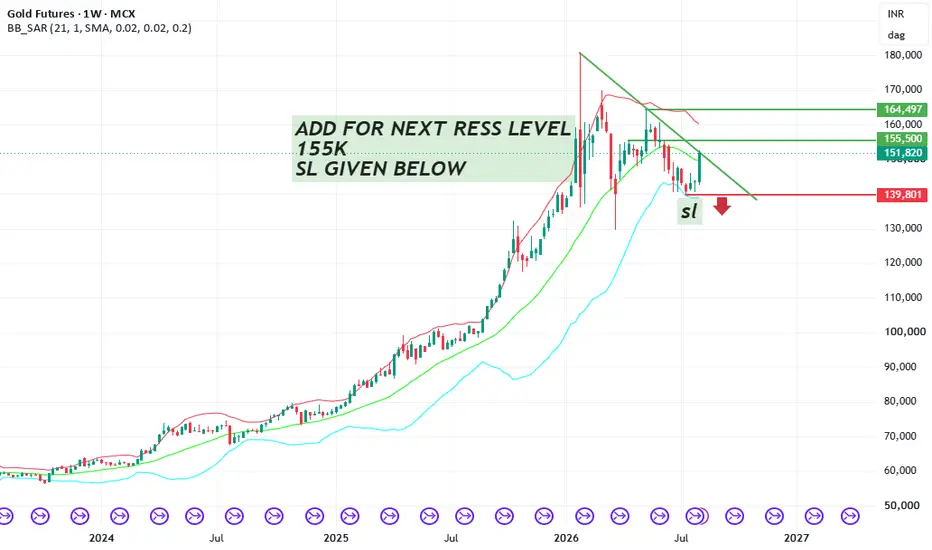
Gold Futures: Wave C May Extend Toward 139,801Gold Futures is showing a corrective structure after the rejection from 164,773, with the current movement appearing to develop as a Wave C of the larger Y correction. The flat formation suggests further downside is still possible before the correction is complete.
The 145,147 area is the first important downside level, marked by the 0.786 retracement and near-term support zone. If selling pressure continues below this area, the correction could extend toward 139,801 , which is the key struc
Gold: Decade Cycle Projection (2026–2032)📊 Technical Analysis
1. Macro Trend & Structural Consolidation
On the weekly timeframe, MCX Gold is digesting a powerful multi-year impulsive expansion phase that set record highs.
Rather than experiencing a sharp structural breakdown, price action is currently carving out a high-probability symmetrical triangle / wedge continuation pattern spanning multiple years.
Horizontal Resistance Ceiling: Capping the immediate upside is a major structural resistance zone near the ₹165,000 – ₹170,000
GOLD LEVELS - 13-OCT-2026GOLD Intraday Levels to Watch — 13 October 2026
Key zones marked on the chart for today’s session:
🔴 Supply Zones
151,563 – 151,163
150,364 – 150,133
🟢 Demand Zones
149,200 – 2148,921
148,194– 147,758
These are the key Demand & Supply zones to watch during the session. Price reaction around these areas can provide important intraday information.
No directional bias or trade call — just the levels to watch.
Levels are based on the chart structure and are for educational purposes only.
GOLD Intraday Levels - 15-OCT-2026GOLD Intraday Levels to Watch — 15 October 2026
Key zones marked on the chart for today’s session:
🔴 Supply Zones
149,404– 148,989
148,212– 147,955
🟢 Demand Zones
147,011 – 146,728
146,015 – 145,565
These are the key Demand & Supply zones to watch during the session. Price reaction around these areas can provide important intraday information.
No directional bias or trade call — just the levels to watch.
Levels are based on the chart structure and are for educational purposes only.
GOLD Levels - 16-OCT-2026GOLD Intraday Levels to Watch — 16 October 2026
Key zones marked on the chart for today’s session:
🔴 Supply Zones
149,669– 149,232
148,520– 148,246
🟢 Demand Zones
147,320 – 146,071
145,308 – 145,913
These are the key Demand & Supply zones to watch during the session. Price reaction around these areas can provide important intraday information.
No directional bias or trade call — just the levels to watch.
Levels are based on the chart structure and are for educational purposes only.
Trading Road Mapoptions trading and institutional trading are important parts of modern financial markets. Options trading offers flexibility and opportunities for profit, while institutional trading provides liquidity and stability to the market. However, beginners should learn market concepts carefully before entering options trading because losses can occur quickly without proper knowledge and risk management. Education, practice, and disciplined investing are essential for long-term success in trading.
Institution Option Trading Part-1PCR means Put Call Ratio
It tells us how many Put options and Call options people are buying or trading.
Why it matters for institution trading
Big players mostly use options. So PCR helps us understand what big money may be thinking.
If PCR is high
More puts than calls.
Means traders are scared or taking protection.
Sometimes big players expect weakness.
If PCR is low
More calls than puts.
Means confidence in upside.
Sometimes market is bullish.
Trading AnalysisOption Chain Analysis: Decoding Open Interest (OI) to find where the "Big Players" are positioned.
FII/DII Data: Understanding institutional activity and its impact on market direction.
Intraday Strategies: Scalping and swing setups using Price Action and key EMAs.
Global Market Cues: How GIFT Nifty and US Markets might influence our opening.
RSI : The Best way to use in TradingTHE BEST USE OF RSI IN TRADING
RSI is one of the most widely used indicators in technical analysis.
But many traders use it only for:
RSI above 70 = Sell
RSI below 30 = Buy
That is where the real understanding of RSI often stops.
Let's understand how RSI can be used more effectively.
1. THE BIGGEST RSI MYTH — OVERBOUGHT & OVERSOLD
RSI above 70 does NOT automatically mean price must fall.
RSI below 30 does NOT automatically mean price must rise.
In a strong uptrend, RSI can re
gold 🟡 Gold — Bearish Setup
Gold has broken below the ₹149,300–₹149,400 support zone on the daily chart, weakening the short-term structure.
📉 A sustained move below ₹149,300 could open the way toward the next major support around ₹140,000.
Bearish below: ₹149,300
🎯 Downside zone: ₹140,000
⚠️ Invalidation: Reclaiming ₹149,300–₹150,000 and holding above it.
The key now is whether the breakdown sustains or price quickly reclaims the support zone.
Breakdown confirmation matters — avoid assuming the
GOLD MCX | ₹154,500 Breakout — Can Momentum Extend?Gold MCX is showing a meaningful 4-hour recovery attempt after breaking above the falling trendline that controlled price through most of September.
Price is now around ₹154,000–154,500, which makes this the first important breakout-confirmation area rather than a place to assume the move is already complete.
Current stage: 4H Breakout Confirmation
Primary timeframe: 4 Hour
Intended horizon: Short-term swing / trading
Why this chart matters now
The recent 4H structure has improved:
the fall
Institutional Trading MasterclassCore Structure of Institutional Option Trading
Institutions focus on 4 pillars:
A. Direction
Will market go up, down, sideways?
B. Volatility
Will movement increase or decrease?
C. Time Decay
How much premium melts daily?
D. Risk Exposure
How much capital at risk?
Rules to Become Consistent
Never trade without plan
Never increase size emotionally