Institutional Trading MasterclassCore Structure of Institutional Option Trading
Institutions focus on 4 pillars:
A. Direction
Will market go up, down, sideways?
B. Volatility
Will movement increase or decrease?
C. Time Decay
How much premium melts daily?
D. Risk Exposure
How much capital at risk?
Rules to Become Consisten
Sorry, this is only available to registered users
MCX provides data to our registered users only, so to get it you'll need to sign up for a TradingView account.
Compare with Silver Futures
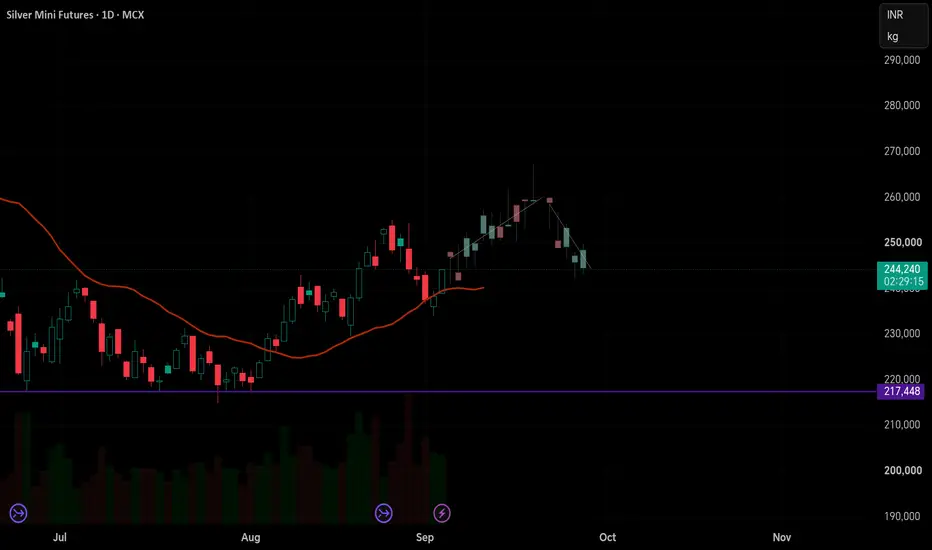
SILVER VIEW⚠️Education Purpose only!!!!
Key Support area:-87,100
Key Resistance area:-96,200
Silver has long been considered a 🏦 store of value and a 🛡️ hedge against inflation.
Riskier but suitable for speculation and hedging.
🔧 Industrial Demand – Used in ⚡ tech, ☀️ solar, 🚗 EVs
💰 Monetary Hedge – Safe-ha
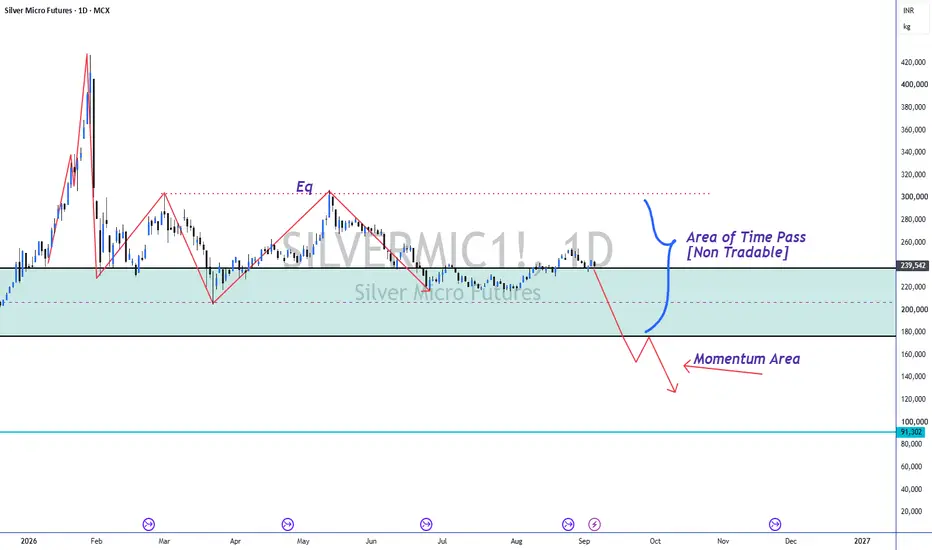
SILVERMIC: Volatility Compression at Major ResistanceCategory: Technical Analysis
Bias: Long
Timeframe: 1D (Daily)
The Macro Sentiment & Setup
Silver is currently sitting at a fascinating crossroads. Driven by shifting global macroeconomic winds and its dual identity as both a precious safe-haven and a critical industrial metal, market sentiment is p
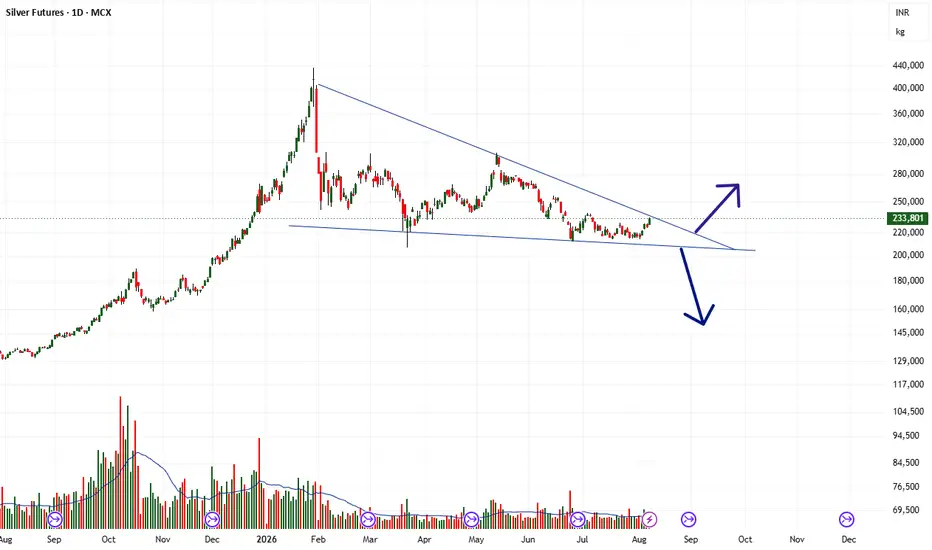
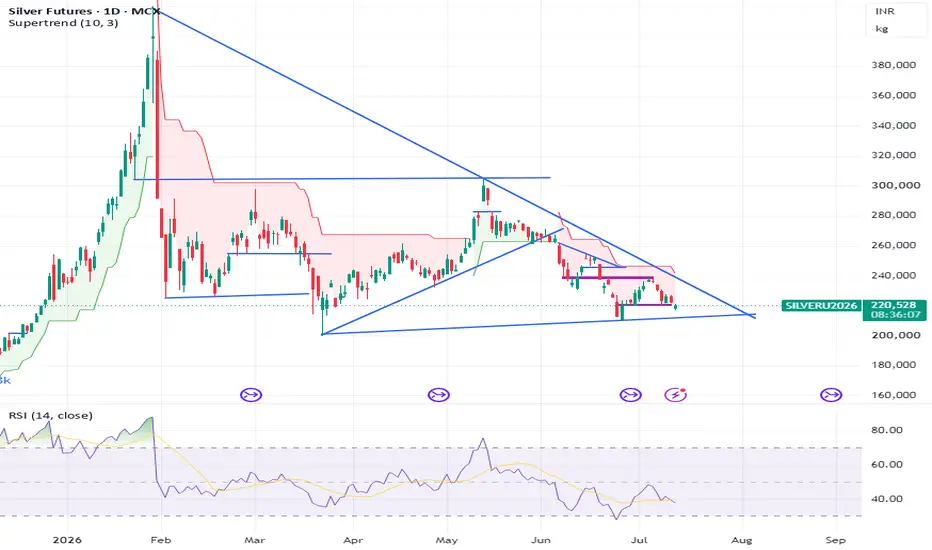
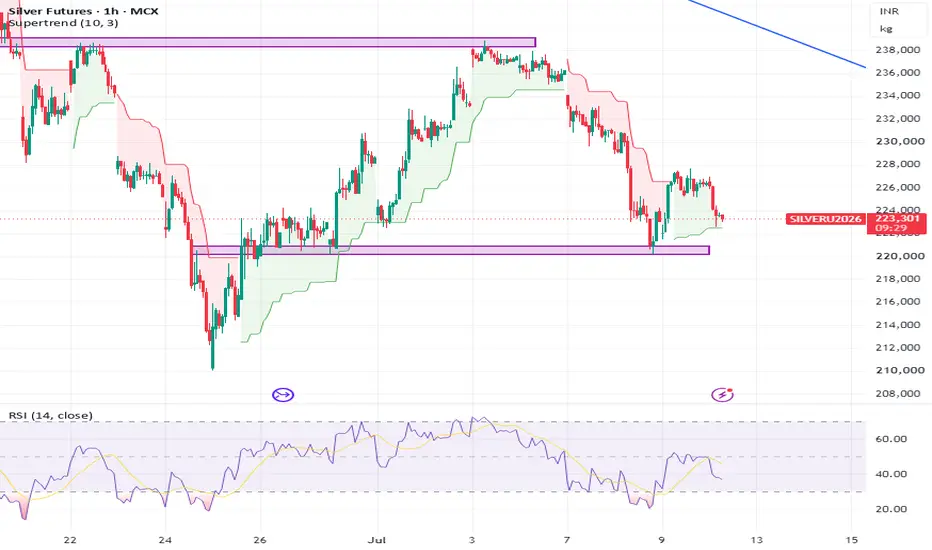
silver short term update as per chart in trend line formation some analysis here may be i wrong but will try to best .
daily chart showing bear mode only yes some bounce back may be happen.
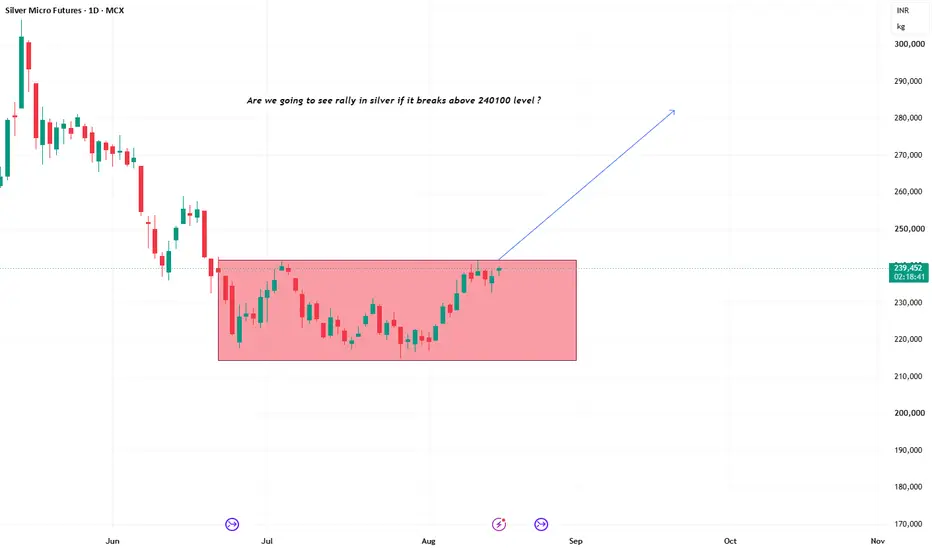
hurdle 225--228300 if sustain above or close above than looks sharp up side 232--238000+++ or above 240000 see fire boom 260000+++ nea
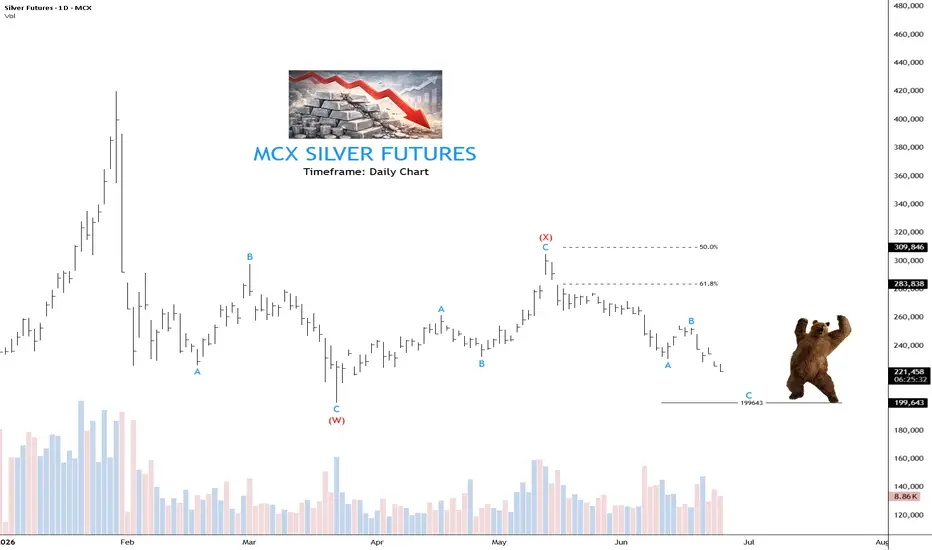
MCX Silver Futures: May Test The 199600–194000 Support AreaTrading Outlook for MCX:SILVER1!
=============================
Silver Futures remain under pressure after a corrective recovery failed near 3,04,900 . The current decline may extend towards the 1,99,600–1,94,000 support zone. The overall short-term outlook remains negative while prices stay b
See all ideas
A representation of what an asset is worth today and what the market thinks it will be worth in the future.
Sorry, this is only available to registered users
MCX provides data to our registered users only, so to get it you'll need to sign up for a TradingView account.
Displays a symbol's price movements over previous years to identify recurring trends.