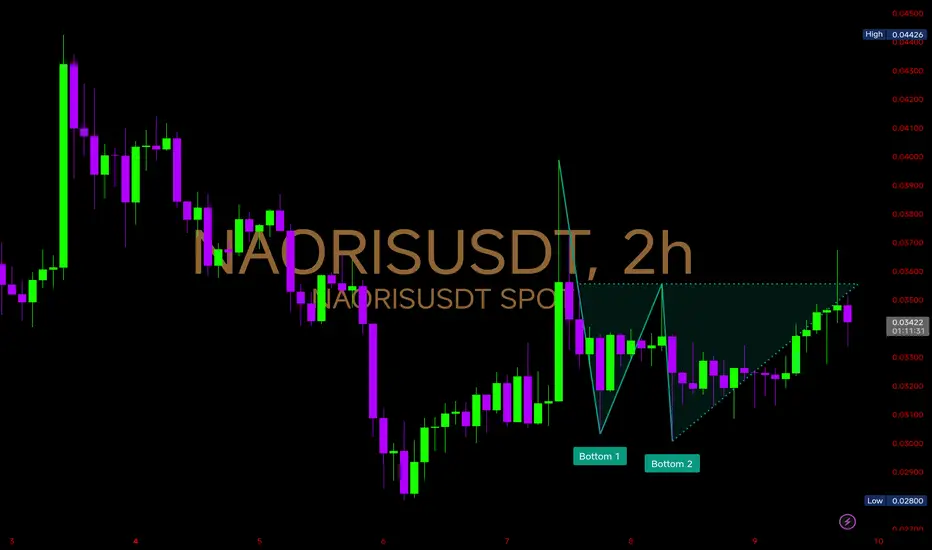
$NAORIS – Double Bottom Formation $NAORIS – Double Bottom Formation
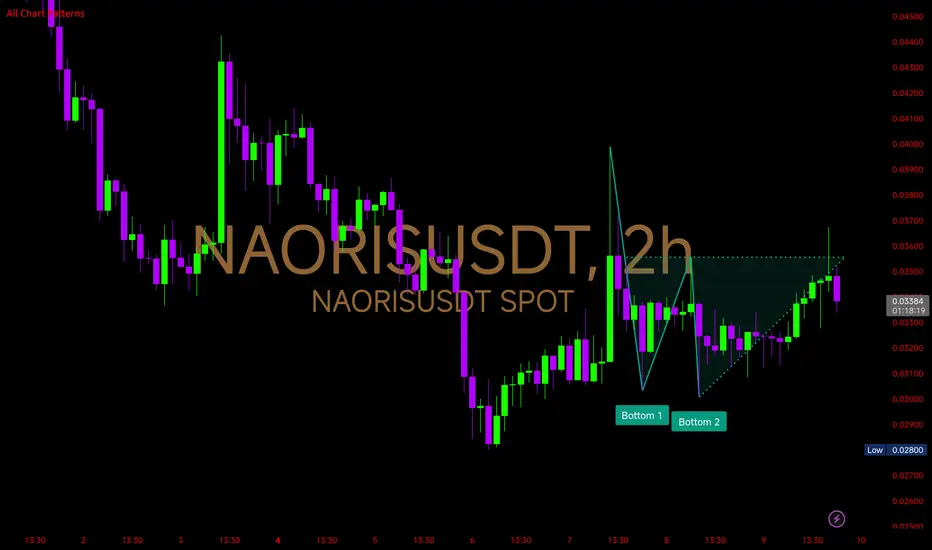
The 2Hr chart is showing a Double Bottom pattern — a classic bullish reversal signal that forms after extended downtrends, indicating sellers are losing momentum and buyers are stepping in.
🔸Bottom 1 (~0.0308): First rejection after a steep decline, signaling initial demand.
🔹Bottom 2 (~0.0310): Retest of the support zone with a higher low wick rejection, confirming the strength of the demand area.
🔸Neckline Resistance (~0.0358–0.0360): This is the breakout
 Long