Bajaj Holdings – End of Wave V: Time to Exit?
Timeframe: Monthly Chart
Bajaj Holdings appears to have completed a larger-degree Wave V, forming a 5th wave extension.
Under Elliott Wave Principle, when Wave 5 is the longest, it typically extends 1.618 times the distance from Wave 1’s start to Wave 3’s end.
In this case, Wave 5 has indeed traveled 1.618x of that measure, while Wave 3 extended 1.414x of Wave 1.
Further internal wave counts align well with this structure, strengthening the case for a completed cycle.
Conclusion:
The larg
Bajaj Holdings & Investment Limited.
No trades
No trades
In-depth trading ideas
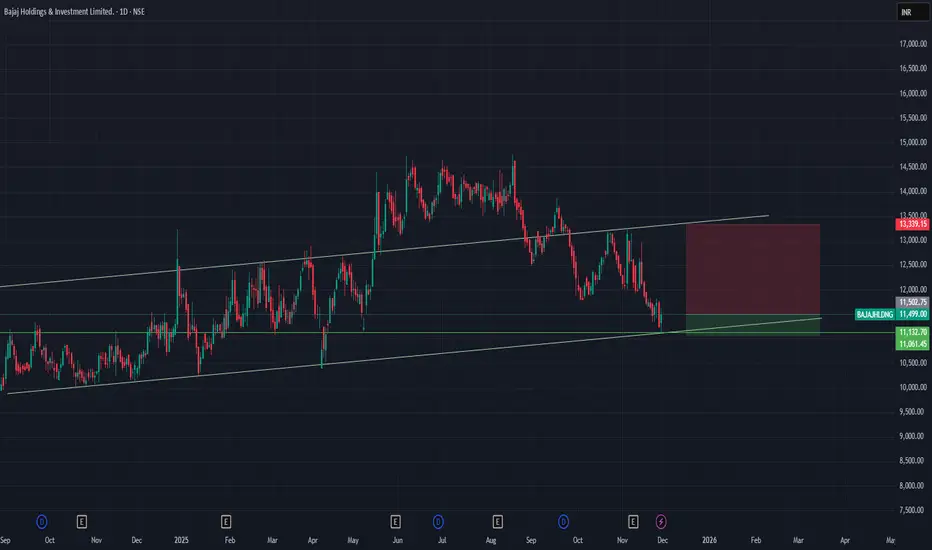
#BAJAJHLDNGPrice Action: The stock has plummeted from a February high near ₹11,200 to its current price of ₹8,746.00, representing a massive 4.42% drop in the most recent session alone.
Structure: This is a clear "liquidity flush." The stock has broken through several key psychological levels without any significant retracement, forming a steep vertical descent.
Support Levels: It is currently approaching a major historical support zone near ₹8,400. If this level fails to hold, the next significant floor
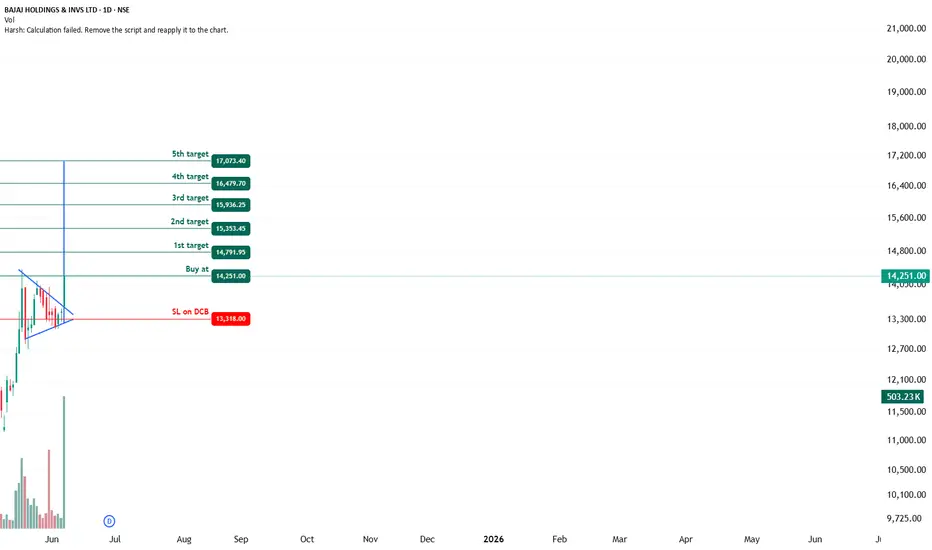
BAJAJ HOLDINGS - Bullish Flag & Pole Breakout (Daily T/F)Trade Setup
📌 Stock: BAJAJ HOLDINGS ( NSE:BAJAJHLDNG )
📌 Trend: Strong Bullish Momentum
📌 Risk-Reward Ratio: 1:3 (Favorable)
🎯 Entry Zone: ₹14251.00 (Breakout Confirmation)
🛑 Stop Loss: ₹13318.00(Daily Closing Basis) (-6.3% Risk)
🎯 Target Levels:
₹14791.95
₹15355.45
₹15936.25
₹16479.70
₹17073.40 (Final Target)
Technical Rationale
✅ Bullish Flag & Pole Breakout - Classic bullish pattern confirming uptrend continuation
✅ Strong Momentum - Daily, Weekly & Monthly RSI >60 (Bullish zone)
✅ Volum
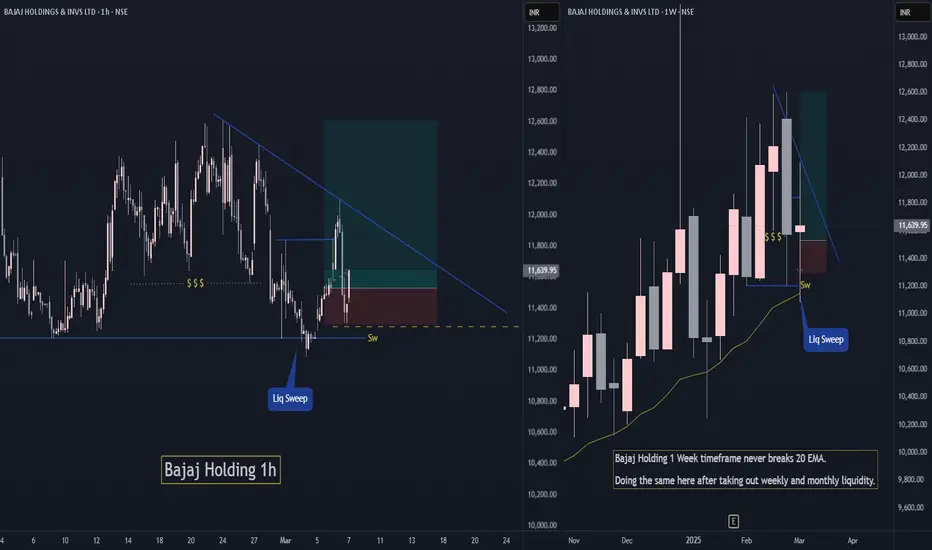
Bajaj Holding Short Term Swing TradeBajaj holding has grabbed monthly and weekly liquidity while maintaining is uptrend.
If Nifty holds current levels ie. above 22400 then Bajaj Holding has high chances to move up and continue its trend.
Do like or follow for more Trading ideas like these. You can comment your views on this analysis.
Bajaj holding and invst
#BAJAJHLDNG
Weekly chart..
Keep an eye on it..
Bajaj Holdings & Investment has demonstrated strong performance, gaining 5.41% on January 31, 2025, and outperforming its sector. The stock is trading above key moving averages, indicating a positive trend, despite a slight decline over the past month. Its resilience in the finance sector is noteworthy.
BAJAHLDNG Positional LongDate : 21-07-2024
-------------------------------------
BO + Consolidation RESEARCH TO OBSERVE
BAJAHLDNG Looks Good ABOVE 9940
SL 8444
Target 10179, 10419, 10659, 11139, 12098
Hold Period : Few Months
Reason for Pick : Pole & Flag, Consolidating, Above 20, 50, 200 SMA
Please consult your financial advisor before investing
All research for educational purposes only.
bajaj holdings & investments consolidating buying opportunity
->bajaj holdings conatins bajaj finserv,baja auto ,bajaj finance (results on jan 20 2020)where everything hit all time high
->but bajaj holdings still trading below precovid levels still lacking 25% from precovid level of 3900,
->& results are there on jan 21 ,and bajaj finserv might also get banking license mostly the event is expected by jan15,
->if we look at valuations usually any holdings company will trade at 60% of their ture value, even factoring that bajaj holdings should trade at 500
Are you bullish on this stock from Bajaj ?While scanning my list i can across this setup on the weekly time frame where this stock is trying to make a stable base and getting ready to follow its trend (Bullish).
One can keep an eye on this stock CMP 8,388 and can reach the ATH 9,500.
P.s Always follow the trend and do your own study.
BAJAJHLDNG | Swing Trade📊 DETAILS
Sector: Finance - NBFC
Mkt Cap: 91,739 cr
Bajaj Holdings & Investment Ltd. operates as an Investment Company and is registered as a Non-Banking Financial Institution – Investment and Credit Company with the Reserve Bank of India. The Co. holds more than 30% stake in both Bajaj Auto Ltd. and Bajaj Finserv Ltd.
TTM PE : 16.56 (High PE)
Sector PE : 31.53
Beta : 0.46
📚 INSIGHTS
Strong Performer
Stock with consistent financial performance, quality management, and stro
BUY TODAY SELL TOMORROW for 5%DON’T HAVE TIME TO MANAGE YOUR TRADES?
- Take BTST trades at 3:25 pm every day
- Try to exit by taking 4-7% profit of each trade
- SL can also be maintained as closing below the low of the breakout candle
Now, why do I prefer BTST over swing trades? The primary reason is that I have observed that 90% of the stocks give most of the movement in just 1-2 days and the rest of the time they either consolidate or fall.
Trendline Breakout in BAJAJHLDNG
BUY TODAY SELL TOMORROW for 5%
Amazing breakout on Weekly / Daily Timeframe - BAJAJHLDNGCheckout an amazing breakout happened in the stock in Weekly timeframe, macroscopically seen in Daily timeframe. Having a great favour that the stock might be bullish expecting a staggering returns of minimum 25% TGT. IMPORTANT BREAKOUT LEVELS ARE ALWAYS RESPEECTED!
NOTE for learners: Place the breakout levels as per the chart shared and track it yourself to get amazed!!
#No complicated chart patterns
#No big big indicators
#No Excel sheet or number magics
TRADE IDEA: WAIT FOR THE STOCK TO B
Resistance Breakout - BAJAJHLDNGPlease look into the chart for a detailed understanding.
Consider these for short-term & swing trades with 2% profit.
For BTST trades consider booking
target for 1%-2%
For long-term trades look out for resistance drawn above closing.
Please consider these ideas for educational purpose
Please note that, if there are some big targets, those are drawn thinking for long term.