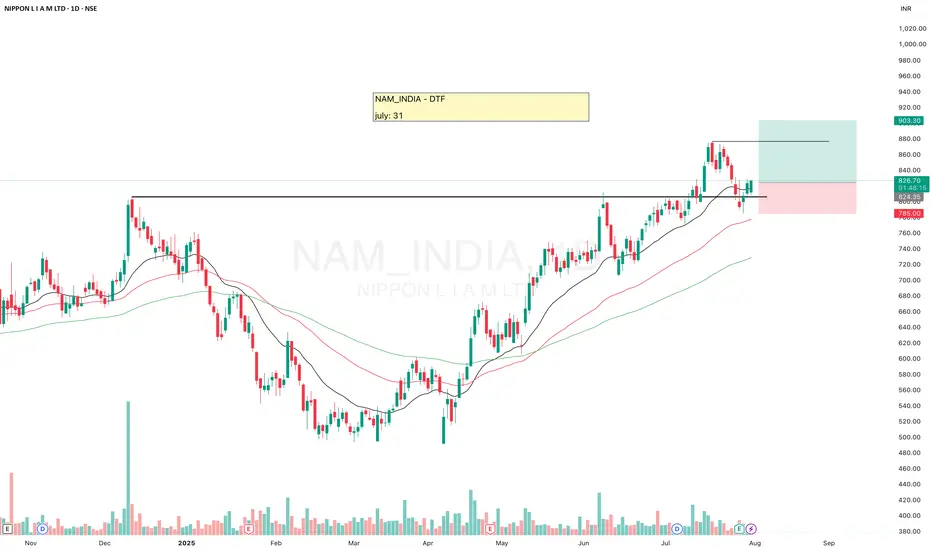
NAM_INDIA (NIPPON L I A M LTD)NAM_INDIA looks good.
It has re-tested the resistance, and seems to be ready for another upside move.
Must use the SL.
✅ If you like my analysis, please follow me here as a token of appreciation :)
in.tradingview.com/u/SatpalS/
📌 For learning and educational purposes only, not a recommendatio
Next report date
—
Report period
—
EPS estimate
—
Revenue estimate
—
21.05 INR
12.86 B INR
25.21 B INR
175.35 M
About Nippon Life India Asset Management Ltd.
Sector
Industry
CEO
Sundeep Sikka
Website
Headquarters
Mumbai
Founded
1995
ISIN
INE298J01013
FIGI
BBG00HW0QG02
Nippon Life India Asset Management Ltd. provides asset management company services to the fund and portfolio management service to clients. Its services include management and advisory of mutual funds, pension funds, managed accounts, alternative investments and offshore funds. The firm operates through the India and Outside India geographical segments. The company was founded on February 24, 1995 and is headquartered in Mumbai, India.
Related stocks
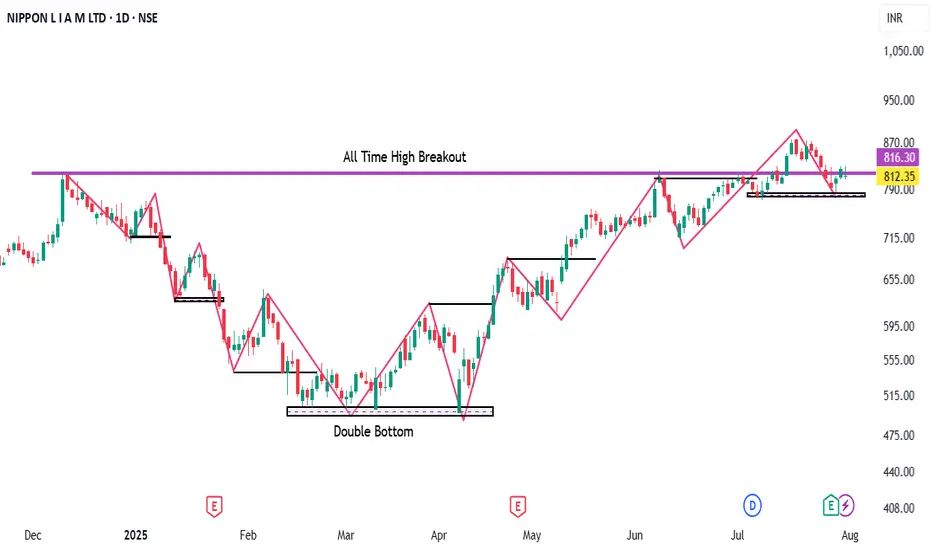
Suggest buy for the target 880/890Technical :
=> All time High Breakout
=> Breakout and retest done
=> Market Structure Shift clearly identified
=> Trend reversal done (From LH/LL to HH/HL)
Fundamental :
=> Reported a strong Q1FY26 operating profit of Rs.380Cr in-line with estimate
=> Equity/Dept AUM growth was also healthy at 8.5
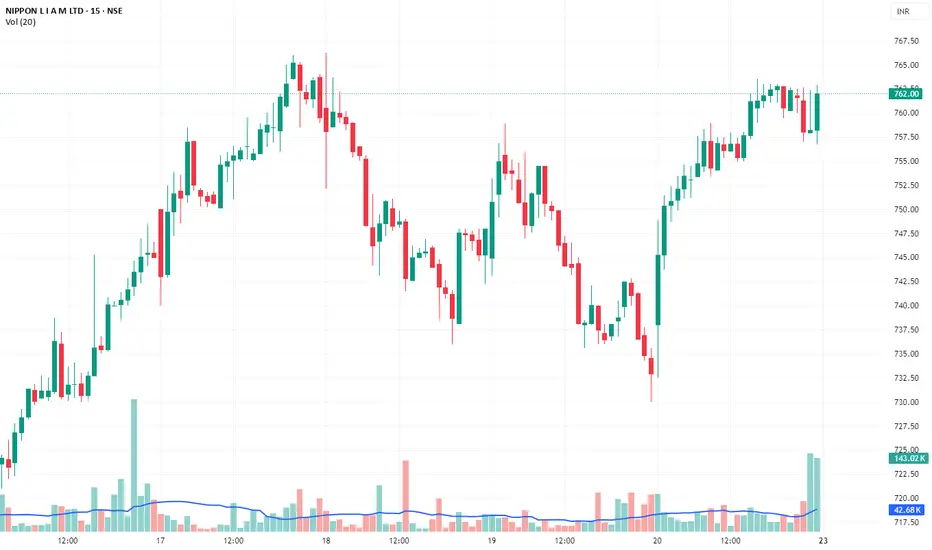
NIPPON AMC – Steady Breakout with Accumulation | BTST to 3-Day ICMP: ₹761.15
Trade Type: BTST / Short-Term Positional (3–4 Days)
Confidence Level: ⭐⭐⭐⭐½ (85–90%)
🧠 Technical Setup & Reasoning:
✅ Breakout from Ascending Channel: Price has broken out above the ₹755–758 zone, which acted as the upper boundary of a rising channel.
✅ Volume Expansion: Accumulation v
Cup and Handle Breakout - NAM_INDIANAM_INDIA : The fundamental performance of Nippon Life India Asset Management, including its AUM (Assets Under Management), revenue growth, and profitability, will influence investor confidence and the stock price. Recent quarterly results (Mar 2025) showed a 20.99% year-on-year increase in net sale

NamindiaFundamental Analysis of NAM INDIA (NSE)
Based on the latest available information up to May 18, 2025, here's a detailed fundamental analysis of NAM INDIA:
1️⃣ Financial Statements Analysis
* Revenue Growth:
* Year-over-Year (YoY): NAM INDIA has shown strong YoY revenue growth of 46.65%.
* Qua
DAILY chart NAM-INDIA Retested on Breakout Level 15% Up PossibleHello, Traders! 👋
Welcome to my TradingView profile! 🚀
Here, I share my insights, strategies, and ideas to help you navigate the markets with confidence. Whether you’re a beginner or an experienced trader, I aim to provide valuable content to guide you on your journey.
🌟 What to Expect:
• Detailed t

Nippon LIAM setting up again after Breakout-Pullback. Watch!Breakout from Previous Resistance of 739 with Huge volume and Wide Range Candle on 10 Dec 2024...
🟢Pulled Back/Retested on the back of low volumes.
🟢Setting up again with a wide range/Bullish Engulfing Candle.
🟢Forming a VCP on DTF.
🟢Apt for building positions than short-term trade in my opinion.

NAM_INDIA Near Support areaNippon India Assest Management has formed a Rounding basing pattern and given a breakout .
Currently price is trading near Support zone and breakout area.
Pattern base range target plotted on chart.
We can also see that previous resistance currently acting as support.
Chart share here is for e

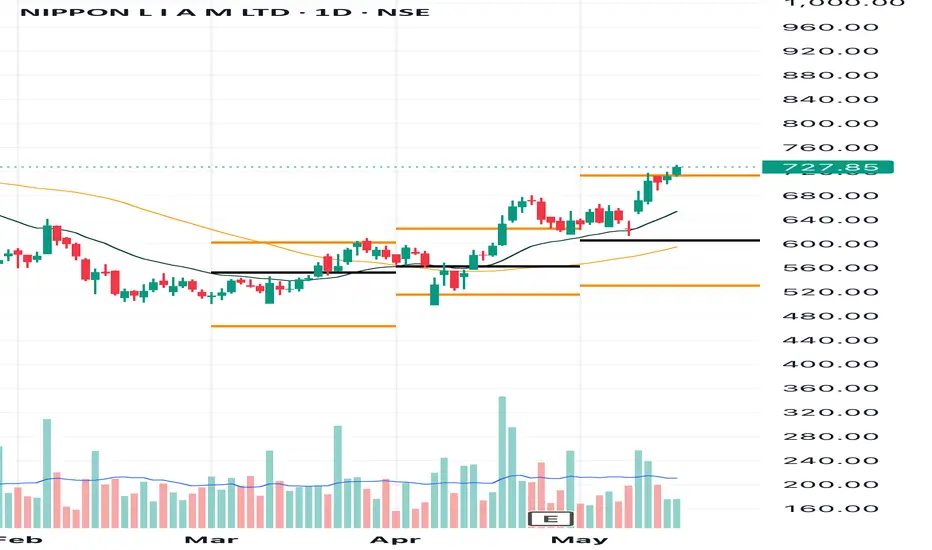
NAM India looks good in range 735-744 NAM India in trading around 750 in a support range so it can be added in range 735-745 with a stoploss around 710 levels for target of 768++ 785+++ 820+++ and so on

NAM INDIA BREAKOUT AND RETEST SETUP!!📊 Setup:
The stock has broken out of a consolidation zone and is now retesting the breakout level around ₹750.
• ✅ Entry:
Consider buying near ₹750 with signs of support.
• 🛑 Stop Loss:
Set a stop loss slightly below the retest level at ₹733.
• 🎯 Target:
Aim for a potential upside target of ₹800,

See all ideas
Summarizing what the indicators are suggesting.
Neutral
SellBuy
Strong sellStrong buy
Strong sellSellNeutralBuyStrong buy
Neutral
SellBuy
Strong sellStrong buy
Strong sellSellNeutralBuyStrong buy
Neutral
SellBuy
Strong sellStrong buy
Strong sellSellNeutralBuyStrong buy
An aggregate view of professional's ratings.
Neutral
SellBuy
Strong sellStrong buy
Strong sellSellNeutralBuyStrong buy
Neutral
SellBuy
Strong sellStrong buy
Strong sellSellNeutralBuyStrong buy
Neutral
SellBuy
Strong sellStrong buy
Strong sellSellNeutralBuyStrong buy
Displays a symbol's price movements over previous years to identify recurring trends.
Frequently Asked Questions
The current price of NAM_INDIA is 875.60 INR — it has increased by 0.01% in the past 24 hours. Watch Nippon Life India Asset Management Ltd. stock price performance more closely on the chart.
Depending on the exchange, the stock ticker may vary. For instance, on NSE exchange Nippon Life India Asset Management Ltd. stocks are traded under the ticker NAM_INDIA.
NAM_INDIA stock has fallen by −1.06% compared to the previous week, the month change is a 0.64% rise, over the last year Nippon Life India Asset Management Ltd. has showed a 25.64% increase.
We've gathered analysts' opinions on Nippon Life India Asset Management Ltd. future price: according to them, NAM_INDIA price has a max estimate of 1,090.00 INR and a min estimate of 740.00 INR. Watch NAM_INDIA chart and read a more detailed Nippon Life India Asset Management Ltd. stock forecast: see what analysts think of Nippon Life India Asset Management Ltd. and suggest that you do with its stocks.
NAM_INDIA reached its all-time high on Oct 23, 2025 with the price of 987.35 INR, and its all-time low was 127.20 INR and was reached on Oct 5, 2018. View more price dynamics on NAM_INDIA chart.
See other stocks reaching their highest and lowest prices.
See other stocks reaching their highest and lowest prices.
NAM_INDIA stock is 1.81% volatile and has beta coefficient of 1.84. Track Nippon Life India Asset Management Ltd. stock price on the chart and check out the list of the most volatile stocks — is Nippon Life India Asset Management Ltd. there?
Today Nippon Life India Asset Management Ltd. has the market capitalization of 558.01 B, it has decreased by −0.61% over the last week.
Yes, you can track Nippon Life India Asset Management Ltd. financials in yearly and quarterly reports right on TradingView.
Nippon Life India Asset Management Ltd. is going to release the next earnings report on Feb 14, 2026. Keep track of upcoming events with our Earnings Calendar.
Nippon Life India Asset Management Ltd. revenue for the last quarter amounts to 6.58 B INR, despite the estimated figure of 6.54 B INR. In the next quarter, revenue is expected to reach 6.68 B INR.
NAM_INDIA net income for the last quarter is 3.45 B INR, while the quarter before that showed 3.96 B INR of net income which accounts for −13.00% change. Track more Nippon Life India Asset Management Ltd. financial stats to get the full picture.
Nippon Life India Asset Management Ltd. dividend yield was 3.11% in 2024, and payout ratio reached 88.53%. The year before the numbers were 3.51% and 93.18% correspondingly. See high-dividend stocks and find more opportunities for your portfolio.
As of Nov 29, 2025, the company has 1.5 K employees. See our rating of the largest employees — is Nippon Life India Asset Management Ltd. on this list?
EBITDA measures a company's operating performance, its growth signifies an improvement in the efficiency of a company. Nippon Life India Asset Management Ltd. EBITDA is 17.83 B INR, and current EBITDA margin is 69.44%. See more stats in Nippon Life India Asset Management Ltd. financial statements.
Like other stocks, NAM_INDIA shares are traded on stock exchanges, e.g. Nasdaq, Nyse, Euronext, and the easiest way to buy them is through an online stock broker. To do this, you need to open an account and follow a broker's procedures, then start trading. You can trade Nippon Life India Asset Management Ltd. stock right from TradingView charts — choose your broker and connect to your account.
Investing in stocks requires a comprehensive research: you should carefully study all the available data, e.g. company's financials, related news, and its technical analysis. So Nippon Life India Asset Management Ltd. technincal analysis shows the buy rating today, and its 1 week rating is buy. Since market conditions are prone to changes, it's worth looking a bit further into the future — according to the 1 month rating Nippon Life India Asset Management Ltd. stock shows the buy signal. See more of Nippon Life India Asset Management Ltd. technicals for a more comprehensive analysis.
If you're still not sure, try looking for inspiration in our curated watchlists.
If you're still not sure, try looking for inspiration in our curated watchlists.