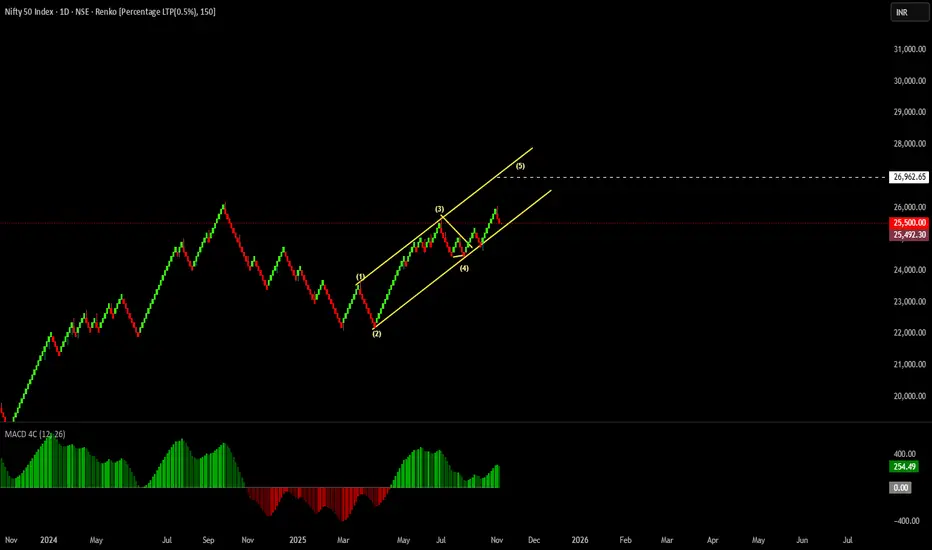
Noise Less Charting Method Friends I have made an visual representation of where the Nifty would be heading based on the
Method i follow as wave theory
Interesting to note the price is in the channel or representation of channel fits the price movement
Also You can note i have selected 0.50 % Box size in Ranko Bars , whi
About Nifty 50 Index
NIFTY 50 is the main index for the National Stock Exchange of India (NSE). It tracks the performance of the top 50 stocks by market capitalization from 13 sectors of the Indian economy. With such a relatively small number of companies within the index it still represents over 60% of the free float market capitalization of the stocks listed on NSE, and serves as a benchmark for fund portfolios and index funds. The list of the NIFTY 50 Index constituents is rescheduled every 6 month.
Related indices
Possible Nifty Resistance to supportMultiple bullish confluences in Nifty at current level is seen.
1. There is good resistance to support possible in Nifty nr ATH.
2. Good cup and handle pattern.
3. There is support nr weelky 20sma.
If nifty closes above Friday's high than it will trigger buy which can take nifty to 29000+ levels

Nifty - Weekly review Nov 10 to Nov 14Last week, the price fall down gradually. Friday took support at the 25280 - 25320 support zone.
Now the price has to sustain above the 25500 zone to move up. 25700 - 25720 can act as a resistance.
The daily chart also shows a similar support/resistance zone.
Buy above 25520 with the stop loss of

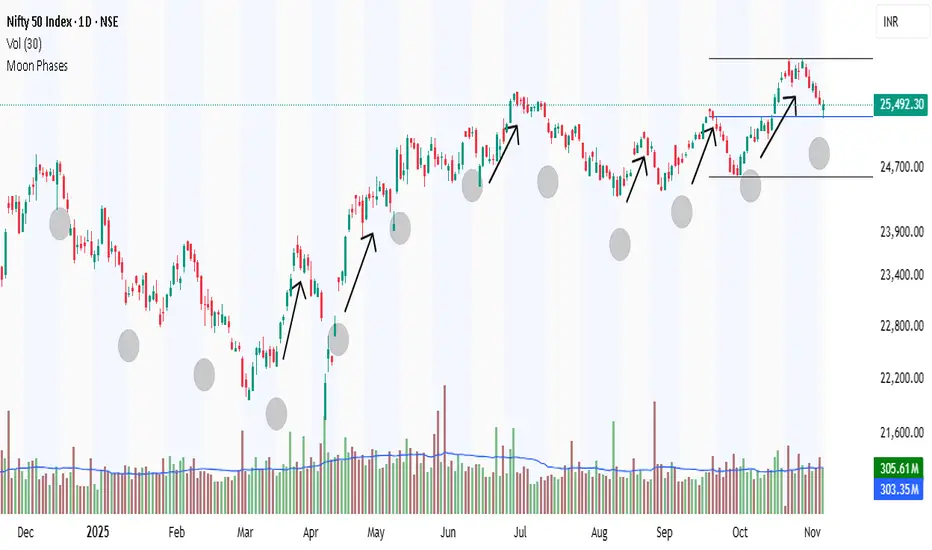
The Moon's phases are the changing mode (NIFTY)The Moon's phases are the changing shapes of the Moon's illuminated portion as seen from Earth, caused by its orbit around our planet. The Sun always lights half of the Moon, but our view of that lit half varies over a cycle lasting about 29.5 days (a synodic month). There are eight primary phases,
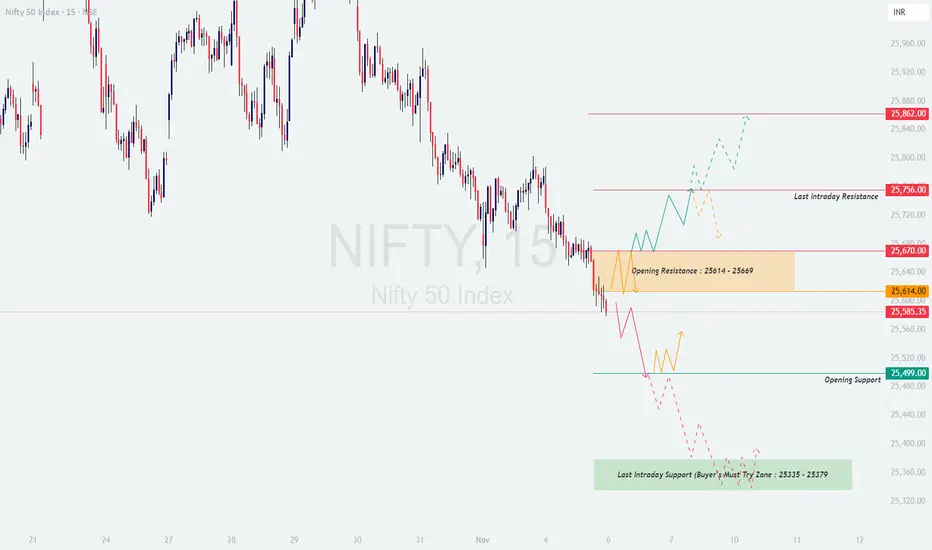
NIFTY : Trading levels and plan for 05-Nov-2025🔹 NIFTY Trading Plan for 05-Nov-2025
(Based on psychological correction theory & intraday structural behavior)
Chart Reference Levels:
🟧 Opening Resistance Zone: 25,614 – 25,669
🟥 Last Intraday Resistance: 25,756
🟩 Opening Support: 25,499
🟢 Last Intraday Support (Buyers’ Must-Try Zone): 25,335 –
Does Nifty is really bullish?cpr: narrow+decending cpr.
OI : today highest oi.
1.support:25400, 25300.
2.Resistance:25600,25700.
FII:4581bought.
DII:6674bought.
conclusion:
1.Nifty is not clearly in uptrend but it can go upto 200ma(25749) in 15min chart.
2.In 15min chart nifty can take support in cpr,20ma,50ma.
Disclam

Nifty view for November 2025.In this video, we analyze the technical and market indicators pointing to a strong rally in the Nifty index over the coming weeks. With bullish momentum building, investors can expect fresh upside levels and potential breakout zones. Stay tuned for key support and resistance levels, expert insights,

Nifty - What next?The price took support from the 25780 zone and moved up. 25780 is the strong support zone as of now. If the price opens with a gap down and shows bullish strength at 25780 zone, then it can move towards 26k. Or if the price opens flat, then buy above 25920 with the stop loss of 25870 for the targets

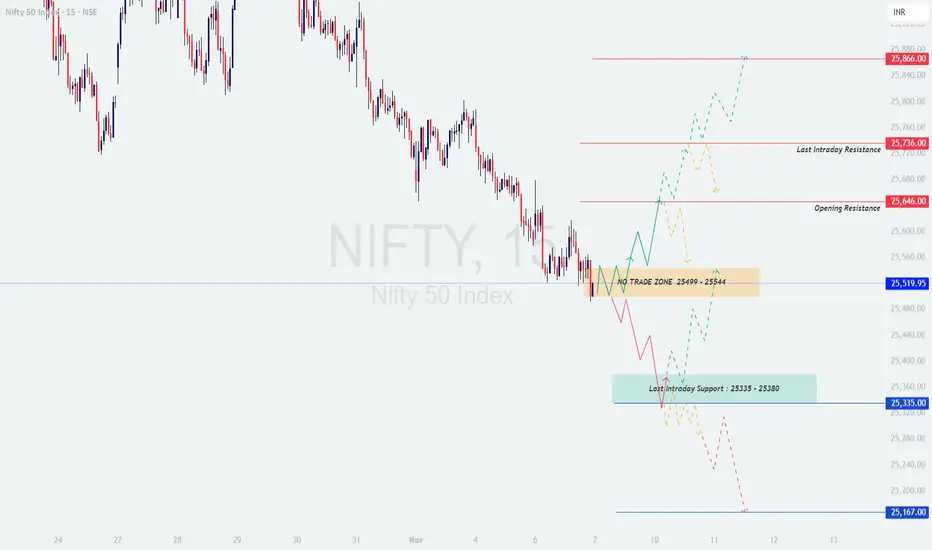
NIFTY : Trading levels and Plan for 07-Nov-2025📊 NIFTY TRADING PLAN — 07 NOV 2025
(Timeframe Reference: 15-Min Chart)
Chart Summary:
Nifty is currently trading near the 25,520 zone, which lies just below the identified Opening Resistance (25,646) and slightly above the No-Trade Zone (25,449 – 25,544) . The index remains range-bound, but
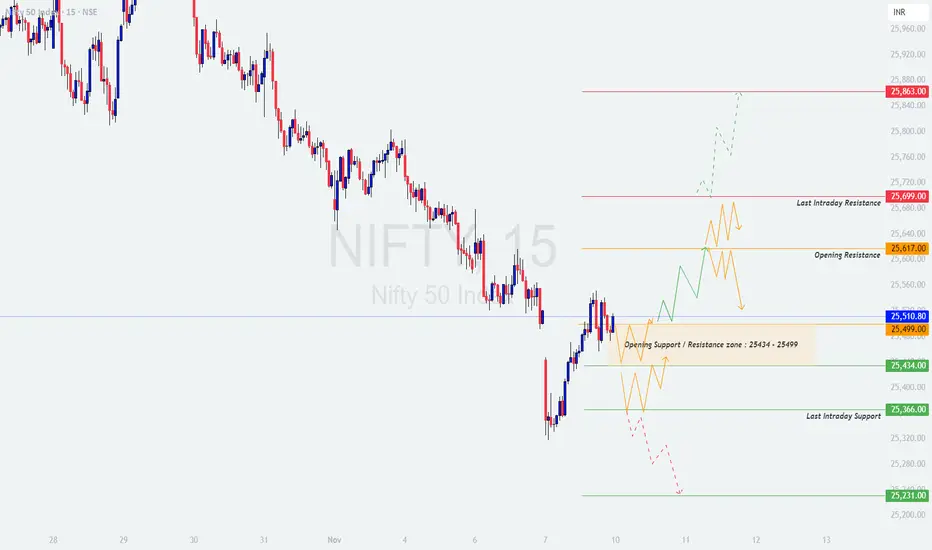
NIFTY - Trading levels and Plan for 10-Nov-2025📊 NIFTY TRADING PLAN — 10 NOV 2025
(Timeframe Reference: 15-Min Chart)
Chart Summary:
Nifty is currently trading around the 25,510 zone, situated right near the Opening Support / Resistance Zone (25,434 – 25,499) . The market structure shows a short-term base building, with the index now osci
See all ideas
Summarizing what the indicators are suggesting.
Oscillators
Neutral
SellBuy
Strong sellStrong buy
Strong sellSellNeutralBuyStrong buy
Oscillators
Neutral
SellBuy
Strong sellStrong buy
Strong sellSellNeutralBuyStrong buy
Summary
Neutral
SellBuy
Strong sellStrong buy
Strong sellSellNeutralBuyStrong buy
Summary
Neutral
SellBuy
Strong sellStrong buy
Strong sellSellNeutralBuyStrong buy
Summary
Neutral
SellBuy
Strong sellStrong buy
Strong sellSellNeutralBuyStrong buy
Moving Averages
Neutral
SellBuy
Strong sellStrong buy
Strong sellSellNeutralBuyStrong buy
Moving Averages
Neutral
SellBuy
Strong sellStrong buy
Strong sellSellNeutralBuyStrong buy
Displays a symbol's price movements over previous years to identify recurring trends.
Frequently Asked Questions
The current value of Nifty 50 Index is 25,875.80 INR — it has risen by 0.70% in the past 24 hours. Track the index more closely on the Nifty 50 Index chart.
Nifty 50 Index reached its highest quote on Sep 27, 2024 — 26,277.35 INR. See more data on the Nifty 50 Index chart.
The lowest ever quote of Nifty 50 Index is 279.00 INR. It was reached on Jul 3, 1990. See more data on the Nifty 50 Index chart.
Nifty 50 Index value has increased by 0.51% in the past week, since last month it has shown a 2.77% increase, and over the year it's increased by 6.81%. Keep track of all changes on the Nifty 50 Index chart.
The top companies of Nifty 50 Index are NSE:RELIANCE, NSE:HDFCBANK, and NSE:BHARTIARTL — they can boast market cap of 227.71 B INR, 171.02 B INR, and 130.14 B INR accordingly.
The highest-priced instruments on Nifty 50 Index are NSE:MARUTI, NSE:ULTRACEMCO, and NSE:BAJAJ_AUTO — they'll cost you 15,696.00 INR, 11,921.00 INR, and 8,868.00 INR accordingly.
The champion of Nifty 50 Index is NSE:BAJFINANCE — it's gained 48.58% over the year.
The weakest component of Nifty 50 Index is NSE:TRENT — it's lost −32.89% over the year.
Nifty 50 Index is just a number that lets you track performance of the instruments comprising the index, so you can't invest in it directly. But you can buy Nifty 50 Index futures or funds or invest in its components.
The Nifty 50 Index is comprised of 50 instruments including NSE:RELIANCE, NSE:HDFCBANK, NSE:BHARTIARTL and others. See the full list of Nifty 50 Index components to find more opportunities.