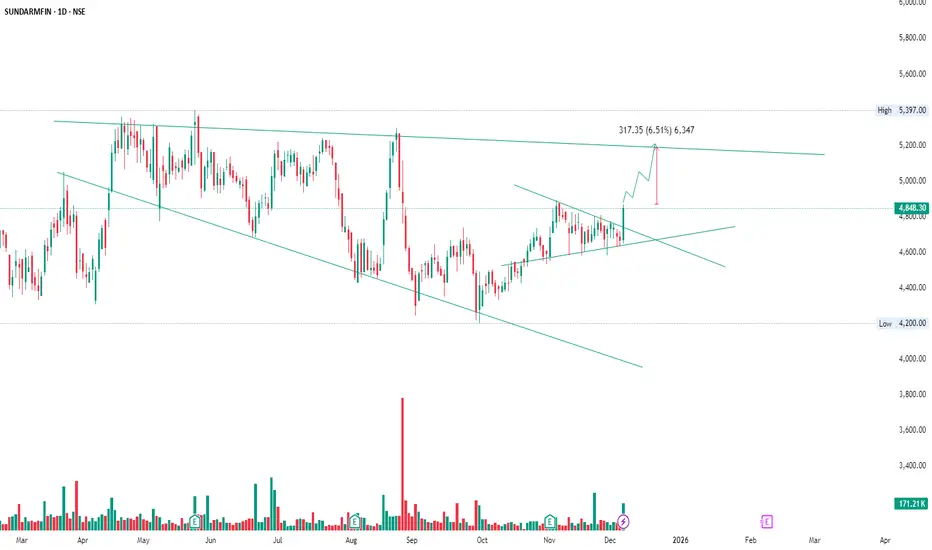
SUNDARMFIN – Breakout Retest Setup Toward Major TrendlineSUNDARMFIN has broken out of the falling wedge and is retesting the breakout zone successfully.
The structure drawn shows a bullish continuation setup:
Falling wedge breakout ✔️
Price holding above the retest zone ✔️
Momentum shifting higher ✔️
The upside projection points toward the major resi
Next report date
—
Report period
—
EPS estimate
—
Revenue estimate
—
178.90 INR
18.79 B INR
84.56 B INR
69.54 M
About Sundaram Finance Limited
Sector
Industry
CEO
Rajiv Chellappa Lochan
Website
Headquarters
Chennai
Founded
1954
ISIN
INE660A01013
FIGI
BBG000QBQF86
Sundaram Finance Ltd. engages in the provision of financial services for the purchase of commercial vehicles and passenger cars. It operates through the Asset Financing and Other Operations segments. The firm offers deposits, car finance, commercial vehicle finance, tire finance, farm equipment finance, and fleet cards. The company was founded by T. S. Santhanam on August 11, 1954 and is headquartered in Chennai, India.
Related stocks
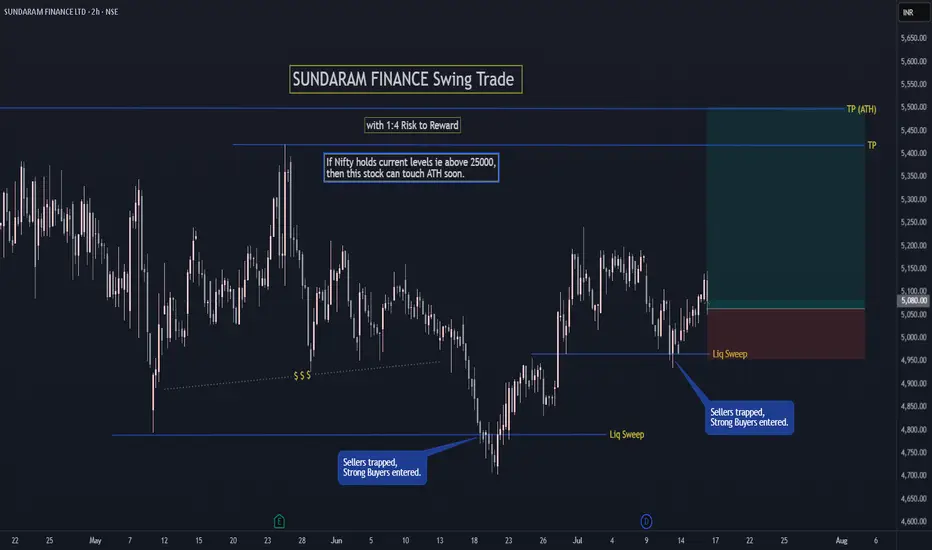
SUNDARAM FINANCE Swing TradeIf Nifty holds current levels ie above 25000,
then SUNDARAM FINANCE can touch ATH soon.
FOLLOW for more such simple swing setups.
Let me know in comments if you have any doubt or questions.
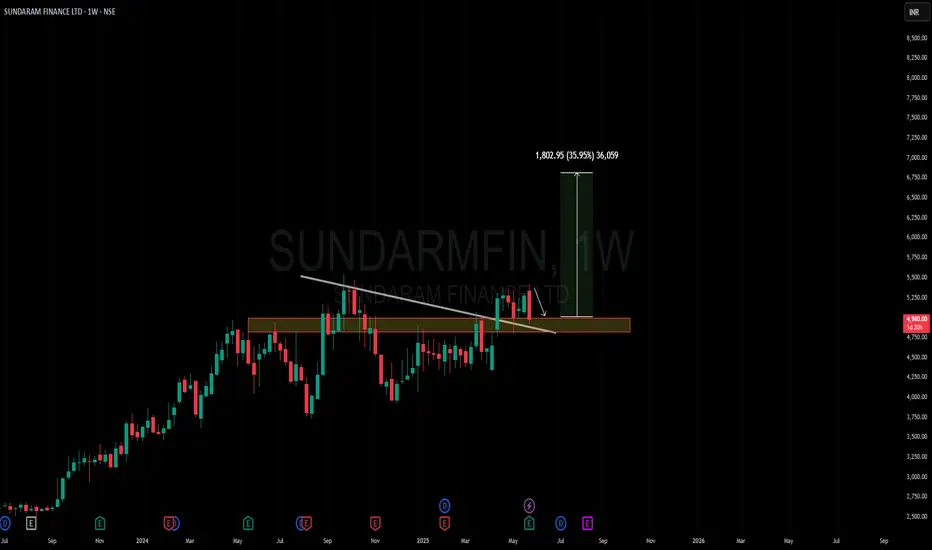
Amazing breakout on WEEKLY Timeframe - SUNDARMFINCheckout an amazing breakout happened in the stock in Weekly timeframe, macroscopically seen in Daily timeframe. Having a great favor that the stock might be bullish expecting a staggering returns of minimum 25% TGT. IMPORTANT BREAKOUT LEVELS ARE ALWAYS RESPECTED!
NOTE for learners: Place the break
Sundaram Finance Ltd - February 18 Projection UpdateBullish Scenario (Breakout Above ₹4725)
If price sustains above ₹4725, it can move toward ₹4760 → ₹4785 → ₹4815.
A confirmed breakout above ₹4965 would indicate a strong bullish trend.
CMP: ₹4741 (as per the chart)
Bullish Scenario (Breakout Above ₹4725) - Holding Above This Level
If price sustai

#SUNDARMFINFundamentals:
* ROCE - 9.2%, ROE - 14.2%. Debt to Equity - 4.5 (Financial companies use debt as their inventory)
* EPS / Revenue - has been steadily increasing
* FIIs - Have marginally increased holding from 18.42% to 18.61% which it is high.
* Retail holding levels have gone down marginally
* Promo

Sundaram Finance Ltd - Technical & Fundamental AnalysisFundamental Analysis
1. Financial Performance (Q3 FY2024-25)
Total Income: ₹2,207.35 crore (+20.75% YoY)
Net Profit After Tax: ₹451.18 crore
EPS: ₹143.50
Return on Equity (ROE): 12.52%
P/E Ratio: 31.80 (Moderate valuation compared to sector peers)
Dividend Yield: 0.66%
Market Cap: ₹50,7

SundarMfinStock Opportunity --> Sundaram Finance Limited
Symbol: #SUNDARMFIN
Entry Level: Above €4,650
Target: 4,900 | *5,165
Stop-Loss: 4,530
Technical Setup: Suddenly volume increase and start forming big candles at 1
hour time frame.

Sundaram Finance | Double Bottom | Market Structure Breakout Sundaram Finance
Reasons for Breakout
1) Market Structure Breakout forming higher highs and higher lows
2) Trying to fill the gapup
3) Formation of "W" at the bottom

Sundarmfin Breaking OutNSE:SUNDARMFIN today broke out with RSI and MACD showing Buy Signal. Major Support and Resistance are shown on charts
📌Thank you for exploring my idea! I hope you found it valuable.
🙏FLLOW for more
👍BOOST if useful
✍️COMMENT Below your views.
Meanwhile, check out my other stock ideas below unti

Sundaram Finance Ltd. Chart Analysis The technical analysis of **Sundaram Finance Ltd.** using multiple indicators and features, including **Heikin Ashi candles**, **ATR trailing stops**, **support and resistance levels**, and various oscillators like **MACD** and **RSI**. Here is a detailed breakdown of the key observations:
---
###

See all ideas
Summarizing what the indicators are suggesting.
Neutral
SellBuy
Strong sellStrong buy
Strong sellSellNeutralBuyStrong buy
Neutral
SellBuy
Strong sellStrong buy
Strong sellSellNeutralBuyStrong buy
Neutral
SellBuy
Strong sellStrong buy
Strong sellSellNeutralBuyStrong buy
An aggregate view of professional's ratings.
Neutral
SellBuy
Strong sellStrong buy
Strong sellSellNeutralBuyStrong buy
Neutral
SellBuy
Strong sellStrong buy
Strong sellSellNeutralBuyStrong buy
Neutral
SellBuy
Strong sellStrong buy
Strong sellSellNeutralBuyStrong buy
Displays a symbol's price movements over previous years to identify recurring trends.
S
717SHFL30.N0
Sundaram Home Finance Ltd. 7.17% 25-JUN-2030Yield to maturity
—
Maturity date
Jun 25, 2030
S
79123SHF26.N0
Sundaram Home Finance Ltd. 7.9123% 27-NOV-2026Yield to maturity
—
Maturity date
Nov 27, 2026
S
765SHFL29.N0
Sundaram Home Finance Ltd. 7.65% 29-OCT-2029Yield to maturity
—
Maturity date
Oct 29, 2029
S
815SHFL25.N0
Sundaram Home Finance Ltd. 8.15% 19-DEC-2025Yield to maturity
—
Maturity date
Dec 19, 2025
See all SUNDARMFIN bonds
EEDM
iShares IV PLC - iShares MSCI EM CTB Enhanced ESG UCITS ETF Unhedged USDWeight
0.15%
Market value
12.92 M
USD
EDM2
iShares IV PLC - iShares MSCI EM CTB Enhanced ESG UCITS ETF Accum Shs Unhedged USDWeight
0.15%
Market value
12.92 M
USD
Explore more ETFs
Frequently Asked Questions
The current price of SUNDARMFIN is 4,848.30 INR — it has increased by 3.87% in the past 24 hours. Watch Sundaram Finance Limited stock price performance more closely on the chart.
Depending on the exchange, the stock ticker may vary. For instance, on NSE exchange Sundaram Finance Limited stocks are traded under the ticker SUNDARMFIN.
SUNDARMFIN stock has risen by 3.02% compared to the previous week, the month change is a 2.94% rise, over the last year Sundaram Finance Limited has showed a 17.28% increase.
We've gathered analysts' opinions on Sundaram Finance Limited future price: according to them, SUNDARMFIN price has a max estimate of 5,396.00 INR and a min estimate of 3,850.00 INR. Watch SUNDARMFIN chart and read a more detailed Sundaram Finance Limited stock forecast: see what analysts think of Sundaram Finance Limited and suggest that you do with its stocks.
SUNDARMFIN reached its all-time high on Sep 27, 2024 with the price of 5,535.85 INR, and its all-time low was 17.75 INR and was reached on Jul 13, 2001. View more price dynamics on SUNDARMFIN chart.
See other stocks reaching their highest and lowest prices.
See other stocks reaching their highest and lowest prices.
SUNDARMFIN stock is 4.78% volatile and has beta coefficient of 1.00. Track Sundaram Finance Limited stock price on the chart and check out the list of the most volatile stocks — is Sundaram Finance Limited there?
Today Sundaram Finance Limited has the market capitalization of 538.59 B, it has decreased by −0.50% over the last week.
Yes, you can track Sundaram Finance Limited financials in yearly and quarterly reports right on TradingView.
Sundaram Finance Limited is going to release the next earnings report on Feb 9, 2026. Keep track of upcoming events with our Earnings Calendar.
Sundaram Finance Limited revenue for the last quarter amounts to 9.17 B INR, despite the estimated figure of 9.45 B INR. In the next quarter, revenue is expected to reach 9.69 B INR.
SUNDARMFIN net income for the last quarter is 4.88 B INR, while the quarter before that showed 4.75 B INR of net income which accounts for 2.72% change. Track more Sundaram Finance Limited financial stats to get the full picture.
Sundaram Finance Limited dividend yield was 0.76% in 2024, and payout ratio reached 20.52%. The year before the numbers were 0.73% and 23.02% correspondingly. See high-dividend stocks and find more opportunities for your portfolio.
As of Dec 7, 2025, the company has 6.89 K employees. See our rating of the largest employees — is Sundaram Finance Limited on this list?
EBITDA measures a company's operating performance, its growth signifies an improvement in the efficiency of a company. Sundaram Finance Limited EBITDA is 32.37 B INR, and current EBITDA margin is 76.88%. See more stats in Sundaram Finance Limited financial statements.
Like other stocks, SUNDARMFIN shares are traded on stock exchanges, e.g. Nasdaq, Nyse, Euronext, and the easiest way to buy them is through an online stock broker. To do this, you need to open an account and follow a broker's procedures, then start trading. You can trade Sundaram Finance Limited stock right from TradingView charts — choose your broker and connect to your account.
Investing in stocks requires a comprehensive research: you should carefully study all the available data, e.g. company's financials, related news, and its technical analysis. So Sundaram Finance Limited technincal analysis shows the strong buy rating today, and its 1 week rating is strong buy. Since market conditions are prone to changes, it's worth looking a bit further into the future — according to the 1 month rating Sundaram Finance Limited stock shows the strong buy signal. See more of Sundaram Finance Limited technicals for a more comprehensive analysis.
If you're still not sure, try looking for inspiration in our curated watchlists.
If you're still not sure, try looking for inspiration in our curated watchlists.