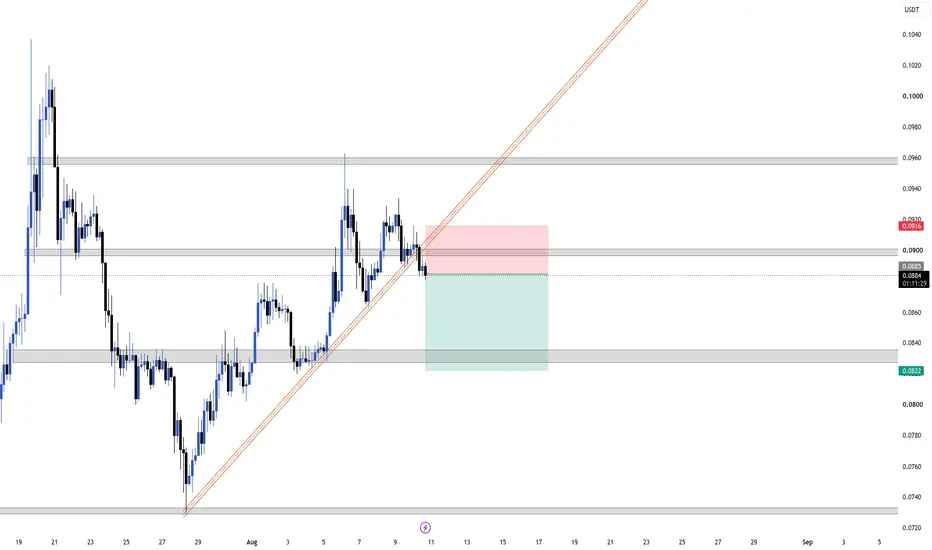
PI/USDT 4H — Bearish Rejection | Short SetupBearish setup forming on PI/USDT (4H).
🔴 Entry: 0.0883
🛑 Stop Loss: 0.0916
🎯 Take Profit: 0.0822
Setup:
• Price rejected the resistance zone around 0.0900–0.0915
• Rising trendline has been broken/rejected
• Looking for further downside toward the 0.0830 support zone
• Approx. 1:1.8 R:R
⚠️ This i
PIUSDT 4H – Inverse Head & Shoulders SetupThe market is forming a potential Inverse Head & Shoulders pattern on the 4H timeframe, right at a strong support zone.
Setup Details:
Pair: PIUSDT
Timeframe: 4H
Pattern: Inverse Head & Shoulders
Key Support Zone: 0.19 area
Neckline Resistance: ~0.21
Major Resistance: 0.27 – 0.30
Plan:
Price hol
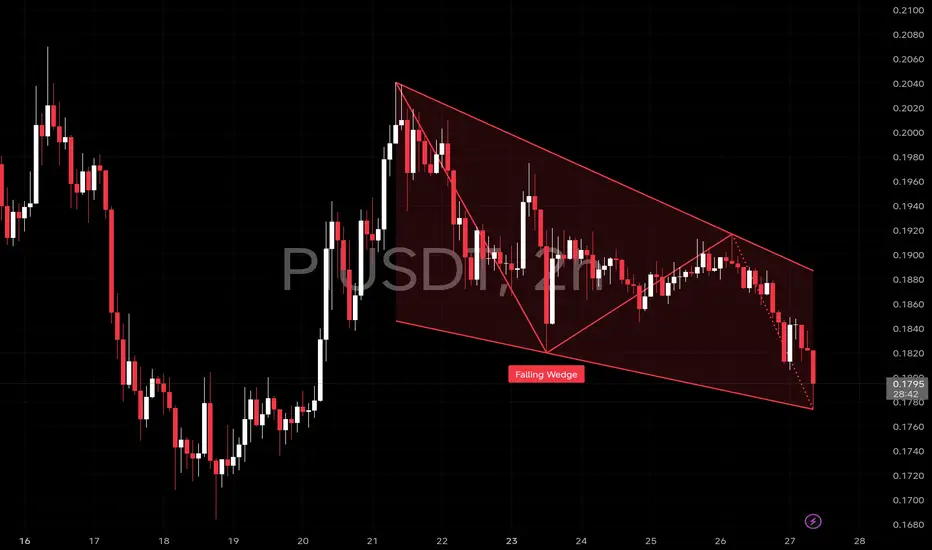
$PI just bounced from the lower wedge supportNASDAQ:PI just bounced from the lower wedge support, and buyers are stepping in right on time. This is exactly where smart money looks for reversals.
Price tapped the lower boundary of the falling wedge (~0.178–0.180) and instantly bounced, showing strong demand. Right now, #PI is attempting to re
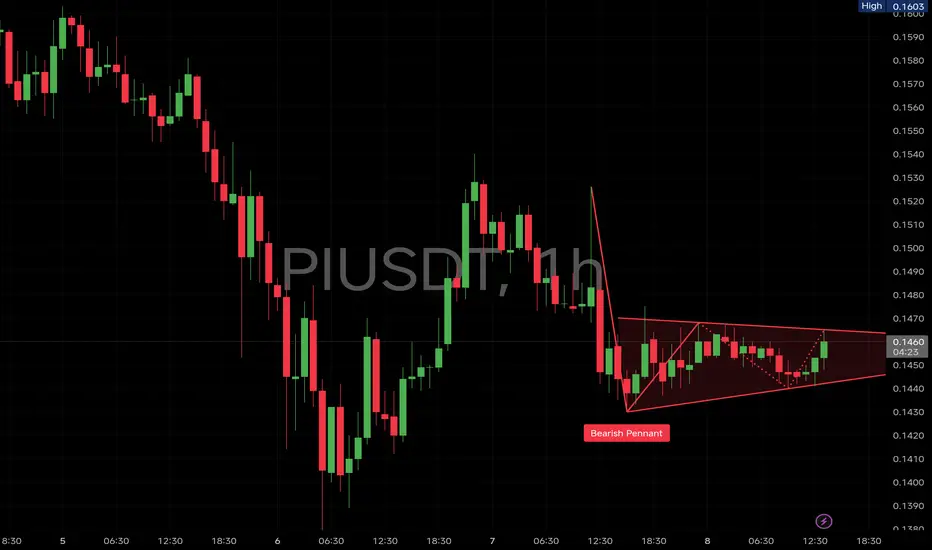
$PI saw a strong impulsive drop from the 0.152–0.153 regionNASDAQ:PI saw a strong impulsive drop from the 0.152–0.153 region, followed by a weak bounce and immediate loss of momentum. Since then, price has been moving sideways inside a tight bearish pennant, which usually signals continuation, not reversal.
The key detail here is acceptance. Price is stru
$PI forming a potential double-bottom — patience still keyNASDAQ:PI forming a potential double-bottom — patience still key ⏳
After the sharp rejection from the highs, price formed Bottom 1, bounced, and is now revisiting a similar zone to print Bottom 2. This is a classic area where the market decides whether buyers step back in or the range breaks down.
$PI is currently trading inside a tight triangle structure NASDAQ:PI is currently trading inside a tight triangle structure on the 1H chart, showing clear compression after the recent downside move. Price is making higher lows while facing consistent rejection near the upper trendline — a classic pressure-building setup. This kind of structure usually does
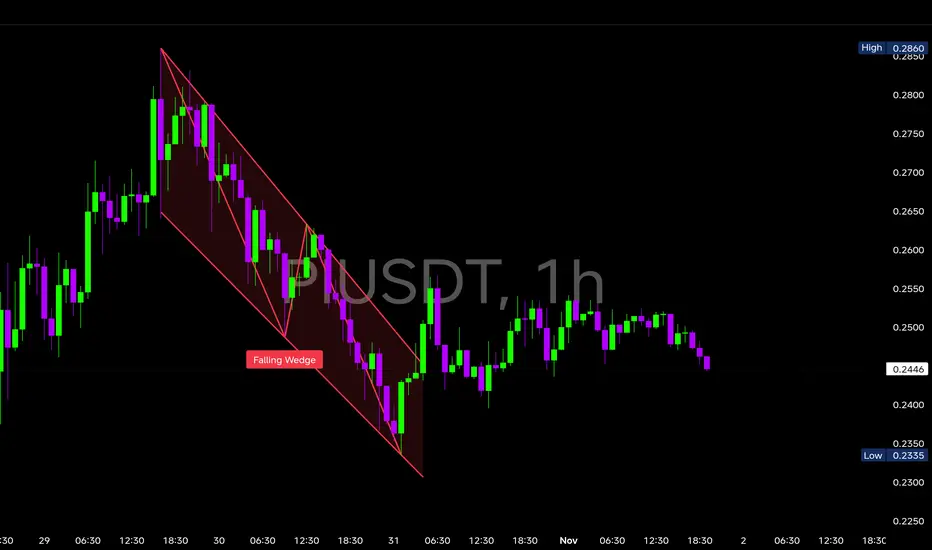
$PI is showing a Falling Wedge on the 1H chart NASDAQ:PI is showing a Falling Wedge on the 1H chart
🔹 Key Support Zones
$0.243 – $0.245: Wedge support zone (critical defense).
$0.235: Extended downside if pattern fails.
🔹 Resistance Zones
$0.252: Wedge breakout level.
$0.260: Next immediate resistance after breakout.
$0.275 – $0.280: T
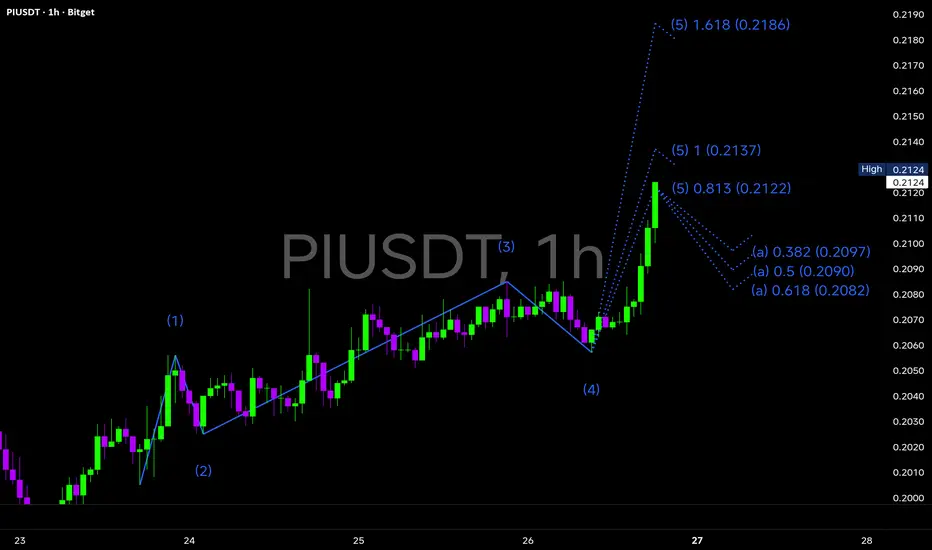
$PI is currently completing its 5-wave impulse structure NASDAQ:PI is currently completing its 5-wave impulse structure on the 1H chart — signaling the end of Wave (4) correction and the start of a potential explosive Wave (5) rally.
The structure clearly shows Wave (1) → (4) formation, with Wave (5) extension now active.
Immediate upside targets lie a
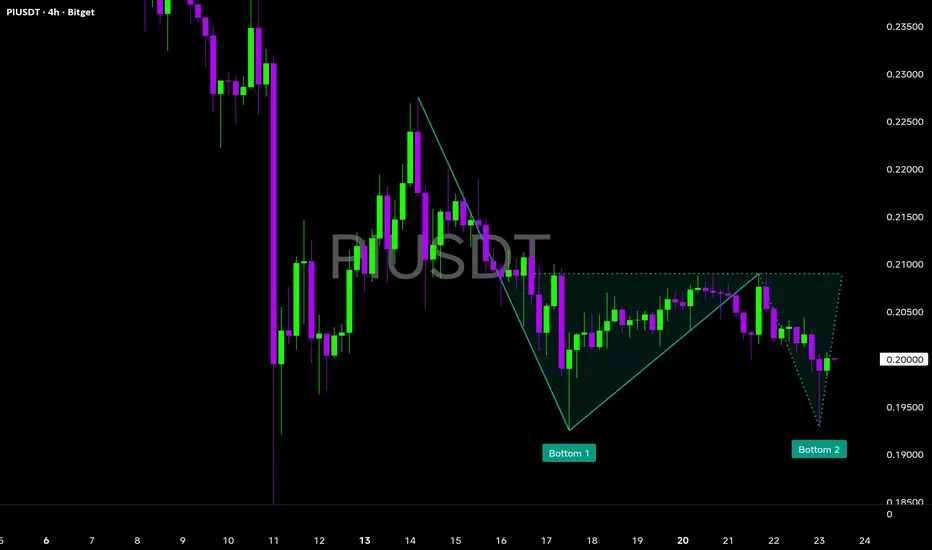
$PI forming a Potential Double Bottom Pattern!NASDAQ:PI forming a Potential Double Bottom Pattern! 📉
#PI is currently testing a crucial reversal zone after completing two symmetric dips near the $0.19–$0.20 support — hinting at a possible double bottom formation.
🔸Bottom 1: Formed near $0.193, marking the first major support test.
🔹Bottom 2
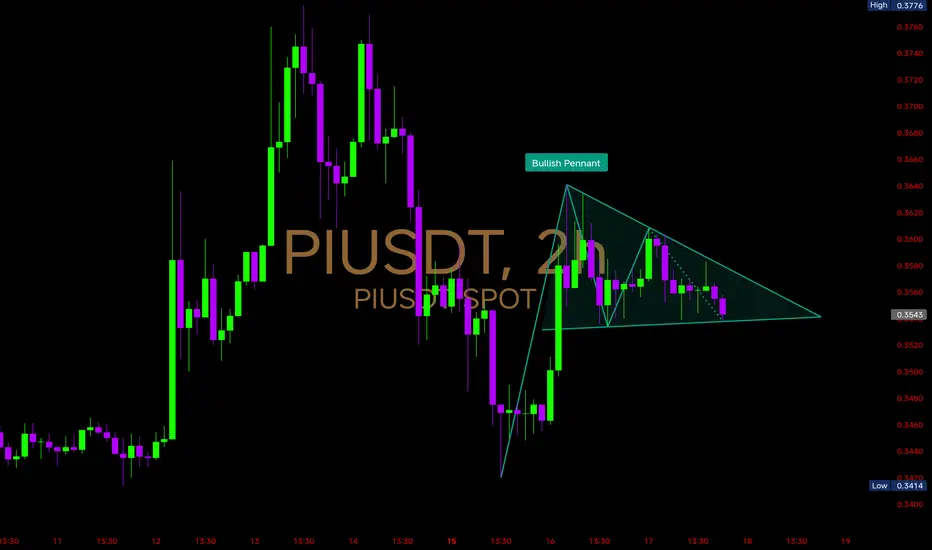
$PI is coiling inside a Bullish PennantNASDAQ:PI is coiling inside a Bullish Pennant, and the next move depends on whether bulls can break through $0.365 🚀
Support Zone: $0.341 – $0.345 (recent low & pennant base)
Resistance Zone: $0.360 – $0.365 (upper pennant trendline)
Breakout Trigger: A clean break above $0.365 could confirm th
See all ideas
Summarizing what the indicators are suggesting.
Oscillators
Neutral
Oscillators
Neutral
Summary
Neutral
Summary
Neutral
Summary
Neutral
Moving Averages
Neutral
Moving Averages
Neutral
Displays a symbol's price movements over previous years to identify recurring trends.