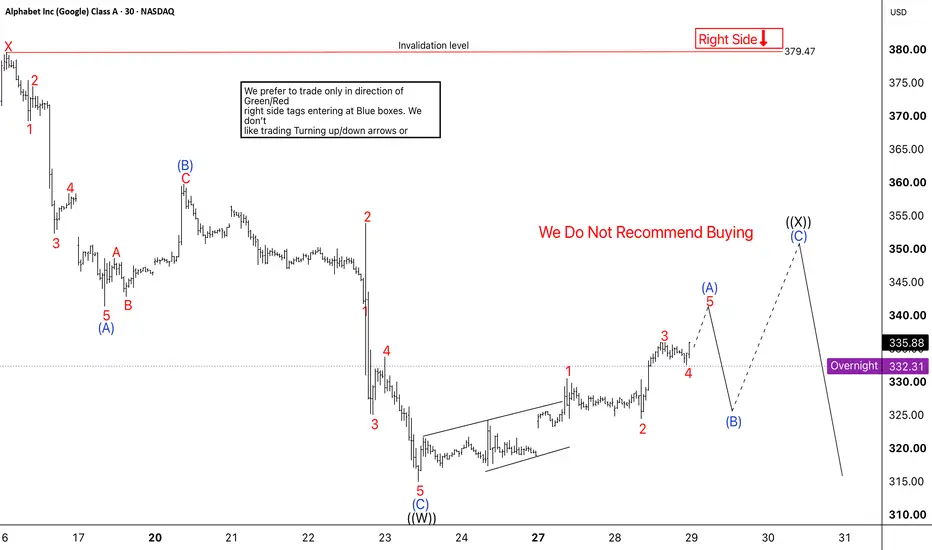
GOOGL Corrective Bounce Could Lead to Another Leg Lower Google (GOOGL) continues to trade within a corrective Elliott Wave structure after completing wave (C) of (W) near 312. The stock has since turned higher and appears to be developing a corrective recovery. The current structure suggests that GOOGL may continue higher in wave (A), with wave 5 still expected to complete the first leg of the bounce. After that, we expect a pullback in wave (B), which should unfold in at least three swings. Once wave (B) completes, GOOGL could turn higher again in w
Alphabet Inc (Google) Class C
No trades
No trades
In-depth trading ideas
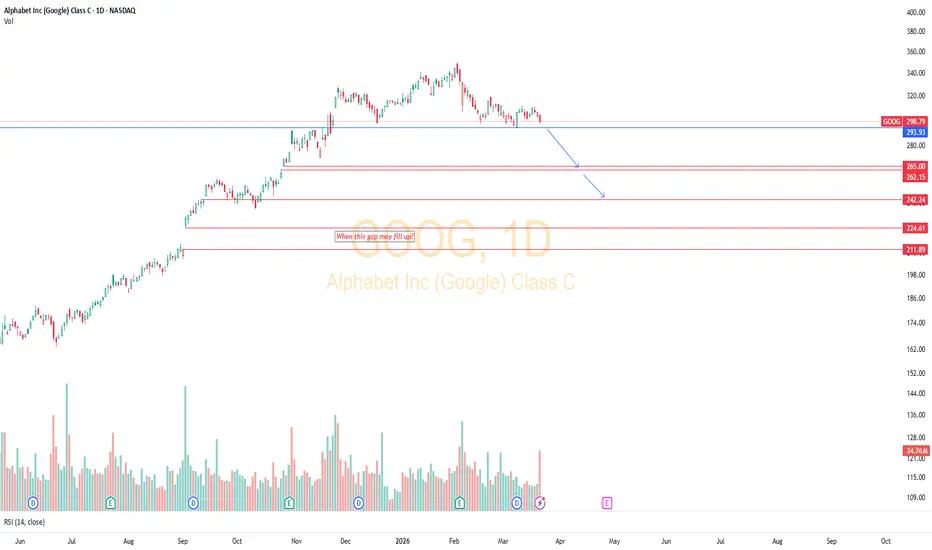
GooGSince 14th Apr 2025 there has been non-stop rally until Jan 2026. Only in Feb 2026 it has shown profit booking and the only reason for this selling is due to high disparity whicch has impacted means price reversal.
below 294 closing basis it may try to hit 271 and after the bounce the second fall may come into affect. Later price may stabilize around 241
However I have concern for the gap formed between 2nd sep 2025-3rd Sep 2025 for price range of 211-232 which is important to get filled.
one
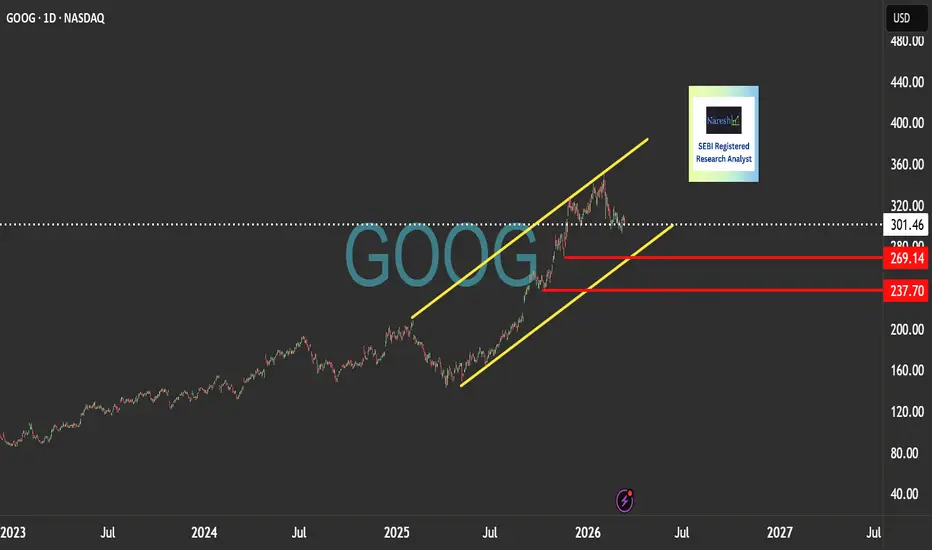
GOOGLE - War effect - Buy or Sell ?GOOGLE
LTP $ 301.46
💡 If you liked the idea, don’t forget to Boost 🚀
Your comments and views are always most welcome.
Aggressive Traders
Add on dips till 280
SL CLB 269
Expected Up moves 325/350 & Fresh ATH
Conservative Traders
Add on dips till 270
SL CLB 237
Expected Up moves 325/350 & Fresh ATH
For more market insights & structured trade ideas,
📲 Visit my profile and hit Follow
Warm regards,
Naresh G
SEBI Registered Research Analyst
💬 Comment below if you want me to analyze an
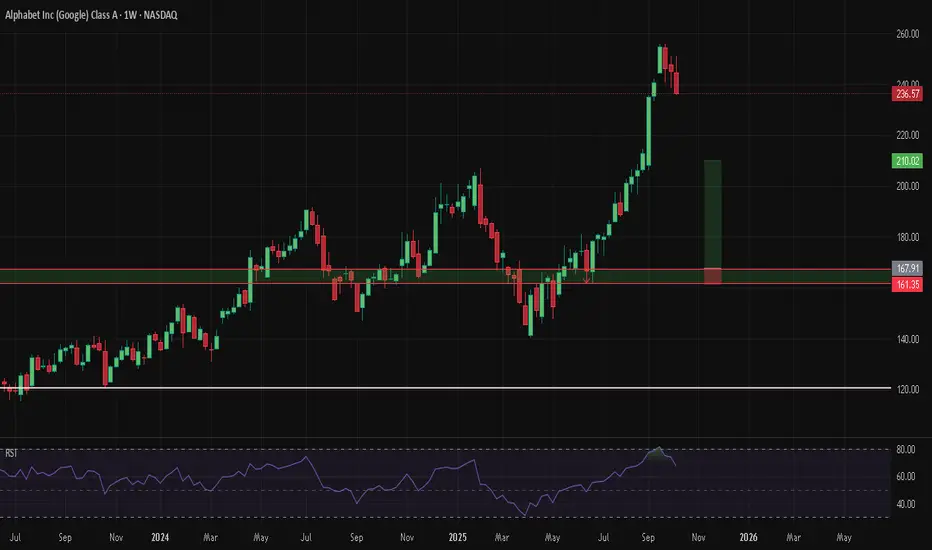
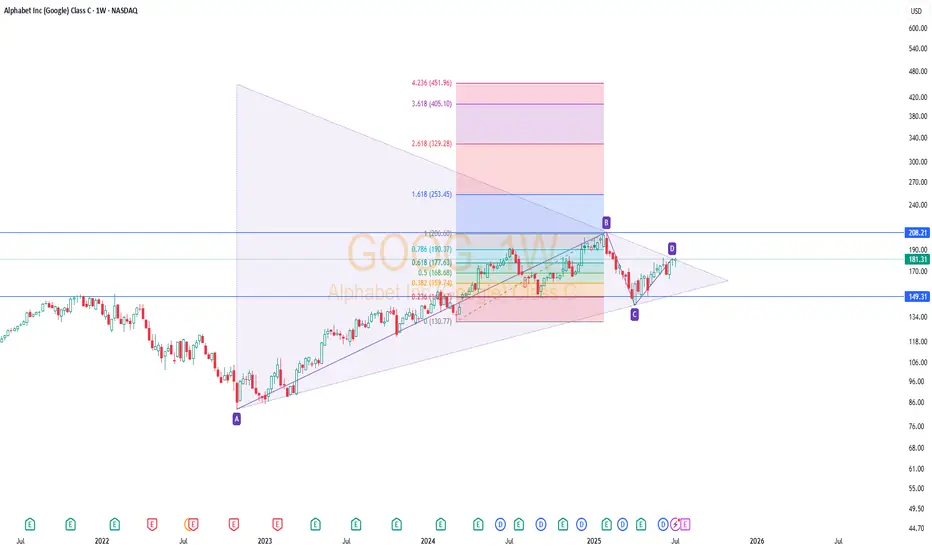
GOOG📊 NASDAQ:GOOG Weekly Chart | CMP: $180
🔺 Triangle breakout still pending
🕵️♂️ Watching closely near key levels
📈 Range:
▪️High: $206.56 (Feb 2025)
▪️Low: $140.36 (Apr 2025)
📉 Stop Loss: $150
🎯 Target: $300 in 12–18 months
Breakout confirmation could open strong upside potential.
#GOOG #Alphabet #Stocks #TechnicalAnalysis #Investing
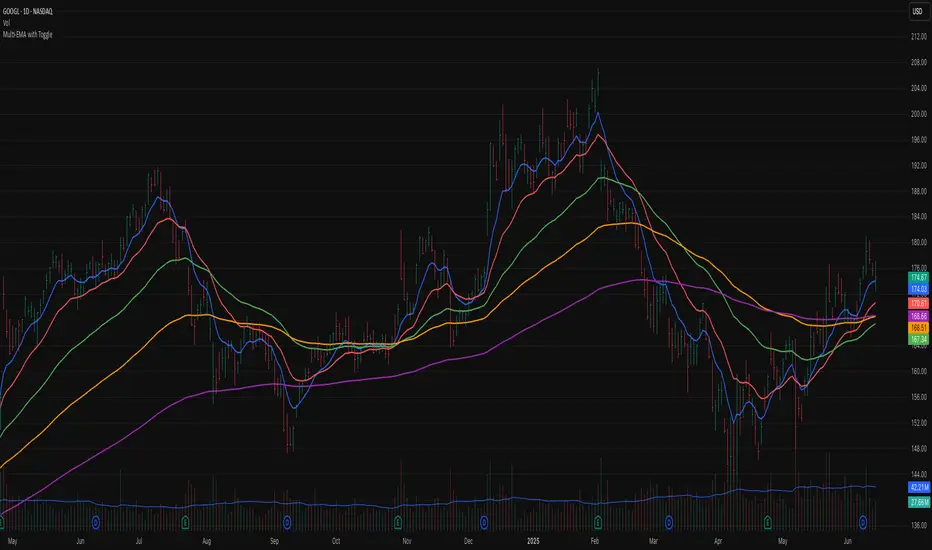
Multi-EMA Toggle Indicator A clean and versatile Exponential Moving Average (EMA) indicator featuring 5 fully customizable EMAs with individual toggle controls. Perfect for traders who want flexibility in their moving average analysis without cluttering their charts.
Key Features
✅ 5 Independent EMAs - Each with its own settings and controls
✅ Toggle On/Off - Show only the EMAs you need
✅ Customizable Periods - Set any period for each EMA
✅ Color Selection - Choose distinct colors for easy identification
✅ Clean Interface
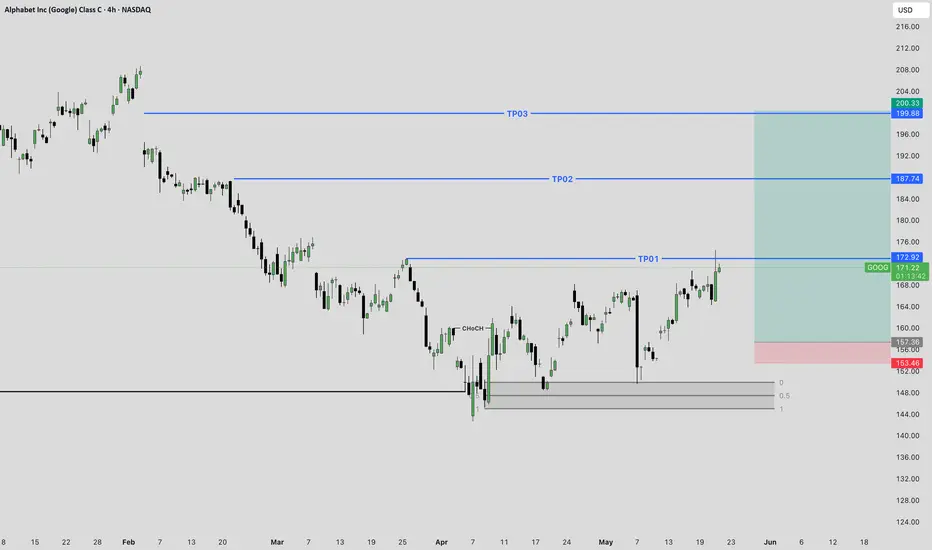
GOOG: Don't Miss This Potential Reversal!GOOG Long Idea
Chart Analysis:
The chart shows Alphabet Inc. (GOOG) on a 4-hour timeframe. After a period of decline from its highs, GOOG appears to be finding support around the "Weekly Liquidity" level. There's also a recent bullish impulse from this area, breaking above some minor resistance. The chart identifies three potential "TP" (Take Profit) levels.
Trading Idea:
Entry: Look for a sustained move above the TP01 level ($172.92) or a clear retest and bounce from the current pric
Google: A compelling buy at the current priceHello,
As Warren Buffett famously said, "Be fearful when others are greedy, and greedy when others are fearful." This mindset is particularly relevant right now with Alphabet Inc.
Despite being a company whose products we use daily—and will likely rely on even more in the future—Alphabet's stock recently declined following comments from Apple’s Eddie Cue regarding a drop in Safari search traffic. This has sparked concerns about Google's dominance in search and its ad revenue streams. Analysts
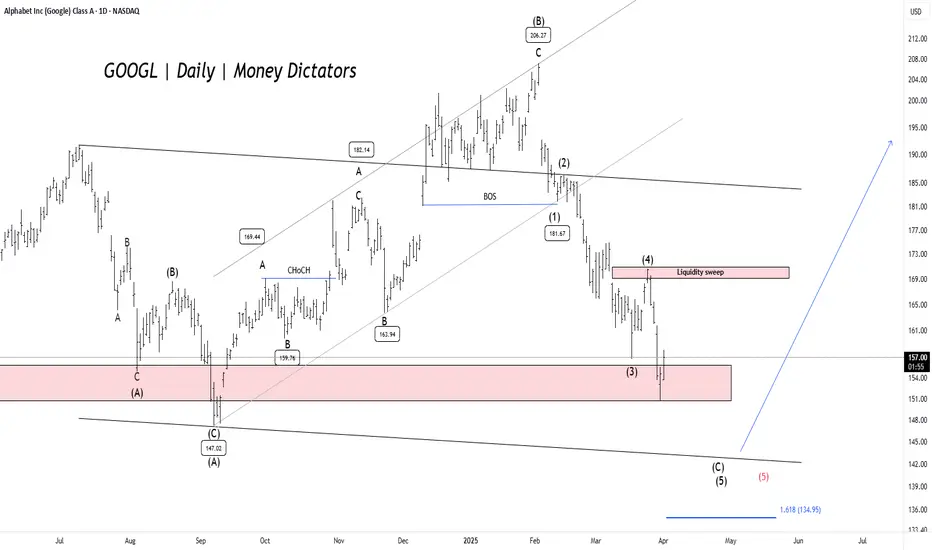
GOOGL - Elliott Wave Final ShowdownGOOGL has dropped over 27.28% , reaching a minor profit-booking zone. The $150 level serves as a key demand zone, where a potential price reversal could occur. The formation is either expanded flat or a running flat on the daily timeframe chart.
Confirmation is best observed near the lower trendline of the parallel channel. If bearish momentum persists, prices may decline further to the $142-$140 range before a strong rebound. Once the correction ends, the upside targets are $168, $180,
I believe GOOGL will be $260 around June2025This chart looks bullish if ES and SPY continue to chug steadily higher.
I said last year that we were entering a 3-4 year bull market, but most still worried about the "impending crash" - which never happened.
Japan wasn't even really a crash either and we recovered all that in weeks.
So that being said, NASDAQ:META NASDAQ:TSLA NASDAQ:NVDA and Our GOOGL should all basically double from here.
That is all my opinion. I'm great at determining direction with precision and am able to
GOOGLE SETUP TRADE WIH 1:5 RISK REWARDGOOGLE SETUP TRADE WIH 1:5 RISK REWARD
A good BUYING setup detected on GOOG
It's showing a BULL MOVE due to these reason
1. It's following THE 30 M trendline here
2. It's ready to break the neckline
3. it forming a accending triangle pattern over here
Just grab out will your own risk
4. also in day chat its showing its trying to break the trendline
it will consolidate here but after breakout the upcoming move will be OSM
With a small amount
Stay connected
Stay happy
It's showing a BULL MOVE due
Google Cup & Handle Pattern Google has formed Cup Handle Pattern on daily timeframe chart. This is bullish pattern, we can take swing trade here.
Entry:
We can go Long after close of bullish candle above the resistance zone as marked on chart.
Target:
Usually for Cup & Handle Pattern target is equal to the depth of cup, we are going to keep the target near the next resistance zone.
Stoploss:
We can keep the stoploss below the resistance zone.
Google Important Levels for Next weekwe can expect a positive move in Google stock next week. The next resistance level is at 112, which means that the stock price may face some resistance when reaching this level.
If the stock price is unable to sustain the 100.5 level, the immediate support level is at 90. This means that if the price falls below 100.5, there may be some buying interest at the 90 level, which could potentially prevent the stock from falling further.