NAS100 Squeeze High on hourly Timeframe possible sharp fall downNAS100 is currently in a squeeze-high zone on the hourly timeframe, which often signals a potential sharp move down, especially with upcoming Fed news. This squeeze-high pattern typically represents an accumulation phase before smart money decides to make a significant move. In this case, it indicat
Related indices

NASDAQ - Possible moves [Wave Theory]I'm not an expert of wave theory but I have an inclination towards it. Wave theory is nothing short of brilliance!
NASDAQ seem to have completed its 5 waves and now following the ABC retracement wave.
NASDAQ:NDX should now move to its B wave and show some bounce. It should be followed by furt

NASDAQ 100 : This is going to hurt Chart is self explanatory. Refer to marked S/R Zones
- Divergent RSI
- NNH (Net new highs) dropping fast
- Anticipatory shorts are riskier but can give a great entry.
Stop Loss - 25200 DCB

buybuy ideaPirce trend go up long term and short term last week 1h break structure pirce pull back go to 1h poi then buy

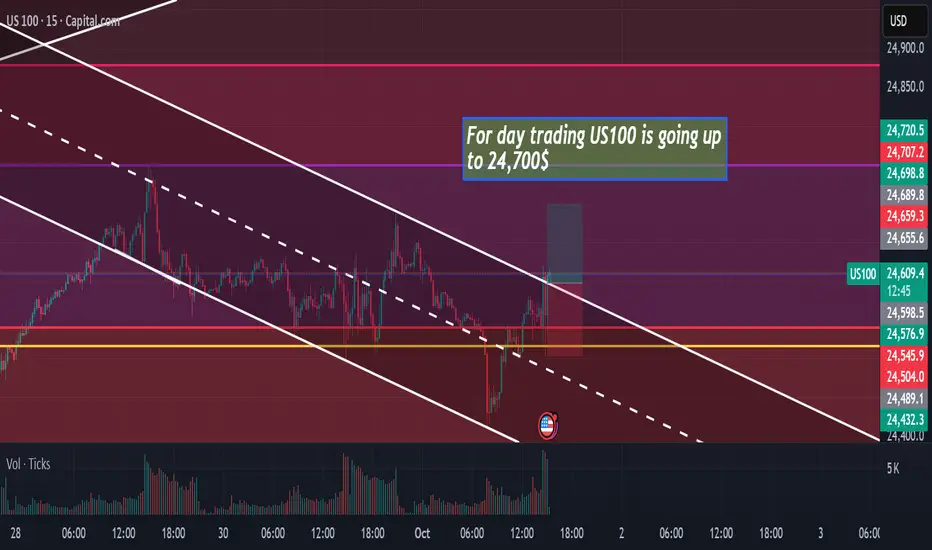
US100 is going UP TO 24,700$hello.
US100 is going up to 24,700$ in few minutes !! it's a buy opportunity on 15MIN time frame
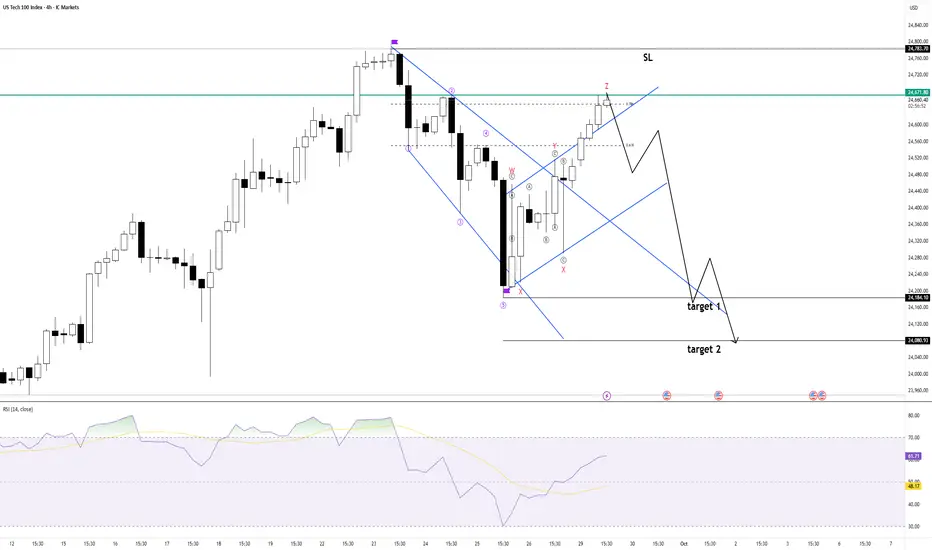
US Tech 100 in sellI see the good risk/reward ratio sell setup in US Tech 100 as elliot wave analysis. elliot wave analysis is very complex analysis method and it aways have alternate count, how ever i shorting US Tech 100 as it gives good risk/reward ratio.
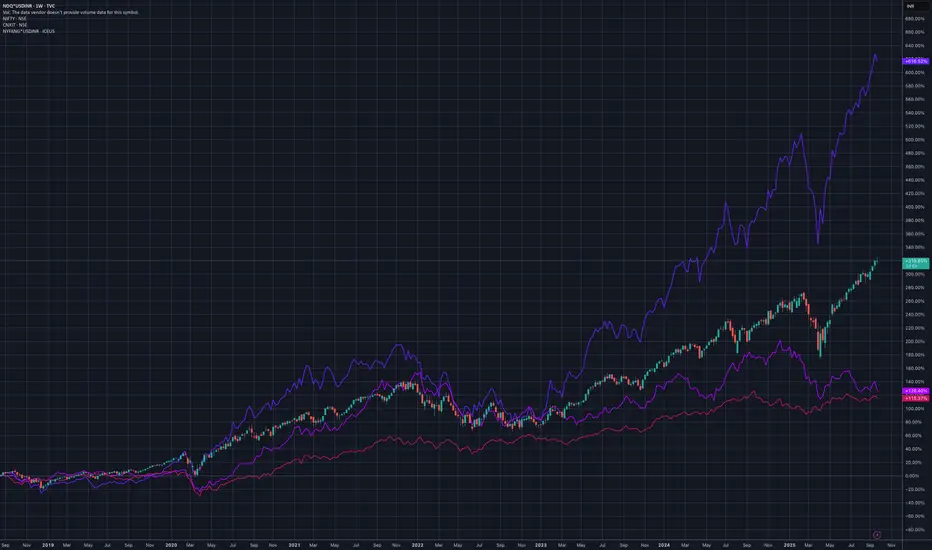
INR Adjusted NASDAQ 100 vs FANG+ vs NIFTY50 vs NIFTYITINR Adjusted NASDAQ 100 vs FANG+ vs NIFTY50 vs NIFTYIT
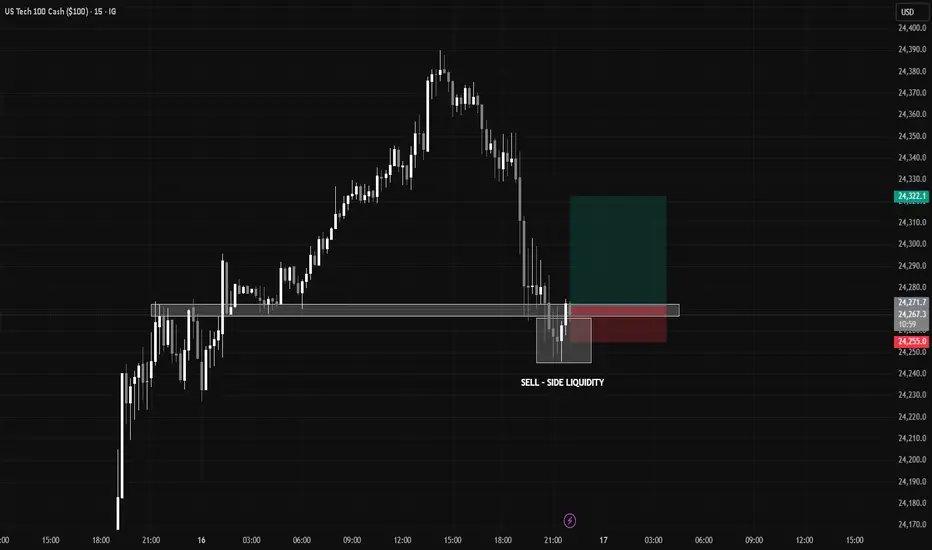
NQ-LONGSSELL-SIDE LIQUIDITY GRAB.
Lets see how liquidity sweep works. Perfect setup !!
Good 1:3 target
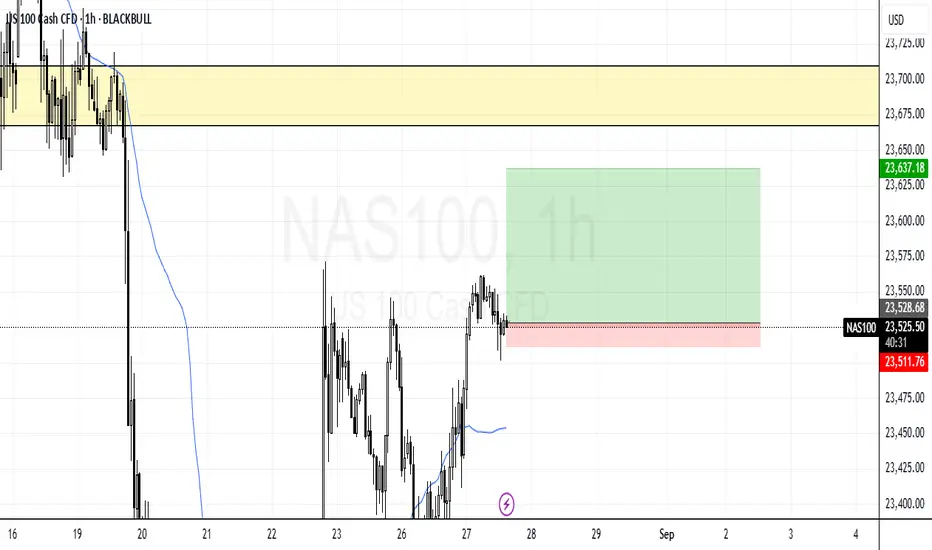
NAS100 Bearish Reversal from Supply Zone – Short SetupThe NAS100 (1H chart) is trading within a channel structure marked by a rejection line (resistance) and a support line. Price recently broke below the EMA (70 & 200), showing bearish momentum.
Supply Zone (POI): 23,524 – 23,637, where price may retest before further decline (potential short entry z

Trend Continuation setup Market is in Uptrend
weekly Upside
very risky trade .
Either wait in 4 HR but the target will be the same .
See all ideas
Displays a symbol's price movements over previous years to identify recurring trends.