SPX – Wave 5 in Progress | Updated Analysis - 06-Dec-2025Continuation of Previous Elliott Wave Outlook (Link Below)
Chart Update Date: 06 Dec 2025
📍 Old Analysis Reference (28 Aug 2025)
In my previous analysis shared on 28 August 2025, I highlighted that the SPX was completing Wave 4 and was expected to resume the upward journey into Wave 5 within the rising channel structure.
🔗 Previous Forecast:
Price respected the projection zone perfectly, holding the 6,500 major support, which confirmed the end of Wave 4 and triggered the beginning of Wave 5.
📈 Current Technical Outlook
The index is now trading back inside the mid-channel region and above the BB mid-line, indicating continuation momentum.
💡 Key Observations
Wave 4 completed at 6,500 support zone
Strong rebound from channel bottom with bullish confirmation
RSI rising from 40–45 range & crossed signal line → bullish momentum shift
Price respecting the rising parallel channel structure
Trading above 20 SMA Bollinger mid-band
🎯 Wave 5 Upside Targets
Target Levels Notes
7,089 First resistance
7,255 – 7,497 Major Fib Cluster
7,600 – 7,734 Primary Wave 5 target
7,900 – 8,000 Extended Wave 5 potential
🛡 Invalidation & Support
Support Zone Comment
6,925 Short-term
6,500 Wave 4 low / structural invalidation
4,800 Long-term macro support
🧠 Conclusion
As long as 6,500 remains protected, the structure strongly favors bullish continuation toward 7,250–7,600 initially and possibly even 8,000.
📌 Bias: Bullish
📌 Invalidation: Close below 6,500
❓ Discussion
Will SPX achieve 8,000 before any major correction?
Share your thoughts below 👇
Trade ideas

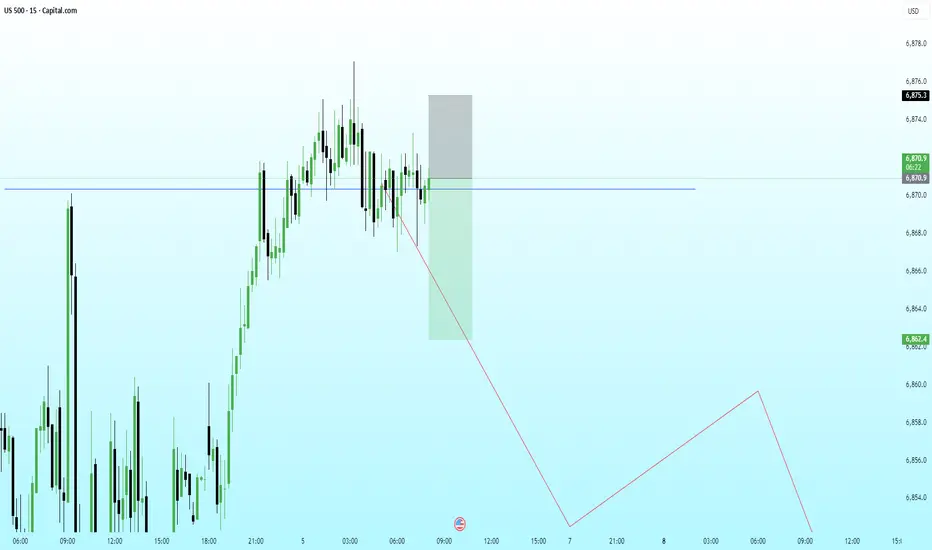
US500 – Clean Retest of Broken Structure With Bearish ContinuatiPrice has retested the broken structure level (blue line) and is now reacting inside a premium zone, suggesting sellers may re-enter the market from this region. The consolidation and repeated rejections indicate absorption of buy-side pressure.
With HTF context still pointing toward a deeper correction, this LTF retest offers a potential distribution setup before a continuation lower toward the next major liquidity pocket.
Bearish Path:
• Retest of the broken structure
• Reaction from premium supply zone
• LTF breakdown and structure shift
• Continuation toward downside liquidity + inefficiencies below
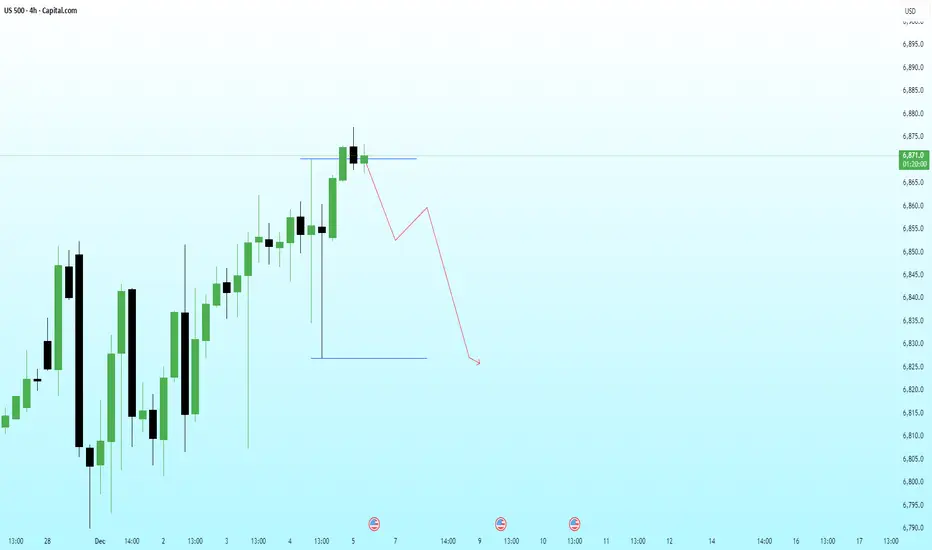
US500 – Liquidity Sweep at the Highs With Bearish Continuation PPrice has swept the immediate buy-side liquidity sitting above the recent high and is already showing signs of exhaustion. The reaction suggests a possible distribution phase forming near the top, aligning with the broader HTF narrative for a corrective leg.
If price fails to reclaim the swept high, the next logical target becomes the sell-side liquidity resting at the lower blue line.
Bearish Path:
• Sweep of the highs
• Failure to sustain above the level
• LTF shift into bearish structure
• Continuation toward downside liquidity + imbalance fill
⚠️ ENTRY CONDITION (IMPORTANT):
I will execute this trade only if the LTF replicates the structural behavior I expect from the HTF.
No LTF confirmation = No trade.
US 500 – Next Moves on a Knife EdgeIt’s often said that fear and greed underpin moves across financial markets and that was certainly the case for US indices at the end of last week.
Focusing on the US 500, prices first reacted positively to a Federal Reserve interest rate cut which was accompanied by a more dovish outlook than many traders had anticipated from Chairman Jerome Powell in the press conference. This added fuel to hopes for a Santa rally to end 2025, briefly taking the US 500 index up to its previous record highs of 6924 on Thursday.
However, that period of greed didn’t last long before fear took over, when a disappointing sales forecast from Broadcom released after the close brought back concerns that the AI bubble may be deflating, a view that gained further momentum when it was reported on Friday that Oracle may be experiencing delays to their data centre rollout. These two important pieces of news helped to accelerate an eventual 1.3% sell off in the index down to Friday’s close at 6830.
While US 500 prices have stabilised in Asia early this morning, this battle between dip buyers, looking for a final upside flourish to challenge the psychological 7000 level and those more conservative traders, keen to bank strong year to date gains and wait for the start of 2026, could be about to renew, with the release of the latest US Non-farm payrolls on Tuesday at 1330 GMT which could provide clarity on how quickly the Fed may need to cut interest rates again at the start of 2026. This is followed by Micron’s Q3 earnings on Wednesday (after the close) where the debate of AI expenditure versus revenue may again be thrust into the spotlight.
These events could provide a volatile and challenging environment for traders to navigate, and consideration may need to be given to the technical outlook to assess whether upside momentum or downside fatigue may eventually dominate US 500 price action.
Technical Update: All-Time High Resistance Holding?
The US 500 index has staged an impressive near 6.4% advance from the 6508 November 21st session low to last week’s 6924 high. However, Friday’s sell‑off may mark the first indication that upside momentum is slowing or even failing.
In order to maintain positive price‑trending conditions, resistance levels must continue to be broken. Last week’s failure to extend strength and close above the October 30th high at 6925 may prompt some traders to question the sustainability of the recent upside price momentum.
Much will continue to depend on future price trends, but as the chart above shows, last Thursday’s high of 6924 tested resistance provided by the October 30th extreme at 6925. Importantly, this level capped prices again and downside weakness began to emerge, confirming 6925 as a key resistance focus.
Of course, Friday’s decline may yet prove to be another limited correction before fresh price strength resumes. So, it remains prudent to monitor key support and resistance levels closely in the coming week. Doing so could help to determine whether the latest activity reflects a slowing of upside momentum that could lead to further weakness, or simply a pause in the advance before renewed strength develops.
Potential Resistance Levels:
Following Friday’s price weakness after the failure to break above the 6925 high, this level now appears to be the first resistance focus for the coming week. Successful closes above 6925 would appear to be necessary to unlock potential for moves to higher levels.
While not a guarantee of continued upside, closing breaks above 6925 may signal attempts at a resumption of price strength. If confirmed, such closes could pave the way for attempts to challenge 7079, the 38.2% Fibonacci extension level, with scope for further gains toward 7176, the 61.8% extension, should that level also give way on a closing basis.
Potential Support Levels:
Friday’s weakness from the October 30th high at 6925 could now shift trader focus toward potential support at 6766, which is the 38.2% retracement of the November/December advance.
Closing breaks below 6766 could be further evidence of slowing upside momentum and might open scope for further weakness.
As the chart above highlights, closing breaks below the 6766 retracement support may expose risks of moves down toward 6717, the 50% Fibonacci level, and potentially even 6668, which is the deeper 61.8% retracement.
The material provided here has not been prepared accordance with legal requirements designed to promote the independence of investment research and as such is considered to be a marketing communication. Whilst it is not subject to any prohibition on dealing ahead of the dissemination of investment research, we will not seek to take any advantage before providing it to our clients.
Pepperstone doesn’t represent that the material provided here is accurate, current or complete, and therefore shouldn’t be relied upon as such. The information, whether from a third party or not, isn’t to be considered as a recommendation; or an offer to buy or sell; or the solicitation of an offer to buy or sell any security, financial product or instrument; or to participate in any particular trading strategy. It does not take into account readers’ financial situation or investment objectives. We advise any readers of this content to seek their own advice. Without the approval of Pepperstone, reproduction or redistribution of this information isn’t permitted.

Part 10 Trade Like Institutions Role of Option Greeks
Option Greeks help traders measure risk:
Delta: Sensitivity to price movement.
Gamma: Rate of change of delta.
Theta: Impact of time decay.
Vega: Sensitivity to volatility.
Rho: Sensitivity to interest rates.
Understanding Greeks enables better strategy selection and position adjustment.

Earnings Season Trading – A Complete Guide1. What Is Earnings Season?
Earnings season is the period when companies release their quarterly financial performance, including:
Revenue (sales)
Net profit or loss
Earnings per share (EPS)
Operating margins
Management guidance and outlook
In India, earnings seasons usually begin shortly after the end of each quarter:
Q1: April–June (results from July)
Q2: July–September (results from October)
Q3: October–December (results from January)
Q4: January–March (results from April/May)
During this time, stocks can experience sudden and large price movements due to surprises in results or guidance.
2. Why Earnings Season Is Important for Traders
Earnings are the primary driver of long-term stock value. While news, sentiment, and macro factors matter, earnings confirm whether a company’s business is actually performing.
For traders, earnings season matters because:
Volatility increases – Sharp price swings create trading opportunities.
Volume rises – Institutional participation increases liquidity.
Trend changes occur – Stocks may break out or break down decisively.
Repricing happens – Stocks are revalued based on future expectations.
A single earnings announcement can move a stock 5–20% in one session, especially in mid-cap and small-cap stocks.
3. How Markets React to Earnings
Stock price movement during earnings is not only about whether results are good or bad. The reaction depends on expectations vs reality.
Common Earnings Reactions:
Results better than expectations
→ Stock may rise sharply.
Results in line with expectations
→ Stock may remain flat or even fall (profit booking).
Results below expectations
→ Stock often declines sharply.
Strong results but weak guidance
→ Stock may fall.
Weak results but strong future outlook
→ Stock may rise.
This is why traders say:
“Markets trade on expectations, not just numbers.”
4. Types of Earnings Season Traders
1. Pre-Earnings Traders
These traders take positions before results, betting on:
Strong earnings surprise
Sector momentum
Insider or institutional accumulation
Technical breakout ahead of results
Risk is high because outcomes are uncertain.
2. Post-Earnings Traders
These traders wait for results and then trade:
Breakouts after earnings
Trend continuation
Gap-up or gap-down moves
This approach reduces uncertainty but may miss part of the move.
3. Options Traders
Options traders focus on:
Volatility expansion
Implied volatility crush after results
Directional or non-directional strategies
Earnings season is especially important for options due to volatility changes.
5. Popular Earnings Season Trading Strategies
1. Earnings Breakout Strategy
Identify stocks consolidating near resistance before earnings
Strong results trigger a breakout with high volume
Entry after breakout confirmation
Stop-loss below breakout level
Best suited for momentum traders.
2. Gap-Up / Gap-Down Trading
After earnings, stocks often open with a gap.
Gap-up with volume and follow-through → bullish continuation
Gap-up but weak volume → possible fade
Gap-down below key support → bearish continuation
This strategy is popular among intraday and short-term traders.
3. Buy the Rumor, Sell the News
Stock rises before earnings due to expectations
Even good results lead to profit booking
Traders exit positions before or immediately after results
This strategy requires understanding sentiment and positioning.
4. Post-Earnings Drift Strategy
Some stocks continue moving in the same direction for days or weeks after earnings.
Strong earnings + strong close = bullish drift
Weak earnings + weak close = bearish drift
Swing traders often use this strategy.
5. Options Volatility Strategy
Before earnings:
Implied volatility (IV) increases
After earnings:
IV collapses
Common strategies:
Straddle or strangle (for big moves)
Iron condor or credit spreads (to benefit from IV crush)
Options traders must manage risk carefully due to sudden moves.
6. Key Factors to Analyze Before Trading Earnings
Before taking any earnings trade, traders should analyze:
1. Historical Earnings Reaction
How much does the stock usually move after earnings?
Is it volatile or stable?
2. Market and Sector Trend
Bullish markets reward good earnings more
Weak markets punish even decent results
3. Expectations and Estimates
Compare analyst estimates with company guidance
Higher expectations mean higher risk of disappointment
4. Technical Levels
Support and resistance
Trend direction
Volume patterns
5. Management Commentary
Often, price moves more on:
Future guidance
Margin outlook
Demand visibility
than on current quarter numbers.
7. Risks in Earnings Season Trading
Earnings trading is not easy and carries unique risks:
Overnight risk – Results are often announced after market hours.
Whipsaws – Initial reaction may reverse quickly.
False breakouts – Emotional reactions can trap traders.
Volatility crush in options – Wrong options strategy can cause losses even if direction is right.
Because of these risks, position sizing and stop-loss discipline are critical.
8. Risk Management During Earnings
Smart traders follow strict risk rules:
Trade smaller quantities
Avoid overexposure to one stock
Use predefined stop-loss
Avoid revenge trading after losses
Prefer post-earnings confirmation if risk-averse
Professional traders focus on survival first, profits second.
9. Earnings Season for Long-Term Investors vs Traders
Investors use earnings to validate fundamentals and hold through volatility.
Traders use earnings for short-term price movements and momentum.
A trader may exit quickly, while an investor may add on dips caused by short-term disappointment.
Understanding your role is essential before trading earnings.
10. Conclusion
Earnings season trading is one of the most exciting and challenging aspects of the stock market. It offers exceptional opportunities due to high volatility, volume, and strong price discovery. However, it also carries higher risk because markets react not just to results, but to expectations, guidance, and sentiment.
Successful earnings traders combine:
Fundamental understanding
Technical analysis
Volatility awareness
Strict risk management
Rather than trading every result, disciplined traders focus only on high-probability setups. With experience, patience, and proper risk control, earnings season trading can become a powerful tool in a trader’s strategy arsenal.

Part 6 Learn Institutional Trading Buyers vs. Sellers
Option Buyers
Pay premium.
Limited risk (premium only).
Unlimited reward potential.
Low probability of profit (because time decay erodes premium).
Option Sellers (Writers)
Receive premium.
Limited profit (premium only).
Can face huge losses.
High probability of profit (because time decay works in their favor).
Professional traders often prefer selling options, but with strict risk management.

SPX Short , Possible Trend ChangeBy the looks of it we might have got a top on SPX.
We got an ATH (Top#1) mentioned as Top #1 , followed by 2 additional tops Top#2 and Top#3.
Following the ATH each Top was a Lower High compared to the previous one showing difficulties breaking above it.
After each top we got a correction the bottom of each correction is marked as Low#1 and Low#2.
The correction from Top#2 aka Low#2 being lower being a lower low (Low#2 < Low#1) compared to the previous low.
If we wont make any Higher High compared to previous tops soon I predict a larger correction to follow.
Risk reward aligns perfectly with this setup.

Super Cycle Outlook: The Big Picture in Financial MarketHistorical Perspective of Super Cycles
Historically, super cycles have often been observed in commodities, stock markets, and global trade patterns. For instance:
Commodity Super Cycles: The industrialization of the United States and Europe during the 19th century created the first global commodity super cycle, driven by massive demand for coal, iron, and raw materials. Similarly, the post-World War II economic expansion, especially between the 1950s and 1970s, fueled a commodities boom, creating a super cycle for oil, metals, and agricultural products. More recently, China’s industrial rise in the 2000s led to a demand-driven super cycle in base metals such as copper, iron ore, and aluminum.
Equity Market Super Cycles: Stock markets also experience long-term super cycles, often reflecting sustained technological innovation, demographic transitions, or globalization. The U.S. stock market experienced a super cycle from the 1980s through 1999, driven by technology adoption, financial deregulation, and globalization. Similarly, emerging markets like India and China have seen multi-decade super cycles as rapid urbanization, rising middle-class income, and industrial expansion drove sustained economic growth.
Drivers of Super Cycles
Super cycles are not random—they are typically fueled by a combination of structural factors that persist over decades:
Demographics: Population growth and urbanization play a central role in super cycles. A young, growing population increases labor force participation, consumer demand, and investment in infrastructure. For instance, Asia’s rapid urbanization in the early 2000s drove a long-term commodity super cycle.
Technological Innovation: Revolutionary technologies can create long-term growth trends in equity markets and certain sectors. The rise of the internet, renewable energy, electric vehicles, and artificial intelligence has the potential to fuel new super cycles, reshaping the global economic landscape.
Globalization and Trade Expansion: The integration of emerging economies into global supply chains often creates decades-long growth trends. China’s entry into the World Trade Organization (WTO) in 2001 triggered a commodity super cycle and reshaped global trade flows.
Monetary and Fiscal Policies: Low interest rates, expansive fiscal spending, and accommodative monetary policy can extend super cycles by encouraging investment and consumption. The post-2008 period of global quantitative easing, for example, contributed to sustained equity market rallies in developed countries.
Geopolitical Shifts: Wars, sanctions, and trade agreements can have long-lasting effects on commodity prices and market sentiment. For instance, oil price super cycles have often coincided with geopolitical disruptions in the Middle East or shifts in OPEC strategies.
Phases of a Super Cycle
Super cycles generally progress through distinct phases, each with unique characteristics:
Emergence Phase: This is the initial stage, marked by structural change, technological breakthroughs, or demographic shifts. Asset prices may begin rising slowly as markets recognize long-term trends.
Acceleration Phase: During this period, growth becomes more visible and widely accepted. Investor optimism builds, demand outpaces supply, and markets often experience rapid price appreciation. Commodities or equities enter a strong upward trajectory.
Peak Phase: At this stage, growth reaches its maximum. Prices are often overextended relative to historical norms, speculation may increase, and market volatility can rise. Structural imbalances, such as overproduction or inflated valuations, often become apparent.
Decline or Correction Phase: After the peak, the super cycle gradually cools. Prices may decline sharply or stabilize at a lower growth trajectory, often influenced by macroeconomic corrections, demographic slowdowns, or shifts in policy.
Consolidation or Reversal: In some cases, super cycles may transition into new cycles or periods of stagnation. For instance, a commodities super cycle might end as demand stabilizes and supply chains normalize, paving the way for a new cycle in another sector or geography.
Implications for Investors
Understanding super cycles is crucial for both short-term traders and long-term investors:
Long-Term Asset Allocation: Super cycles influence which asset classes are likely to outperform over decades. For example, during commodity super cycles, investing in metals, energy, or infrastructure stocks can yield substantial returns.
Risk Management: Super cycles often bring higher volatility in the mid-term. Being aware of the stage of a super cycle allows investors to adjust portfolios and hedge risks effectively.
Sector Rotation: Super cycles create sector-specific opportunities. In the technology-driven super cycle of the 1990s, tech and internet companies outperformed traditional sectors. Similarly, emerging markets outperform during demographic-driven cycles.
Global Diversification: Super cycles are often regional or sector-specific. By diversifying globally, investors can capture growth in regions or sectors that are entering new super cycles while mitigating risks from declining cycles elsewhere.
Current Super Cycle Outlook
As of 2025, several analysts believe the global economy may be entering a new super cycle driven by:
Green Energy Transition: The global shift toward renewable energy, electric vehicles, and decarbonization efforts is creating a new long-term demand pattern for commodities like lithium, cobalt, copper, and rare earth metals.
Technological Advancement: AI, robotics, cloud computing, and biotechnology are transforming productivity and creating multi-decade growth opportunities in equities and specialized sectors.
Demographics and Urbanization in Emerging Markets: Africa, Southeast Asia, and parts of Latin America are experiencing rapid urbanization and population growth, potentially fueling new super cycles in infrastructure, consumer goods, and financial services.
Monetary Policy Evolution: Central banks are navigating the post-pandemic environment with cautious monetary policy, balancing inflation control and growth stimulation, which may influence the timing and intensity of super cycles.
Challenges and Risks
While super cycles present opportunities, they also carry inherent risks:
Speculative Excess: Long-lasting uptrends can encourage excessive speculation, leading to bubbles and abrupt corrections.
Geopolitical Uncertainty: Conflicts, trade wars, or sanctions can disrupt supply chains and derail super cycle expectations.
Technological Disruption: While technology can drive growth, it can also render existing industries obsolete, creating winners and losers in the market.
Environmental Constraints: Resource depletion, climate change, and sustainability issues may cap the potential of certain super cycles, especially in commodities and energy markets.
Conclusion
Super cycles are among the most influential drivers of long-term financial market trends. Unlike normal market cycles, they reflect deep structural shifts in economies, technologies, demographics, and global trade patterns. Understanding super cycles allows investors to make strategic long-term decisions, manage risks, and identify sectors poised for decades of growth. While predicting the exact timing and magnitude of super cycles is challenging, analyzing macroeconomic trends, demographic shifts, technological innovation, and geopolitical developments can provide valuable insights into where the next long-term opportunities may lie.
In 2025, the global outlook suggests a transition into a super cycle shaped by green energy, technological transformation, and emerging market growth. Investors, policymakers, and strategists who recognize and adapt to these long-term trends are likely to capture the maximum benefits of the next multi-decade expansion, while carefully managing the risks inherent in any large-scale structural market movement.
6000 is good for trendSP:SPX
6000 is good for trend.
10% Retracement also trap pattern repetition actual down trend in previous trend is around 20% but any assume 10% for good economic via trump 😅
always do your own research
i am not financial advisor.
please feel free to ask any questions

Part 9 Trading Master Class With Experts What Are Options?
Options are derivative contracts, meaning their value is derived from an underlying asset—most commonly stocks, indices (like Nifty or Bank Nifty), commodities, or currencies.
Every option has two key components:
Strike Price – The agreed price at which the trader can buy or sell the underlying asset.
Expiry Date – The date on which the option contract ends.
Options are of two types:
• Call Option (CE)
A call option gives the buyer the right, but not the obligation, to buy the underlying asset at the strike price before expiry.
You buy a call when you expect price to go up.
• Put Option (PE)
A put option gives the buyer the right, but not the obligation, to sell the asset at the strike price before expiry.
You buy a put when you expect price to fall.
The keyword is right, not an obligation—this makes options different from futures.

Daily Macro, Market Mood Swings, & the Stories Behind the NoiseNvidia: The Market’s Emergency Generator
Nvidia didn’t just beat expectations—it blew past them like a power surge through an already overloaded grid. The post-market 5% jump wasn’t enough to revisit October highs, but it was enough to jolt the entire AI complex back to life. More importantly, it single-handedly revived hopes of a December melt-up. When the biggest weight in the S&P 500 delivers, the whole market exhales.
Fed: The Decider-In-Chief
Whether this relief rally becomes a full Santa run now rests squarely with the Federal Reserve. Markets want a clean 25bp cut; futures, however, are quickly losing faith. The October minutes leaned hawkish, with officials openly mulling rates on hold through end-2025. Inflation is sticky, data is messy, and the FOMC is split between “trust the lagging indicators” and “avoid repeating the 1970s.” Cozy.
Dollar Dynamics & Data Fog
The dollar index climbed above 100.1—its highest in nearly two weeks—as traders dialed back December rate-cut expectations. Markets now assign only ~34% odds to a 25bps cut. The confusion deepened when the BLS confirmed the October jobs report won’t be published, since household data can’t be retro-collected. The missing report will be folded into November’s release, adding one more blindfold to the Fed’s labor-market assessment.
Global Moves: Yen Wobbles, JGBs Rebel, Europe Steadies
The dollar strengthened against the yen, pushing the Japanese currency to a 10-month low and prompting Finance Minister Katayama to announce that Tokyo is monitoring markets with “a high sense of urgency”—which is bureaucratic for “this is not fine.” Meanwhile, Japanese bond yields broke every rule in the stimulus textbook, with the 40-year hitting a record and the 30-year touching 3.334%.
In India, benchmark equities reversed early losses as foreign inflows and a bounce in IT helped restore calm.
Across Europe, the Eurozone headline CPI held steady at 2.1%, while UK CPI eased to 3.6%, matching expectations and giving central bankers one less thing to stress about.
Ahead Today: The Data Lineup
A busy U.S. docket awaits:
• September non-farm payrolls & unemployment
• October industrial production
• Initial jobless claims
• Existing home sales

Daily Macro, Market Mood Swings, & the Stories Behind the NoiseThe Background Buzz
What’s the market mood?
Think of a machine that’s been running too long, too hot, too fast — now humming with that faint, hollow “something’s-off” vibration. The AI complex, once the unstoppable locomotive of 2025, suddenly sounds like someone poured sand into the gearbox. Not a crash, not a panic — just a market cruising at high altitude on borrowed oxygen, slowly realizing the air’s getting thin.
Four Red Days & A Rising VIX
Four straight down days in the S&P, a VIX inching toward 25, and a vibe shift that feels more psychological than mechanical. Nearly half of institutional investors now say the biggest tail risk is an AI bubble — not inflation, not yields, not geopolitics. When AI beats everything else on the anxiety leaderboard, you know the mood’s changed.
Global Markets Join the Gloom
Add in global weakness — Japan and Korea dropping over 3%, Europe sliding 1%, CCC yields punching above 10%, and the Nasdaq looking bruised — and you get a market that isn’t dumping AI… just interrogating it like a detective who skipped lunch.
Nvidia, the Market’s Mood Ring
Which brings us to Nvidia — part deity, part executioner. Tomorrow’s earnings aren’t just important; they’re the emotional thermostat of the entire AI universe. One guidance blip from Nvidia and global sentiment swings like a ceiling fan with a loose screw.
Layoffs Add to the Chill
Meanwhile, the labor tape isn’t helping. U.S. companies are trimming about 2,500 jobs a week, and October’s mass layoffs hit 39,000. It’s the kind of data that makes markets squint and ask, “Is this still a soft landing or did someone remove the padding?”
Rate Cut Whispers
Fresh data showed continued unemployment claims hitting a two-month high at 1.9 million for the week ending Oct 18.and gold and silver immediately tried to shake off their three-day slump.
Markets now price nearly a 50% chance of a Fed cut on Dec 9–10, up from 46% earlier in the day — proof that even basis points can cause mood swings.
India Feels the Ripple
India’s benchmark equities finally slipped after a six-day rally, caught in the global selloff as traders turn cautious ahead of key U.S. data.
The rupee, meanwhile, logged a second straight gain — helped by optimism around a potential U.S. trade deal.
Gold Shines, Crypto Sulks
Gold and silver climbed as rate-cut hopes firmed and risk assets took more damage. Cryptos, unfortunately, were the designated punching bag of the day.
⸻
10. The Day Ahead
US: Industrial production, housing starts, trade data, FOMC minutes
UK: CPI
Eurozone: CPI

Divergence SecretsRisks in Option Trading
1. Option Buying Risks
Premium becomes zero if market doesn’t move
Time decay erodes value daily
Volatility crush hurts premiums
Beginners often lose due to poor timing.
2. Option Selling Risks
Unlimited losses if market breaks range
Requires strict discipline & risk management
Sudden news, gap-ups, crash can blow the account
Margin requirement is high for safety.
3. Emotional Trading
Options move very fast.
Greed, fear, impatience can cause severe losses.

Understanding the Master Candle ConceptOption trading is one of the most exciting and flexible segments of the financial markets. It allows traders to profit not only when prices rise, but also when they fall — and even when they stay relatively stable. In simple terms, an option is a financial contract that gives the buyer the right, but not the obligation, to buy or sell an underlying asset at a predetermined price within a specified period. In India, options are primarily traded on stock indices (like NIFTY 50 or BANK NIFTY) and individual stocks on exchanges like the NSE (National Stock Exchange) and BSE (Bombay Stock Exchange).
Option Trading in India – Regulations
Option trading in India is regulated by the Securities and Exchange Board of India (SEBI).
Contracts are standardized and traded through exchanges like NSE and BSE.
All participants must trade through SEBI-registered brokers, and margins are monitored daily to control risk.

Advanced Option Trading StrategiesHedging and Portfolio Protection Strategies
Options are not just for speculation; they are powerful tools for hedging existing stock portfolios. Hedging means protecting against potential losses due to adverse price moves.
Popular Hedging Techniques:
Protective Put: Buy a put option against long stock holdings to limit downside.
Collar Strategy: Hold stock, sell a call, and buy a put — ideal when you expect limited movement.
Index Options for Portfolio Hedge: Traders holding multiple stocks often hedge using Nifty or Bank Nifty puts instead of individual stock options.

A daily wrapGrowth worries and Valuation Fears
Two themes ran the show last week: America’s once-mighty growth showing signs of fatigue, and investors rediscovering their fear of heights when it comes to stock valuations—all against the backdrop of a record-breaking government shutdown that’s kept official data in the dark longer than most TV reboots last.
The US economy looked like a mixed salad—plenty of green but dressed with uncertainty. With the shutdown nearing 40 days, hopes of a clean economic rebound were fading. Challenger’s job cuts data added salt to the mix, showing October layoffs at 20-year highs, with AI and corporate caution blamed. Meanwhile, consumer confidence slid to just above its historical floor. Yet somehow, the Atlanta Fed’s GDPNow model is still strutting around at 4.0% growth—perhaps it didn’t get the memo.
Fedspeak” was abundant but not harmonious. Some officials are still seeing inflation monsters under the bed, while others are losing sleep over the job market. The divide is widening—more duet than chorus.
UK
Across the pond, the Bank of England delivered a small surprise by standing pat on rates (5-4 vote) but hinting it’s ready to cut next—suggesting inflation may finally have peaked. Central bankers elsewhere largely hit replay on last week’s script.
China
In China, October’s trade numbers hinted at the limits of “pivoting away from the US.” Exports to non-US markets rose 3.1%, but a 25% drop in shipments to the US dragged total exports down 1.1%. Even Beijing’s redirection efforts seem to have hit a yield curve.
Meanwhile, the US Supreme Court began debating the legality of certain executive-imposed tariffs. Early questioning suggested skepticism from the bench—but no verdict is expected soon. Lawyers everywhere are sharpening pencils and patience alike.
Markets: AI Angst and Data Drought
Equities stumbled as AI valuation panic reemerged, pushing the Nasdaq to its worst week since April. The 10-year Treasury yield wobbled mildly between 4.05% and 4.16%, while gold stayed shiny but subdued ($3,940–$4,030). The real rollercoaster was Bitcoin, whipsawing between $99k and $111k—because apparently, gravity is optional in crypto land. Oil quietly clocked out below $60 a barrel.
The Week Ahead
The shutdown saga rolls on, which means another week without CPI, PPI, or other vital data—like driving blindfolded with only private surveys as headlights. Expect attention on the NFIB small business survey, ADP employment data, and a flurry of Fed speeches, as officials try to sound informed without actual information.
Elsewhere:
• Japan’s BoJ minutes may reveal internal political pressure to delay its long-teased rate hike.
• Europe gets the ZEW survey, ECB’s latest economic outlook, and some lagging indicators (GDP, trade, jobs, and German inflation).
• UK focus shifts to labor data and wage growth, critical for the Bank of England’s next move, with several MPC members on speaking duty.
The US-China trade deal, sealed in Kuala Lumpur and Busan, still holds—much to the surprise of cynics betting on diplomatic self-sabotage.
the AI bubble chatter refuses to deflate. A recycled Sam Altman quote calling AI investments a “bubble”, coupled with an MIT study claiming 95% of corporate AI bets aren’t profitable, had investors clutching their neural networks. Never mind that both were old news—markets rediscovered them like lost episodes of a bad reality show.

Risk in Option Trading: Segments of Financial Markets1. Introduction to Options and Risk
Options are derivative instruments that give traders the right but not the obligation to buy (call option) or sell (put option) an underlying asset at a specified price (strike price) within a set time frame. While this flexibility can amplify profits, it can also magnify losses if the market moves unfavorably.
Unlike simple stock trading where risk is typically limited to the capital invested, option trading can expose traders to theoretically unlimited losses, depending on the strategy used. This complexity makes understanding option-related risks critical for both retail and institutional investors.
2. Types of Risks in Option Trading
Option trading involves several interconnected types of risk. The major categories include market risk, volatility risk, time decay (theta) risk, liquidity risk, and operational risk. Let’s explore each in detail.
A. Market Risk (Directional Risk)
Market risk, also known as directional risk, refers to the possibility of losing money due to adverse price movements in the underlying asset.
For Call Options: The risk arises if the price of the underlying asset fails to rise above the strike price before expiry. In this case, the option expires worthless, and the premium paid is lost.
For Put Options: The risk occurs if the price of the underlying fails to fall below the strike price, leading to a total loss of the premium.
For Option Sellers: The market risk is even higher. A call writer (seller) faces theoretically unlimited losses if the underlying price keeps rising, while a put writer can suffer heavy losses if the price falls drastically.
For example, if a trader sells a naked call on a stock trading at ₹1,000 with a strike price of ₹1,050 and the stock rallies to ₹1,200, the seller faces huge losses as they may have to deliver shares at ₹1,050 while buying them at ₹1,200 in the market.
B. Volatility Risk (Vega Risk)
Volatility is one of the most important factors influencing option prices. It reflects how much the underlying asset’s price fluctuates. Vega measures the sensitivity of an option’s price to changes in implied volatility.
High Volatility: Increases the premium of both call and put options because the probability of large price swings rises.
Low Volatility: Decreases option premiums as the likelihood of significant price movement reduces.
Traders holding long options (buyers) benefit from rising volatility since it inflates option prices. Conversely, sellers (writers) are hurt when volatility rises, as they may need to buy back the options at a higher premium.
The challenge arises when volatility changes unexpectedly. Even if the direction of the underlying asset moves favorably, a fall in volatility can reduce the option’s value — leading to losses despite being "right" about the price movement.
C. Time Decay Risk (Theta Risk)
Time decay (Theta) is a silent killer for option buyers. Options lose value as they approach expiration because the probability of a significant price move declines with time.
For Buyers: Each passing day erodes the option’s extrinsic value, even if the market doesn’t move. If the underlying asset doesn’t move as expected within a limited time, the option can expire worthless.
For Sellers: Time decay works in their favor. They benefit as the option’s value decreases over time, allowing them to buy it back at a lower price or let it expire worthless.
For instance, if an investor buys a call option for ₹100 with one week to expiry and the underlying asset stays flat, the option may fall to ₹40 simply due to time decay, even though the price hasn’t changed.
D. Liquidity Risk
Liquidity risk refers to the difficulty of entering or exiting a position without significantly affecting the market price. In illiquid options (those with low trading volumes and wide bid-ask spreads), traders may have to buy at a higher price and sell at a lower one, reducing profitability.
A wide bid-ask spread can erode returns and make stop-loss strategies ineffective. For example, an option quoted at ₹10 (bid) and ₹15 (ask) has a ₹5 spread — meaning a trader buying at ₹15 might only be able to sell at ₹10 immediately, losing ₹5 instantly.
This is particularly common in options of less popular stocks or far out-of-the-money strikes.
E. Leverage Risk
Options provide built-in leverage. With a small investment, traders can control a large notional value of the underlying asset. While this magnifies potential gains, it also amplifies losses.
For example, if a ₹50 premium option controls 100 shares, the total exposure is ₹5,000. A 50% move in the option’s value results in a ₹2,500 change, equating to a 50% gain or loss on the entire investment. Such leverage can be disastrous without proper risk management.
F. Assignment and Exercise Risk
For option sellers, there is always the risk of assignment, meaning they might be forced to deliver (in the case of calls) or buy (in the case of puts) the underlying asset before expiration if the buyer chooses to exercise early.
In American-style options, early exercise can happen anytime before expiration, catching the seller off guard. This can lead to unexpected margin requirements or losses, especially around dividend dates or earnings announcements.
G. Margin and Leverage Risk for Sellers
Selling options requires maintaining a margin deposit. If the market moves against the position, brokers can issue a margin call demanding additional funds. Failure to meet it can result in forced liquidation at unfavorable prices.
Because potential losses for naked option writers are theoretically unlimited, many traders face catastrophic losses when they fail to manage margin requirements properly.
H. Event and Gap Risk
Market-moving events such as earnings announcements, policy changes, or geopolitical developments can lead to sudden price gaps. These gaps can cause significant losses, especially for short-term traders or option sellers.
For example, if a company reports poor earnings overnight and its stock opens 20% lower the next day, all short put sellers will face massive losses instantly, often before they can react.
I. Psychological and Behavioral Risks
Option trading requires discipline, emotional control, and quick decision-making. Greed, fear, and overconfidence can lead traders to take excessive risks or hold losing positions too long. The complexity of options also tempts traders to overtrade, increasing transaction costs and exposure.
3. Managing Risks in Option Trading
While risks are inherent, they can be managed effectively with proper strategies and discipline:
Position Sizing: Never risk more than a small percentage of total capital on a single trade.
Stop-Loss Orders: Use stop-loss mechanisms to limit downside risk.
Hedging: Combine long and short options to reduce exposure (e.g., spreads or straddles).
Diversification: Avoid concentrating positions in one stock or sector.
Monitor Greeks: Regularly track Delta, Theta, Vega, and Gamma to understand sensitivity to market factors.
Avoid Naked Positions: Prefer covered calls or cash-secured puts over naked options.
Stay Informed: Be aware of corporate events, macroeconomic announcements, and volatility trends.
Paper Trade First: Beginners should practice with virtual trades before using real money.
4. Conclusion
Option trading offers immense profit potential but carries significant risk due to leverage, volatility, and time sensitivity. The same features that make options powerful tools for speculation or hedging can also make them dangerous for uninformed traders.
Successful option traders understand that managing risk is more important than chasing returns. By combining knowledge of market dynamics, disciplined strategies, and proper risk management, traders can navigate the complex world of options effectively and sustainably.
Knowledge of Candle Pattern What a candlestick shows (quick)
Body = open → close (filled/green = close>open bullish, filled/red = close

S&P 500 – Elliott Wave Breakdown & Long Setup (15-Min Chart)The S&P 500 has completed a full five-wave impulsive decline and is now progressing through a corrective A–B–C structure, offering a potential long setup on the horizon.
🔍 Wave Structure Recap:
- Wave (1) began on Oct 29, 2025, from a top of 6,920.33, and ended on Oct 31 at 6,814.27.
- Wave (2) retraced to the 61.8% Fib level of Wave (1), topping at 6,879.01.
- Wave (3) extended to the 161.8% Fib projection of Wave (1), bottoming at 6,707.52.
- Wave (4) retraced between the 23.6%–38.2% Fib zone, peaking at 6,757.64.
- Wave (5) concluded near the 61.8% extension, at 6,631.45.
📈 Current Setup:
- The index is now completing corrective Wave A, currently in its final sub-wave (v), targeting the 38.2% projection at 6,734.47.
- We anticipate a Wave B retracement toward the 50%–61.8% zone, near 6,670, which will be our entry level to go long and ride the upcoming Wave C.
🧠 Strategy:
- Wait for Wave A to complete near 6,734.
- Look for bullish confirmation around 6,670 during Wave B.
- Target Wave C extension with trailing stops to capture the move.

The Hidden Potential of the Stock Market1. Beyond the Ticker: The Real Purpose of the Stock Market
At its core, the stock market was never just a gambling table for quick money. It was designed as a mechanism to raise capital for businesses and distribute ownership among the public. Every share you buy represents a slice of a real company—an entity that creates products, provides services, employs people, and drives the economy forward.
This means that by investing in the stock market, you are indirectly participating in the growth of industries—whether it’s technology shaping the digital world, renewable energy driving sustainability, or pharmaceuticals improving global health. The hidden potential here is not just in the price appreciation of a stock, but in the participation in the broader evolution of the global economy.
2. The Power of Compounding: Turning Time into Wealth
One of the greatest secrets of the stock market is the magic of compounding returns. This principle, often called the “eighth wonder of the world,” allows money to grow exponentially over time. When your investments generate earnings, and those earnings in turn generate more earnings, the effect multiplies.
For example, an investor who puts ₹1 lakh into a quality stock portfolio that grows at 12% per year could see that investment become over ₹10 lakh in 20 years—without adding another rupee. This growth doesn’t come from speculation but from patience, discipline, and the market’s natural tendency to reward long-term holders.
The hidden potential of compounding teaches investors that the real power lies not in predicting tomorrow’s market move, but in staying invested through the market’s cycles and letting time do the heavy lifting.
3. The Innovation Engine: How the Market Fuels Progress
Every major technological leap—from smartphones to electric cars—has been powered by capital raised in stock markets. When companies go public through IPOs, they unlock vast sums of money from millions of investors. This funding allows businesses to innovate, expand, and create breakthroughs that reshape industries.
Think of companies like Infosys, TCS, or Reliance Industries in India. Their access to public capital markets has enabled them to scale globally, employ hundreds of thousands, and transform entire sectors. As an investor, owning shares in such companies means being part of that transformative journey.
The hidden potential here lies in innovation ownership—you’re not just buying stock; you’re buying into the future of human progress.
4. Market Volatility: A Masked Opportunity
To many, volatility is the enemy of investing. But to those who understand the market’s hidden potential, volatility is a friend in disguise. Price swings often cause fear, leading many to sell at lows or hesitate during uncertain times. Yet, for disciplined investors, these moments create opportunities to buy strong businesses at discounted prices.
Legendary investor Warren Buffett’s wisdom applies here: “Be fearful when others are greedy, and greedy when others are fearful.” The stock market’s temporary declines are often preludes to long-term gains. Historically, every major crash—from 2008’s financial crisis to 2020’s pandemic slump—was followed by record recoveries.
Thus, the hidden potential of volatility lies in its ability to create entry points for those with patience, courage, and conviction.
5. The Role of Knowledge and Psychology
While financial education is essential, understanding human psychology is equally critical in unlocking the stock market’s hidden potential. Most investors fail not because they lack information, but because they lack emotional control. Fear, greed, and herd mentality can destroy even the most well-researched portfolios.
The best investors know how to separate noise from knowledge. They focus on company fundamentals—earnings, management quality, and long-term prospects—rather than short-term price fluctuations. By mastering emotional discipline, an investor turns the market from a psychological battlefield into a tool for building generational wealth.
In short, the hidden potential of the market can only be revealed when the investor conquers their own impulses.
6. Diversification: The Silent Protector
Another layer of hidden potential lies in the principle of diversification. The stock market offers access to a vast universe of industries, geographies, and asset classes. A well-diversified portfolio not only reduces risk but also enhances returns over time.
By spreading investments across sectors—like banking, FMCG, infrastructure, and IT—investors can protect themselves from downturns in any one industry. Similarly, investing across large-cap, mid-cap, and small-cap stocks balances stability with growth potential.
Diversification transforms the unpredictable nature of markets into a more predictable, manageable wealth-building system.
7. The Rise of Retail Investors and Digital Empowerment
Technology has democratized access to the stock market like never before. Online trading platforms, mobile apps, and educational content have made investing easy and affordable for everyone. The new generation of investors no longer needs to rely solely on brokers or institutions—they can analyze, trade, and invest independently.
This digital revolution is unlocking the hidden potential of millions of small investors. Even with modest sums, retail participants can now build strong portfolios, invest in IPOs, and benefit from real-time market data.
India’s rapid increase in Demat accounts—crossing 150 million by 2025—is proof that the hidden potential of the stock market is reaching the masses. The power once concentrated among the few is now in the hands of everyday people.
8. The Economic Ripple Effect
The hidden potential of the stock market extends beyond personal gains—it has a ripple effect on the entire economy. When markets thrive, companies expand, employment rises, and government revenues grow. Consumer confidence strengthens, creating a positive feedback loop of growth.
Moreover, stock investments help channel domestic savings into productive assets rather than idle deposits. This efficient allocation of capital is what fuels sustainable economic development. Thus, a vibrant stock market is not just a reflection of economic growth—it’s a driver of it.
9. The Future Ahead: Sustainable and AI-Driven Markets
The future of the stock market lies in sustainability, innovation, and technology integration. With AI-driven analysis, data-backed investing, and ESG (Environmental, Social, and Governance) principles gaining traction, markets are becoming smarter and more responsible.
Investors who adapt to these trends can unlock new layers of hidden potential. Green energy companies, tech disruptors, and AI-driven platforms are likely to dominate the next decade. Recognizing these shifts early can be the difference between ordinary returns and extraordinary wealth.
Conclusion: Seeing Beyond the Obvious
The stock market’s hidden potential lies not in daily price swings but in its long-term ability to build wealth, fuel innovation, and shape economies. It rewards those who understand patience over prediction, discipline over emotion, and conviction over fear.
In every market correction lies an opportunity. In every innovation lies a seed of exponential growth. And in every share lies a story—of human ambition, resilience, and progress.
For those who look beyond the numbers and see the narrative, the stock market isn’t just an investment platform—it’s a gateway to limitless potential.
A daily Market WrapMarket Mood: Mildly Moody
US equities hit a speed bump as the dollar tripped for the second day running. Treasury yields, which had shot up recently, cooled off slightly—though the 10-year looks like it’s eyeing another climb. Precious metals made a modest comeback, thanks to the softer dollar, but not enough to justify breaking out the champagne (maybe a half-smile at best). Oil, meanwhile, slid to a two-week low, and Asia decided to keep things boring with flat equities and currencies
America’s Political Soap Opera: Shutdown, Season 2
US assets are looking fragile, and the biggest villain is the government shutdown, now so long it deserves its own Netflix series. With Republicans and Democrats locked in a staring contest, government functions are grinding to a halt and the economic fallout is starting to bite.
To add to the drama, Democrats scored sweeping wins in local elections, and President Trump is blaming the shutdown for the Republican stumble. The big question: will this political stalemate finally turn into a compromise, or will Washington keep playing chicken with the economy?
Corporate Reality Check: Layoffs Ahead?
In a less-than-cheerful headline, US firms announced the highest number of job cuts for any October in over 20 years. The culprits: AI efficiency drives, cautious consumers, tighter corporate budgets, and rising costs.
Economists warn this could flip the labor market from today’s “low hire, low fire” equilibrium to a much scarier “low hire, high fire” one—basically, fewer jobs and more pink slips.
Central Banks: The Brits Blink First
Across the pond, the Bank of England played it safe, keeping rates unchanged in a tight 5–4 vote. The Bank noted that inflation has “peaked,” subtly hinting at future cuts. In plain English: the BoE is done fighting inflation and may soon start fighting recession fears.
The move wasn’t a surprise, but the dovish tone was softer than expected—like a stern teacher suddenly saying, “Alright, you’ve learned your lesson.”
On Deck: US Data & Fed Chatter
Today’s economic lineup features the University of Michigan’s Consumer Sentiment Index and the New York Fed’s Consumer Inflation Expectations survey—two handy barometers for how optimistic (or not) Americans are feeling about prices and paychecks.
Adding to the noise, Fed officials Williams, Jefferson, and Miran are scheduled to speak. Expect markets to hang on every word, as if one of them might accidentally say “rate cut.”
India Watch: Trade Talks & Banking Tweaks
Back home, Commerce Minister Piyush Goyal said that India–US trade negotiations are “going very well”, though several “sensitive and serious” issues remain. Translation: progress, but not quite popcorn-worthy yet.
Meanwhile, the RBI kept its steady hand on the rupee, continuing its interventions to avoid any wild FX swings. The RBI also reaffirmed its cap on voting rights for large bank shareholders, a reminder that no matter how big you are, in Indian banking, you still don’t get to call all the shots.

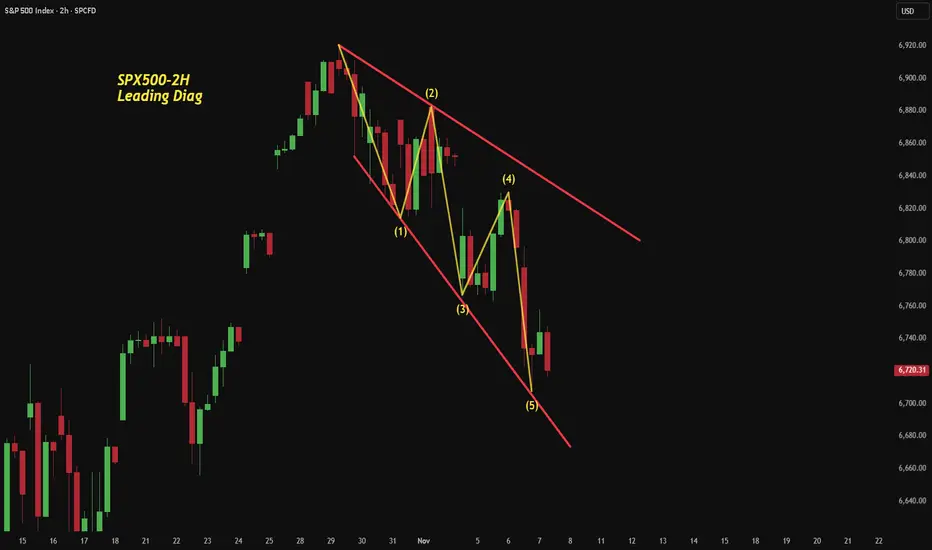
SPX500 – 2H: A Leading Diagonal from the Top?The S&P 500’s 2-hour chart may have just carved a leading diagonal right off the all-time high — a structure often seen at the start of a major new trend.
Each leg fits the contracting wedge geometry:
Wave (1) and (4) overlap, Wave (5) throws slightly under the boundary, and momentum stays fierce through the end — almost too fierce for comfort.
What makes this one interesting is the absence of RSI divergence at the final leg.
That raises the question — is Wave (1) really done, or does it have one last flush before a sharp Wave (2) retracement begins?
For now, watch how price reacts around the 6,760–6,800 zone.
A strong recovery through 0.618–0.786 of the drop would confirm the diagonal and set up a critical test of the broader bearish sequence.
Disclaimer: This analysis is for educational purposes only and does not constitute investment advice. Please do your own research (DYOR) before making any trading decisions.