


From Bullish to Bearish: Coal India's Next MoveCurrently, Coal India has shifted its overall structure from a bullish trend to a bearish one. This transition indicates a significant change in market sentiment, suggesting that the strength which previously propelled the stock upwards has weakened. Now, the stock is exhibiting consolidation — movi

/
The best trades require research, then commitment.
$0 forever, no credit card needed
Where the world does markets
Join 100 million traders and investors taking the future into their own hands.

Falling Wedge Breakout with Bullish Structure | 15-Min Chart🏦 HDFC BANK LTD – Falling Wedge Breakout with Bullish Structure | 15-Min Chart
📅 Date: April 25, 2025
📈 Timeframe: 15-Minute
🔍 Stock: HDFC Bank Ltd (NSE)
📌 Technical Overview:
HDFC Bank is showing signs of a potential bullish reversal on the 15-minute chart, forming a falling wedge pattern, which i

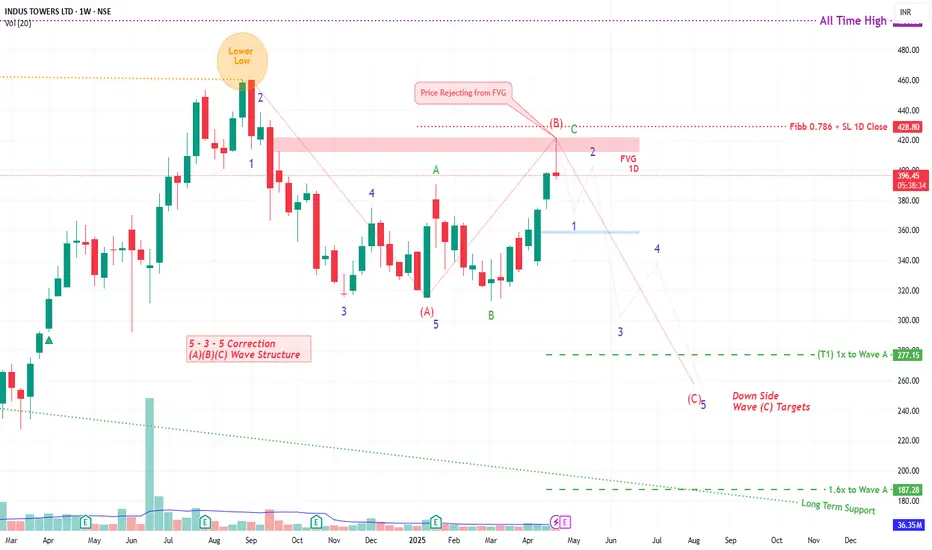
INDUS TOWER By KRS Charts25th April 2025 / 9:40 AM
Why INDUSTOWER??
1. Stock was reached its near ATH level but not able to hold the levels in Sep 2024 . From this point to today it seems like bullishness is getting weaker.
2. Wave Theory is saying Correction Wave ABC is ongoing and C is likely Started .
3.
L&T Finance - Getting ready for a blast L&T Finance is just short of a Breakout with Volume at the neckline. The short term and long term price action charts are also indicating the trend.
Due to following L&T Finance can head for first taget of INR 960 on a long term basis should the breakout occur.
1) 50 DMA will turn > 200 DMA
2) Pri

Channel breakout for buy in APLAPOLLOThis is a channel breakout strategy for APLAPOLLO TUBES. RSI has been giving bullish signals, which means a breakout and retest of 1624 will activate a buying entry for the targets mentioned above. The ultimate target as per the pattern is 2024 in the longer term.
Targets in between are the recent

JUBLFOOD - DTFJUBLFOOD has returned from an old demand zone, making VCP pattern, need more contraction near supply zone, moving above 20ema.
Above 720 it looks good.
If you like my analysis, please follow me as a token of appreciation :)
in.tradingview.com/u/SatpalS/
For learning and educational purposes o

Hindware - Keep On WatchCMP 200 on 22.04.25
The stock price has dropped more than 60% since August 2023. This time, it has been consolidating in a narrow range for the last two months.
If it gives a move upside after this consolidation, we may see the price of 245,345 or even more.
One should buy wisely in the range of 200

FORCEMOT Price action **Force Motors (FORCEMOT) Price Analysis – April 21, 2025**
**Current Price:** ₹9,229
**Trend:** Strong uptrend, up 40% in the past three months.
**Support:** ₹8,700–₹8,900
**Resistance:** ₹9,270 (previously ₹10,272, the 52-week high).
**Outlook:** Bullish above ₹9,000. A breakout above ₹9,270 coul

Unimech Aerospace cmp 1075 by Daily Chart view since listedKeep an eye on this stock counter for probable Resistance Zone Breakout
Unimech Aerospace cmp 1075 by Daily Chart view since listed
- Support Zone 960 to 1000 Price Band
- Bullish "W" or Double Bottom as one sees at 850 to 865 Price Band
- Gap Down Opening acting as Resistance Zone 1075 to 1135

RCF is in bullish mode.RCF is forming evening star candle stick pattern on monthly chart.
As per chart it may test 240 soon as it is previous high level.
Returns around 78%.
As per report upcoming monsoon session will be better than expectation.
It is in Demand zone can long it for next 2-4 months.

See all editors' picks ideas
Elastic Volume-Weighted Student-T TensionOverview
The Elastic Volume-Weighted Student-T Tension Bands indicator dynamically adapts to market conditions using an advanced statistical model based on the Student-T distribution. Unlike traditional Bollinger Bands or Keltner Channels, this indicator leverages elastic volume-weighted averaging
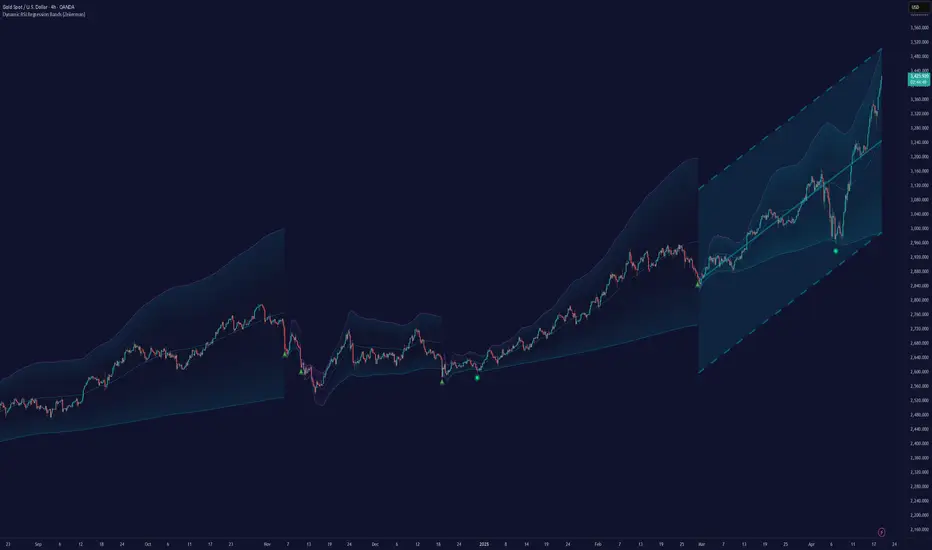
Dynamic RSI Regression Bands (Zeiierman)█ Overview
The Dynamic RSI Regression Bands (Zeiierman) is a regression channel tool that dynamically resets based on RSI overbought and oversold conditions. It adapts to trend shifts in real time, creating a highly responsive regression framework that visualizes market sentiment and directional
The Mayan CalendarThis indicator displays the current date in the Mayan Calendar, based on real-time UTC time. It calculates and presents:
🌀 Long Count (Baktun.Katun.Tun.Uinal.Kin) – A linear count of days since the Mayan epoch (August 11, 3114 BCE).
🔮 Tzolk'in Date – A 260-day sacred cycle combining a number (1–

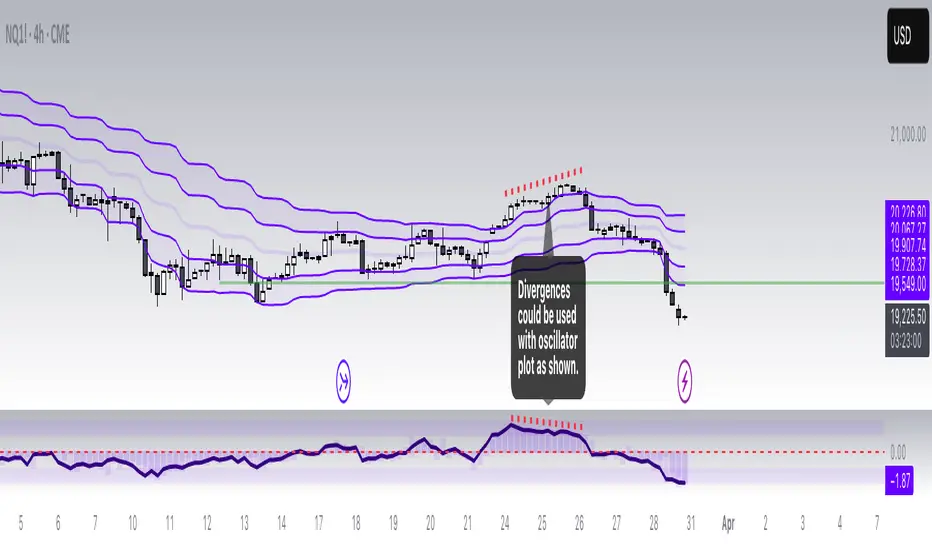
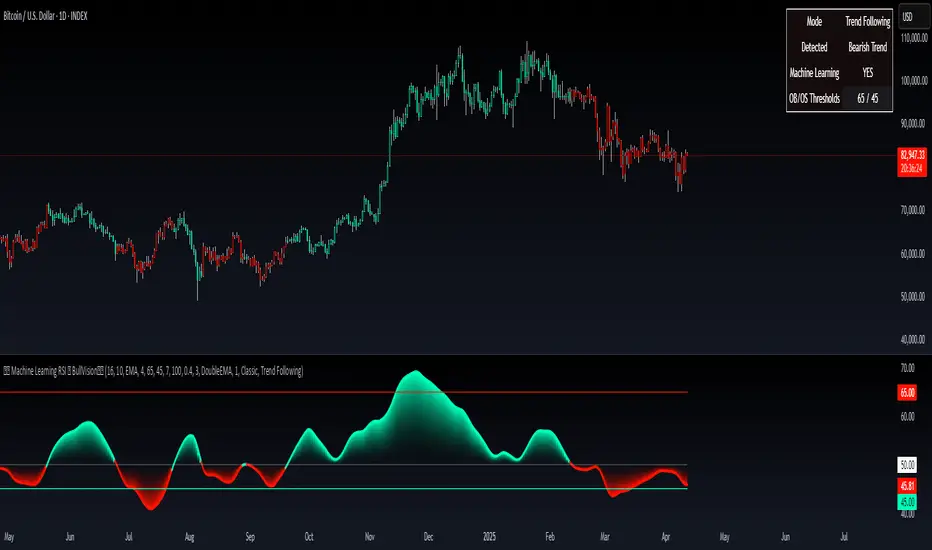
Machine Learning RSI ║ BullVisionOverview:
Introducing the Machine Learning RSI with KNN Adaptation – a cutting-edge momentum indicator that blends the classic Relative Strength Index (RSI) with machine learning principles. By leveraging K-Nearest Neighbors (KNN), this indicator aims at identifying historical patterns that resembl
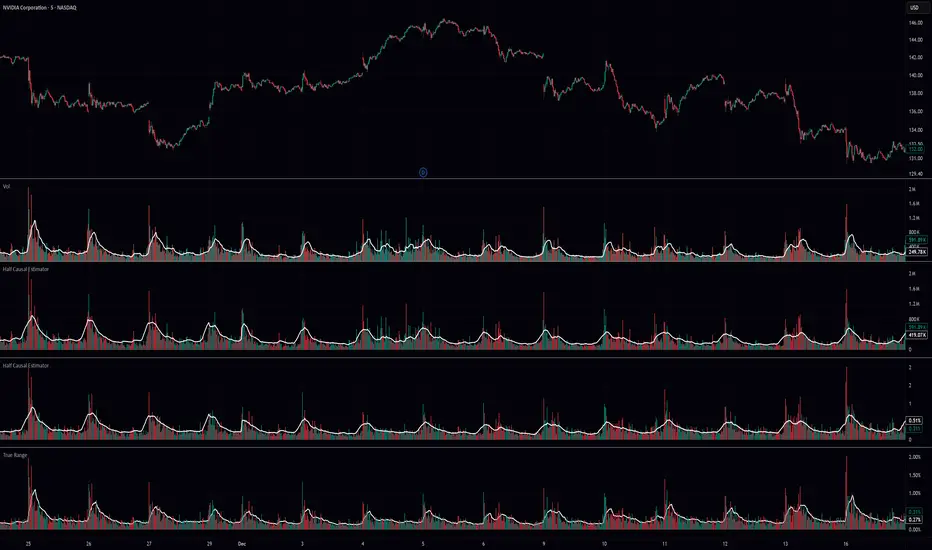
Half Causal EstimatorOverview
The Half Causal Estimator is a specialized filtering method that provides responsive averages of market variables (volume, true range, or price change) with significantly reduced time delay compared to traditional moving averages. It employs a hybrid approach that leverages both historica
BIN Based Support and Resistance [SS]This indicator presents a version of an alternative way to determine support and resistance, using a method called "Bins".
Bins provide for a flexible and interesting way to determine support and resistance levels.
First off, let's discuss BINS:
Bins are ranges or containers into which your

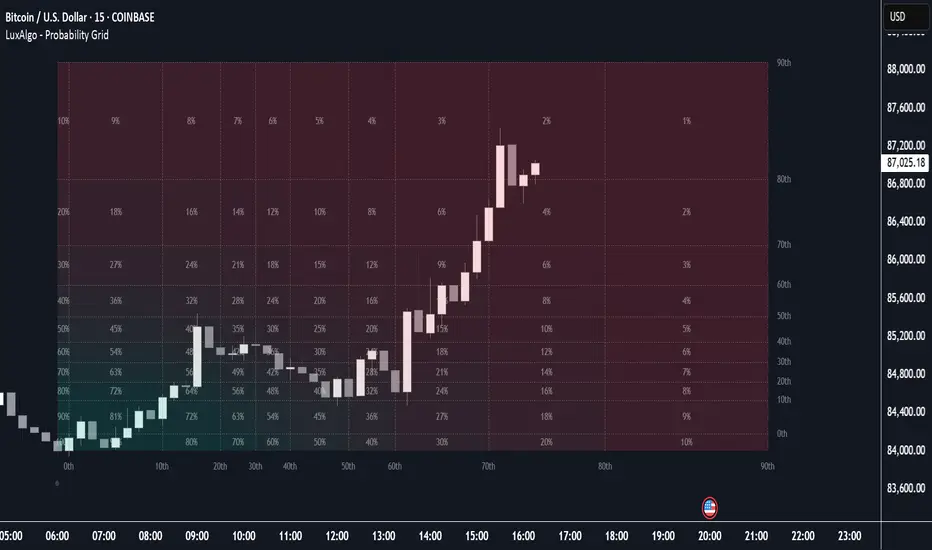
Probability Grid [LuxAlgo]The Probability Grid tool allows traders to see the probability of where and when the next reversal would occur, it displays a 10x10 grid and/or dashboard with the probability of the next reversal occurring beyond each cell or within each cell.
🔶 USAGE
By default, the tool displays deciles
Correlation Heatmap█ OVERVIEW
This indicator creates a correlation matrix for a user-specified list of symbols based on their time-aligned weekly or monthly price returns. It calculates the Pearson correlation coefficient for each possible symbol pair, and it displays the results in a symmetric table with heatmap

Tetris with Auto-PlayThis indicator is implemented in Pine Script™ v6 and serves as a demonstration of TradingView's capabilities. The core concept is to simulate a classic Tetris game by creating a grid-based environment and managing game state entirely within Pine Script.
Key Technical Aspects:
Grid Representation:

Log Regression Oscillator Channel [BigBeluga]
This unique overlay tool blends logarithmic trend analysis with dynamic oscillator behavior. It projects RSI, MFI, or Stochastic lines directly into a log regression channel on the price chart — offering an intuitive way to detect overbought/oversold momentum within the broader price structure.

See all indicators and strategies
Community trends
INDUS TOWER By KRS Charts25th April 2025 / 9:40 AM
Why INDUSTOWER??
1. Stock was reached its near ATH level but not able to hold the levels in Sep 2024 . From this point to today it seems like bullishness is getting weaker.
2. Wave Theory is saying Correction Wave ABC is ongoing and C is likely Started .
3.
From Bullish to Bearish: Coal India's Next MoveCurrently, Coal India has shifted its overall structure from a bullish trend to a bearish one. This transition indicates a significant change in market sentiment, suggesting that the strength which previously propelled the stock upwards has weakened. Now, the stock is exhibiting consolidation — movi
Falling Wedge Breakout with Bullish Structure | 15-Min Chart🏦 HDFC BANK LTD – Falling Wedge Breakout with Bullish Structure | 15-Min Chart
📅 Date: April 25, 2025
📈 Timeframe: 15-Minute
🔍 Stock: HDFC Bank Ltd (NSE)
📌 Technical Overview:
HDFC Bank is showing signs of a potential bullish reversal on the 15-minute chart, forming a falling wedge pattern, which i
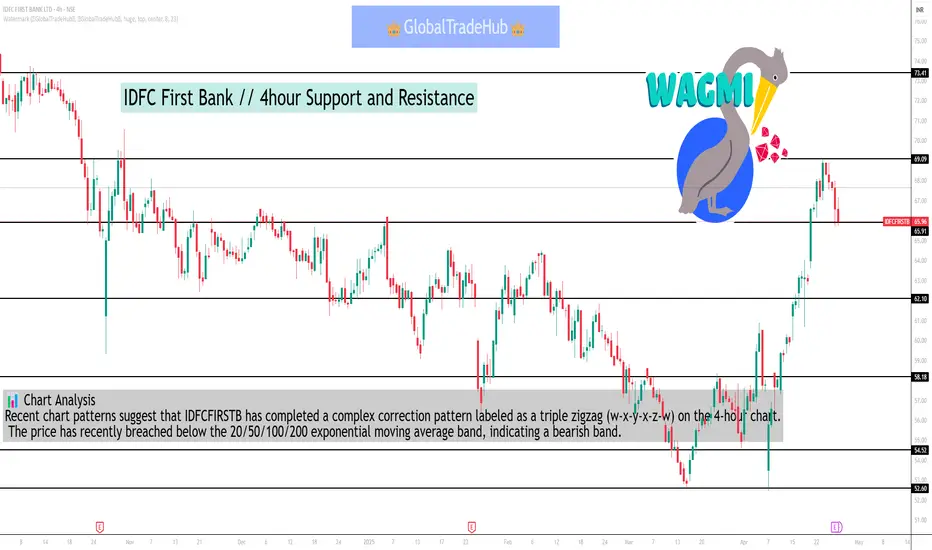
IDFC First Bank // 4hour Support and Resistance📈 4-Hour Support & Resistance Levels
Based on recent intraday analysis, the key support and resistance levels for IDFCFIRSTB on a 4-hour chart are:
Support Levels:
₹59.89 (S1)
₹59.15 (S2)
₹58.17 (S3)
Resistance Levels:
₹61.61
₹62.59
₹63.33
These levels are derived from the recent price ac
BUY TODAY SELL TOMORROW for 5%DON’T HAVE TIME TO MANAGE YOUR TRADES?
- Take BTST trades at 3:25 pm every day
- Try to exit by taking 4-7% profit of each trade
- SL can also be maintained as closing below the low of the breakout candle
Now, why do I prefer BTST over swing trades? The primary reason is that I have observed that

ULTRACEMCO BREAKOUT Possibility Ultracemco stock hits high multiple times and breaks to reach higher high. The following pattern can be seen now, there is high possibility it will breakout if the results are positive.

SFL LONGThe Elliott Wave Theory's description of the structure and pattern of price movements in financial markets is known as the Elliott Wave Structure.
The Elliott Wave analysis indicates that the stock has completed impulse waves (i),(ii),(iii),(iv) and (v) and corrected wave (a, b and c), which are sh

Tanla Platforms LtdDate 25.04.2025
Tanla Platforms
Timeframe : Weekly Chart
Results :
Q4 CONS NET PROFIT 1.17B RUPEES VS 1.3B (YOY); 1.18B (QOQ)
TANLA PLATFORMS: Q4 REVENUE 10.2B RUPEES VS 10B (YOY)
TANLA PLATFORMS: Q4 EBITDA 1.63B RUPEES VS 1.6B (YOY)
Q4 EBITDA MARGIN 15.96% VS 15.96% (YOY)
Pros
Company is

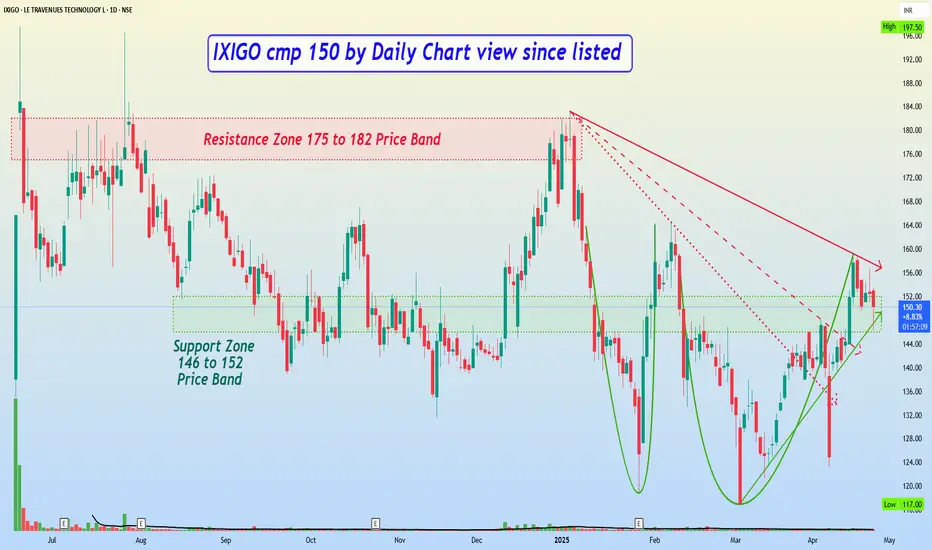
IXIGO cmp 150 by Daily Chart view since listedIXIGO cmp 150 by Daily Chart view since listed
- Support Zone 146 to 152 Price Band
- 1st Resistance Zone 163 to 168 Price Band
- 2nd Resistance Zone at 175 to 182 Price Band
- Volumes increase is needed for Resistance Zones Breakout
- Rising Support Trendline has been respected except for today fl
WAAREERTL Channel Breakout 26/04/2025NSE INDIA, Symbol : WAAREERTL Timeframe : Daily. WAAREERTL 25/09/2024 make to 2070 then continue down channel trade.17/04/2025 break the channel and sustains above the channel. Today price near entry level. Target is 1470 and second target is 1820

See all stocks ideas
Today
BEPLBHANSALI ENG. POLYMERS LTD
Actual
—
Estimate
—
Today
ASALCBRASSO ALCOHOLS & BREW LTD
Actual
—
Estimate
—
Today
UGROCAPUGRO CAPITAL LTD
Actual
—
Estimate
4.90
INR
Today
SBFCSBFC FINANCE LTD
Actual
—
Estimate
0.90
INR
Today
MRPLMRPL
Actual
—
Estimate
0.10
INR
Today
AVANTELAVANTEL LTD
Actual
—
Estimate
—
Today
INDIACEMTHE INDIA CEMENTS LTD
Actual
—
Estimate
−5.60
INR
Today
IDFCFIRSTBIDFC FIRST BANK LTD
Actual
—
Estimate
0.52
INR
See more events
Community trends
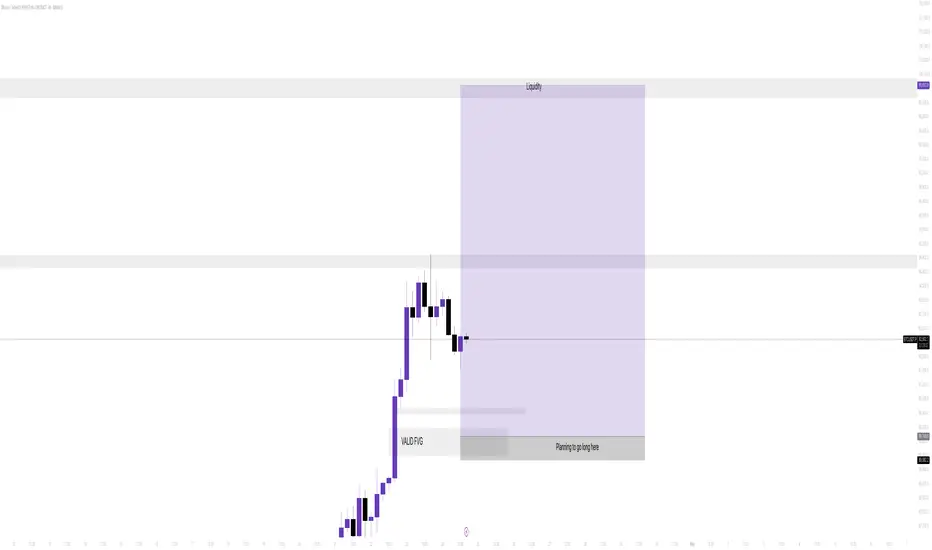
Waiting for bitcoin to fill this FVGI’m currently watching Bitcoin closely as it approaches a fair value gap. I’m waiting for that gap to get filled to find a high-probability long entry.
If the setup aligns, I’ll enter and aim to hold the trade until the next liquidity zone — targeting a solid move with patience.
However, if the pr
BTC ANALYSISLooking for Long Position on a DIP to $88700 zone or Breakout of 94700 so inshort BTC is stuck in range of 6000 Pts. Hopefully the breakout will be very strong.
Keep a watch 2 probabilities already mentioned on chart.
Disclaimer: We are SEBI & NISM Certified but not registered hence do your own

BTCUSD 1H SHORT SET UP WITH 1:2 RRHello traders, here in BTC after giving good upside rally btc is forming double top formation Trend is strong uptrend still we will try to catch this short setup if it's works my previous set ups works perfectly let's see what happens in this one as well 😉
For shorting one can see if 1h candle clos

Bitcoin looks bullish BTC looks bullish with volume and ascending in price , given with targets and safe exits, Just for educational purpose

BTCUSD WEEKELY ANALYSISBTC/USD Outlook – Weekly Timeframe
Bitcoin is currently showing bullish momentum, trading near the $95,000 mark. A few months ago, BTC broke out of a cup and handle pattern on the upside and rallied to a new high of $110,000.
After reaching that high, it retested the liquidity zone near $77,000, wh

AVAX Trade Setup – Waiting for Pullback EntryThe total crypto market has hit a key resistance zone, and many altcoins, including AVAX, are showing signs of exhaustion after recent rallies. AVAX surged from $14.00 to $23.00, and a pullback to support could offer a prime long entry.
📍 Entry Zone:
$20.00 – $21.00 (Area of support)
🎯 Take Profi

Ethereum holding buy from 1590 , 2350 -2430 upside Target How to take trades using Harmonic pattern projection Trade setup is explained below :-
Entry : 1st SL point : 0% is recent top or bottom.
Trailing D: 15.1% is work as trailing SL of buy or sell trade if hit then we have to book profit
.If price goes below 2nd D 22.5% to 24.5% range then early

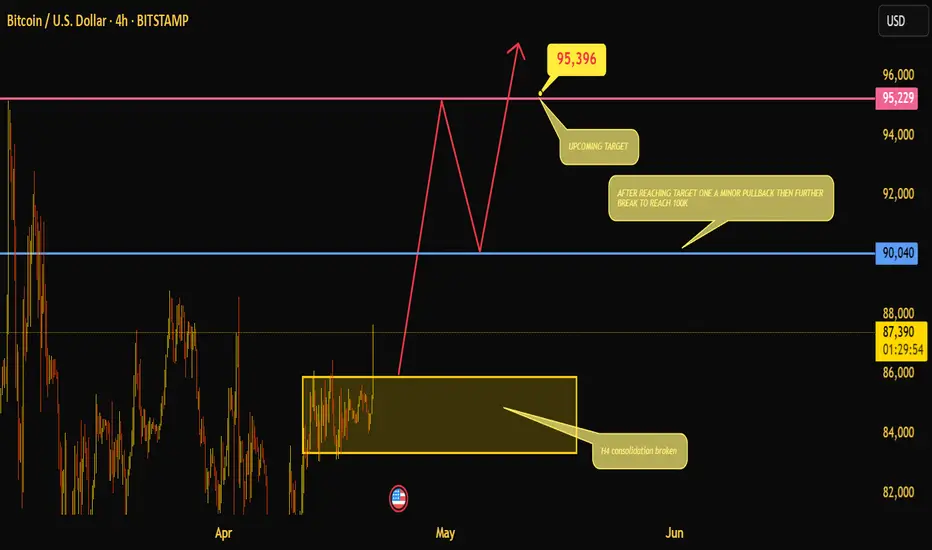
Bitcoin Breaks Out: Eyes Set on $95K, Path Open to $100KBitcoin has broken out of a well-defined H4 consolidation zone, signaling the end of a multi-week range and the beginning of a potential impulsive move. The breakout above the 87,000 region hints at bullish momentum building up, targeting the next key resistance around 95,396, which aligns closely w
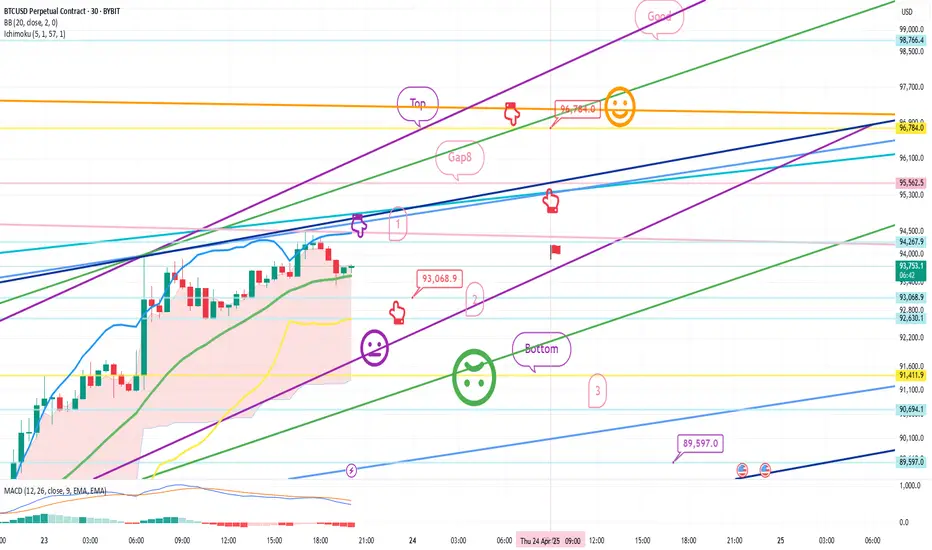
Bitcoin Bybit chart analysis April 23Hello
It's a Bitcoinguide.
If you have a "follower"
You can receive comment notifications on real-time travel routes and major sections.
If my analysis is helpful,
Please would like one booster button at the bottom.
Yesterday, after a long time, the participation rate on TradingView was good
DeGRAM | BTCUSD Flipped the Resistance Zone📊 Technical Analysis
BTC holds the reclaimed 90-91k zone; staying > $91 500 keeps 98k then 108k in view.
💡 Fundamental Analysis
• Spot ETFs drew $381 M (21 Apr), $936 M (22 Apr) and $912 M (23 Apr) net inflows.
• Network hashrate hovers near the 1 000 EH/s ATH
• MicroStrategy lifted its stack t

See all crypto ideas
HEAD & SHOULDERS IN GOLD - WATCH THAT NECKLINESymbol - XAUUSD
CMP - 3288
Gold, after a sharp decline, is now trading and consolidating at important levels. The recent movement follows a strong sell-off as geopolitical and tariff-related issues between the US and China began to ease. This decline pushed gold back from its all-time high of 3500


Bearish Setup in Gold: Breakdown Confirmed with Strong Volume!Hey, what's up Traders! I’ve been watching Gold closely, and it seems like we’re seeing a descending channel setup. After hitting the top, it’s now testing the lower boundary. If Gold can't hold this support level, we could see a nice downward move. The entry range I’m eyeing is around 3275-329

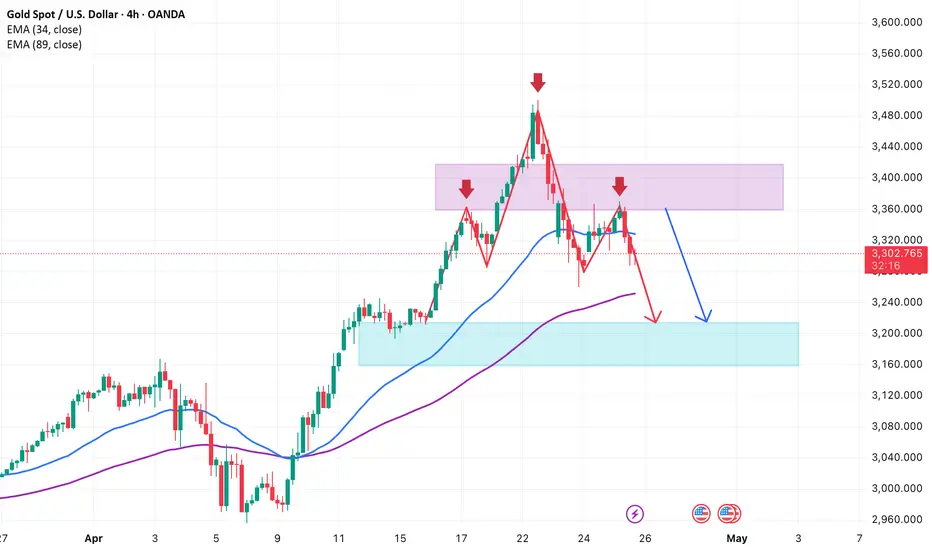
Gold forms a top patternOn the H4 chart, the gold price chart is forming a clear bearish structure after forming a three-peak pattern in a row around the $3,435–$3,470 range. Each time the price touches this range, it is strongly rejected, indicating that selling pressure controls the market. The fact that the price cannot
Day Trade Analysis – 25-04-2025Gold is showing clear signs of weakness after forming a strong double top near the 3368 level, which has now established itself as a firm resistance zone. The recent price action broke below the highlighted liquidity zone, confirming bearish intent. The failed attempt to reclaim the liquidity area s

gold retracementGold spot prices are showing signs of strength after dipping into the $3190 liquidity zone and holding firm. The bearish momentum has stalled as price tapped into a key area of interest, suggesting that smart money may have engineered a liquidity sweep to fuel a potential bullish reversal.

Gold setup - xauusdIdentified a trend reversal zone at 3290 — price closed below it, confirming the break of structure and signaling a potential trend shift as the higher low was taken out.
After that, we saw a quick pullback move, which looks like a liquidity grab or a fakeout to the upside, trapping late buyers.
N

XAU/USDPrice action trading is a methodology where traders make decisions based on the interpretation of actual price movements on a chart, rather than relying primarily on lagging indicators. It involves observing and analyzing candlestick patterns, trend lines, support and resistance levels, and volume t

GOLDHello & welcome to this analysis
GOLD is giving a hourly H&S breakdown suggesting targets of $3134 (Comex) / 91000 (MCX) with a pause near $3190 / 92750

Gold Technical Analysis, April 25
📊This week, the trend of gold has been ups and downs, and the price has been running in a high volatility range. At present, the market is fiercely competing around the cross candlestick pattern as the weekly line is about to close. If it finally closes at a low level, it may indicate that the gold

See all futures ideas
EURAUD EYES A REBOUND - CAN THE BULLS HOLD THE SUPPORT?Symbol - EURAUD
Amid a broader global bullish trend, the EURAUD pair is currently undergoing a corrective phase, approaching the support zone of the established trading range. Market participants are observing efforts by buyers to defend the 1.7750 level.
The pair remains within a broad consolidat

Trade Recommendation – USDCAD Buy Position (30-Minute Chart)PAIR: USDCAD
TRADE TYPE: BUY
TIMEFRAME: 30-Minute (M30)
ANALYSIS TIME: 10:35 AM, April 25, 2025 (UTC+7)
STRATEGY: Trend-following + EMA33 (High/Low) + Pullback Signal
✅ Trade Setup:
Entry: BUY around 1.3865
Stop Loss (SL): 1.3838
Take Profit (TP): 1.3957
Risk-Reward Ratio: 1:3.2 (high reward-to-


GBPJPYPrice action trading is a methodology where traders make decisions based on the interpretation of actual price movements on a chart, rather than relying primarily on lagging indicators. It involves observing and analyzing candlestick patterns, trend lines, support and resistance levels, and volume t

Buy Trade - USD/CHFGreetings to everyone!
Place a buy trade on USD/CHF and check out my chart for the ideal entry, stop-loss & target placement.
Remember :-
* Move your SL to breakeven once the trade reaches 1:1.4 R.
* Aim for a minimum reward of 1:1.5 R.
* Don't risk more than 3% of your total margin.
Let's exe

Eurjpy bullishA lot of buy side liq stacking above on buy side,
Buy limit at ....63 price level as marked
Risk 1% goofpd profit .

EURUSD at good resistance! As wee see, EURUSD is facing the resistance on weekly time frame. So it can be a perfect short till 1.10000.
As per techincal analysis, inverted hammer pattern is formed on the chart. So, it may be fine to short it.

"EUR/USD Bullish Setup: Demand Zone Bounce with 205+ Pip Target Current Price:
1.13894 ⚪️ (hovering just above EMA)
Zones & Key Levels:
🔵 Demand Zone (Strong Buy Area)
▪️ 1.13059 – 1.13580
Price bounced here!
➡️ Buyers stepping in!
⚫ Support (Old Resistance, New Support)
▪️ Just above 1.13580
➡️ Important to hold this level for bulls
🟠 Stop Loss
▪️ 1.13059
⚠

GBP/USD Rebounds as Tariff Fears EaseThe GBP/USD pair climbed to around 1.3270 on Thursday, snapping a two-day losing streak. The recent softening in concerns over potential tariff threats from U.S. President Donald Trump triggered some selling pressure on the U.S. dollar, offering a short-term lift for the pound. The move suggests a p

GBP/USD at a Turning Point – Correction Pattern in PlayIt appears that the corrective Wave A in the GBP/USD pair is nearing completion, and the formation of Wave B may be underway. The Wave 1 to 5 structure seems to have been completed, indicating the beginning of an A-B-C corrective phase.
If the correction unfolds as expected, potential upside target

See all forex ideas
| - | - | - | - | - | - | - | - | ||
| - | - | - | - | - | - | - | - | ||
| - | - | - | - | - | - | - | - | ||
| - | - | - | - | - | - | - | - | ||
| - | - | - | - | - | - | - | - | ||
| - | - | - | - | - | - | - | - | ||
| - | - | - | - | - | - | - | - | ||
| - | - | - | - | - | - | - | - | ||
| - | - | - | - | - | - | - | - |
Trade directly on the supercharts through our supported, fully-verified and user-reviewed brokers.


