Buy Action Construction Equipment Short Term Trading Advice by Goodluck Capital
Buy Action Construction Equipment
Buy Range- 1500 - 1550
Target- 1700 - 1750
StopLoss- below 1400
Potential Return- 11-15%
Approx trade duration 12 - 14 days
ACE trade ideas

ACTION CONSTRUCTION TGT 1695-1740-1890 SL BELOW 1256 POSITIONALAction Construction Equipment Ltd. is an interesting chart with following
FUNDAMENTALS:
Company is almost debt free.
Company is expected to give good quarter
Company has delivered good profit growth of 24.9% CAGR over last 5 years
Debtor days have improved from 45.9 to 28.6 days.
caution: Promoter holding has decreased over last 3 years: -3.29%
TECHNICALS.
1. RSI on all time frames (DWM) above 60
2. Stock Strongly outperforming Benchmark index and sectoral index
3. Both SRS and ARS above zero
4. Close within 52 Week High Zone
5. Stock making higher highs for last 3 consecutive trading days
6. Higher Trader and Delivery quantity this week
7. ABCD pattern under formation on weekly chart
8. Narrowing Bollinger Bands on daily chart
9. Price crossed above and is taking support at 20 SMA on daily chart
can be a good risk reward to buy and buy on dips with stop loss below 20 SMA for an immediate resistance at 1695 being ATH zone and thereafter for a Blue Sky zone as per one's own risk reward matrix
Lets See How it evolves.
Disclaimer: NOT A BUY / SELL RECOMMENDATION I am not an expert I just share interesting charts here for educational purpose and not to be taken as buy/sell recommendation. Please seek expert opinion before investing and trading as trading/ investing in market is subject to market risks. I do not hold any position in the stock as on date but I may look to buy on dips with my own Risk Reward matrix.

ACE ready to ACE again !ACE is all set for another fancy breakout towards 1450-1500 range. Buy right hold tight.

Action Construction Equipment 📈 Any weekly closing above that Red line could be bullish 📈 📈 to 4067 (21st July 2025) or to that Green arc marked on the chart
Disclaimer:
Its a personal view not a financial advise and I assume no responsibility and liability whatever outcome arises

🎯 Unveil the power of Demand Zones with ACE! Catch the wave📊 Fundamental Key Points:
Action Construction Equipment Ltd engages in manufacturing and marketing hydraulic mobile cranes, tower cranes, construction equipment, and agricultural machinery. The company offers a diverse product portfolio to meet various customer requirements.
Financials: Market Cap ₹17,094 Cr, Current Price ₹1,428, Stock P/E 61.7, ROCE 26.2%, ROE 18.8%.
Pros: Debt-free status, expected good quarterly performance, consistent profit growth of 24.9% CAGR over 5 years, improved debtor days.
Cons: Trading at 16.4 times its book value, decrease in promoter holding over the past 3 years.
Peer Comparison: Compared to peers in the Capital Goods sector, ACE shows favorable metrics like ROCE at 26.17% and solid profit growth.
Quarterly Results: Dec 2023: Net Profit ₹88 Cr, EPS ₹7.41, reflecting positive growth trends over the quarters.
Balance Sheet: Shows steady growth in assets over the years, with a well-managed debt profile.
Shareholding Pattern: Promoters hold majority stake, with FIIs and DIIs showing consistent interest over time.
*️⃣ Understanding the Basics - Technical Analysis
First, let's break down some key terms you'll encounter in this analysis:
RBR Zones (Rally Base Rally): This pattern signifies an upward price movement, followed by a period of consolidation (stabilization without significant price changes), before another upward movement occurs.
Demand Zone: A price area where buyers tend to enter the market, causing the price to increase.
Bullish Pin Bar Candle: A type of candlestick that indicates a potential reversal of a downward trend to an upward trend.
📈 In-Depth Analysis of ACE
ACE is currently trading in a very significant area, known as a Demand Zone. This zone is not just any area on the chart; it's a powerful RBR Zone formed on both the daily and weekly charts. Here’s why this is crucial:
The formation of the RBR zone was followed by the price reaching all-time highs accompanied by high volume, showing strong buying interest.
Currently, the price has retraced back to this zone, accompanied by low volume, which could mean a potential reversal or continuation of the upward trend.
Yesterday's price action closed with a Bullish Pin Bar Candle right at the Demand Zone, which often signals a turning point.
💹 Key Trading Strategy
For those looking to trade ACE, here’s a straightforward approach:
Entry Point: Current Market Price (CMP) at 1428.
Stop Loss (SL): Below 1340, to protect against unexpected downward movements.
First Target: Aim for 1600 as an initial profit target.
Risk Management: Consider trailing your stop loss to lock in profits as the price moves favorably.
Disclaimer:
This analysis is for educational purposes only. I am not a SEBI registered analyst. Please do your own research or consult a financial advisor before making investment decisions.
Concluding Thoughts
Thank you for your engagement and feedback. Remember, trading is a journey of continuous learning and application. Feel free to ask questions or share your thoughts on this analysis!
"In trading, as in life, the risk you take is a measure of the success you seek. 🚀"

ACE is one candle away from the next rallyACE has always moved as expected and this time multiple factors are indicating another rally before this month's end, one green candle tomorrow will do the job.

ACE clean breakout with volumeACE after being in sqeezing did a clear b/o, in watchlist for next few days

Rectangle Pattern Breakout Daily timeframe - volume buildup is significant good enough.
Rectangle pattern breakout with good volume buildup.
Support taken from 50EMA- midterm is bullish.
NOTE: I do my analysis, do your before trade.

trendline breakout daily and weekly trendline breakout good volume ,weekly breakout tanget and stoploss around 5%


ACE - Breakout Setup, Move is ON..NSE:ACE
✅ #ACE trading above Resistance of 1440
✅ Next Resistance is at 1800
Related charts:
Charts are self-explanatory. Levels of breakout, possible up-moves (where stock may find resistances) and support (close below which, setup will be invalidated) are clearly defined.
Disclaimer: This is for demonstration and educational purpose only. This is not buying or selling recommendations. I am not SEBI registered. Please consult your financial advisor before taking any trade.

ACE- Expect 10 % breakout jioACE- Expect 10 % breakout jio
1) Seems to Bullish indicatin
2) Lets see it goes through roof
3) Lets see

ACE - Long Setup, Move is ON..NSE:ACE
✅ #ACE trading above Resistance of 948
✅ Next Resistance is at 1440
Related charts:
Charts are self-explanatory. Levels of breakout, possible up-moves (where stock may find resistances) and support (close below which, setup will be invalidated) are clearly defined.
Disclaimer: This is for demonstration and educational purpose only. This is not buying or selling recommendations. I am not SEBI registered. Please consult your financial advisor before taking any trade.

Go Long - ACEAction Construction Equipment - ACE - Showing good momentum in short term and beautiful breakout today.
Risk: Reward - ATR - 2: 4

Fundamentally StrongEducation Purpose Only..
This Stock is making Higher Highs and Strong Breakout..
Fundamentally super Strong... Very Bullish..

Strong Breakout - Continue the previous trendBreakout with strong volume -
1. 5 mo uptrend
2. Flag breakout awaited
3. Sideways for more than 2 mo
4. Falling volume during sideways - accumulation
5. Respects 50 DMA for support

BUY--Darvas dox breakout and retest
--flag and pole pattern near breakout region
--Target 1000
Disclaimer:
- The view expressed here is my personal view
- Any decision you take, you need to take responsibility for the same
- It's your hard earned money. Treat it wisely
- Trade / Invest keeping in mind your trading style, goals and objectives, time horizon & risk tolerance
-- Do your own analysis and consult your financial adviser if needed

ACE looking goodBreak out of consolidation and has closed at ATH. This might be start of next uptrend

consolidation breakout trading opportunity stock in up-trend
the stock has broken out from consolidation in a weekly timeframe with volume
entry above the line
for-profit trail with daily pivot or 21-day moving average
stop below the line
the stock transition from stage 3 to stage 2 (ref stan Weinstein's secrets for profiting from bull and bear markets)
( not buy-sell recommendations thus is for my own learning purpose only )

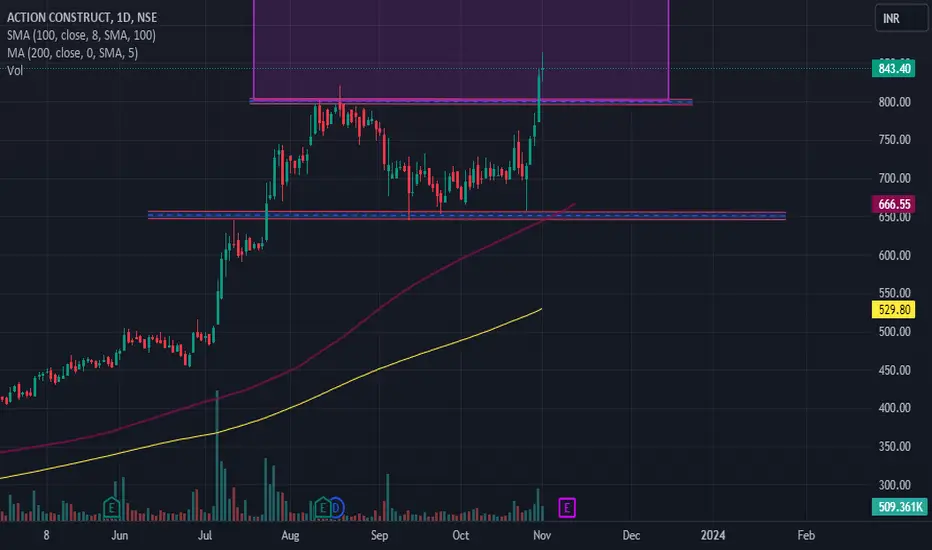
ACE coil systemEntry above 848-854
SL 787
Only for journaling not for the trading.
This post is for my personal use.
Note : only for learning, not a trading recommendation. i am posting as a trading journal before and after breakout.


ACE BO [Weekly]ACE moving up with volume after forming a 11 week base.
Prior to forming base showed classic accumulation by getting over extended. This might just be a good buy as it follows IBD template of David Ryan.

breakout donenow 800 is support if touch 800 mostlay time retest going to long and stoploss is 760 and traget is 960 breakout and volume is so good just check volume