[Swing Trade] BLUEDART looks promising after BOBLUEDART seems to be getting ready for some 5% up move..keep it under radar.. I dont recommend others to trade on my views.
Il wait for BO, volume build up and retracement
BLUEDART trade ideas

Monopoly Courier Stock given Breakout,Which has 54% Market ShareHello Everyone, I hope you all will be doing good in your Trading and life as well. I have brought another good stock, which has given breakout with good volume on weekly timeframe, Company is industry leader in their segment, Co. is a market leader in organized air express with a market share of 54% in FY21 v/s 45% in FY15. Co. is on 4th market position in Organized Ground Express with a market share of ~17%. Company name is Blue Dart Express Limited , incorporated in 1983, is involved in transportation and door-to-door distribution of time-sensitive shipments, through an integrated ground and air transportation network. The company is regarded as South Asia’s leading courier and integrated air express package distribution company.
STOCK HAS GIVEN BREAKOUT OF BULLISH TRIANGLE PATTERN
STOCK IS ABOVE 200-DEMA LINE
MACD IS GIVING BULLISH CROSSOVER
RSI ALSO INDICATING BULLISH CROSSOVER IN STOCK (I HAVE NOT PLACED RSI ON CHART, JUST DID MY ANALYSIS)
THINK FOR LONG TERM, STOCK IS GOOD TO DO SIP IN LONG TERM..
STOCK IS GIVING BEST ENTRY TO ENTER AND HOLD FOR LONG TERM.
Market Cap
₹ 17,081 Cr.
Current Price
₹ 7,198
High / Low
₹ 7,650 / 5,487
Stock P/E
56.7
Book Value
₹ 576
Dividend Yield
0.42 %
ROCE
19.9 %
ROE
23.6 %
Face Value
₹ 10.0
Industry PE
56.7
Debt
₹ 1,073 Cr.
EPS
₹ 127
Promoter holding
75.0 %
Intrinsic Value
₹ 1,255
Pledged percentage
0.00 %
EVEBITDA
19.9
Change in Prom Hold
0.00 %
Profit Var 5Yrs
27.3 %
Sales growth 5Years
10.7 %
Return over 5years
19.1 %
Debt to equity
0.78
Net profit
₹ 301 Cr.
ROE 5Yr
29.6 %
Profit growth
-16.0 %
PROS:-
Company has delivered good profit growth of 27.3% CAGR over last 5 years
Company has a good return on equity (ROE) track record: 3 Years ROE 35.1%
Company has been maintaining a healthy dividend payout of 25.4%
CONS:-
Stock is trading at 12.5 times its book value
Disclaimer:- Please always do your own analysis or consult with your financial advisor before taking any kind of trades.
Dear traders, If you like my work then do not forget to hit like and follow me, and guy's let me know what do you think about this idea in comment box, i would be love to reply all of you guy's.
Thankyou.

Bluedart: Triangle pattern breakoutFor education purposes only.
Breakout happens with the good upside move. This can fall to the mentioned level and can be bought at the mentioned level for the target of 7250.

Longterm Opportunity on Blue DartGo Long @ 6195.1.1 for Targets of 7060, 7550, and 8040 with SL 5700
Reasons to go Long :
1. On a Monthly timeframe if we draw the Fibonacci retracement tool from the recent swing low (point A) to the recent swing high (point B) then we see stock took support from the 0.5 Fibonacci level.
2. In addition to this a bullish candlestick pattern Bullish Hammer (marked with orange color) is formed around the 0.5 Fibonacci level.
3. Also there is a strong demand zone (marked with green color), from which the stock is taking support and moving up.
4. Also on a weekly timeframe stock has formed a double bottom (W) pattern.

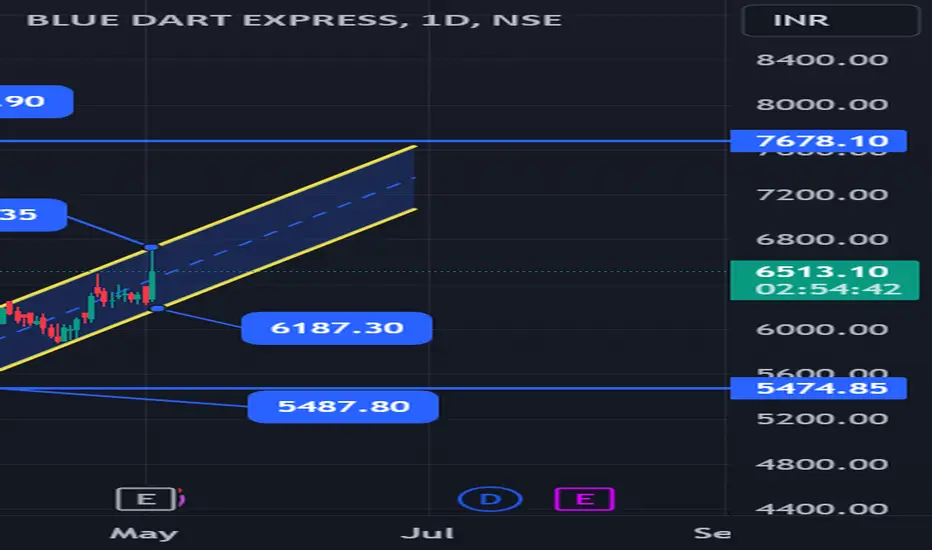
Bullish Channel Formation in Blue Dart with Strong Support LevelBullish Channel Formation in Blue Dart with Strong Support Levels
Body: The stock of Blue Dart is exhibiting a promising bullish channel pattern, suggesting an upward trajectory in the long term. The current support levels are firmly established at ₹6187 and ₹6731, providing a robust foundation for potential price appreciation.
Key Points:
Strong Support: The stock has consistently bounced off the ₹6187 support level, indicating solid buyer interest.
Resistance Break: A decisive move past the ₹6731 resistance could accelerate the uptrend.
Long-Term Target: If the bullish momentum continues, we might see the stock price reach as high as ₹7690 over an extended period.
Analysis: The technical indicators align with the bullish sentiment, as the stock is poised to continue its upward movement within the channel. Traders should monitor volume and price action closely for confirmation of the trend.
Conclusion: Blue Dart’s stock is on a path to potentially significant gains, with key support levels providing a safety net for investors. The long-term target of ₹7690 remains in sight, making it an attractive opportunity for those looking to capitalize on this momentum.
Remember to include a chart that illustrates the channel pattern and the mentioned price levels to provide a visual aid for your analysis. Good luck with your post! 📈
BLUEDART - Swing Trade Analysis - 20th April #stocksBLUEDART (1D TF) - Swing Trade Analysis given on 20th April, 2024
Pattern: CUP & HANDLE
- Volume Buildup at Resistance - Done ✓
- Resistance Breakout - In Progress
- Demand Zone Retest & Consolidation - In Progress
* Disclaimer
#bluedartexpress

BLUEDART reversing from supportBluedart price is revering from good support line.
last few session accumulating near support line and last session shown good green candle.
RSI cross above 30 & MACD cross over happened.
good indication for swing trade entry.
Entry - CMP
Target - previous resistance
Stoploss - Below support line

BlueDart Express - Daily Trendline Break - Target of 9600+BlueDart has breached its daily down trendline. We can see good volumes as well. The target here is 9600+. We can wait for a pull back and it should not breach the trendline. Other factors:
1. RSI is above 60
2. MACD is on the verge of making a green histograms
Good risk ratio on this trade.
"Clean Charts, Easy Charts"
Learning & Earning!!!
Cheers!!!

Blue dart - Ready for 20% breakoutAfter a year long consolidation Blue Dart is ready for a ride. The stock has started making higher lows and about to start making higher highs!
Blue Dart is soon reaching for its resistance of 7535 and it will breakout from there. But before the breakout it should retrace to its previous breakout level of 7080.
Keep an eye on the stock for its breakout at 7535. A retest to 7080 will see more accumulation in market and give opportunity to those who believe in going for value with a risk.
CMP 7384
Retest/retrace level: 7080
Breakout level: 7535
target: 9000 (20% from 7500)

I am expecting 8-10% move from hereBluedart have the potential for another 8-10% upside momentum. Amidst the Current Market Landscape, Every Indicator Points Towards a Favorable Trajectory, Positioning the Stock for Substantial Growth.

BLUEDART - Weekly AnalysisIn the Weekly Chart of BLUEDART ,
we can see that, After strongest W pattern breakout, it has gone side ways.
Now it has a Decision making candle.
Enter on breaking its High with Low as SL.
Possible momentums are shown in chart.


BLUEDART - Weekly AnalysisIn the Weekly Chart of BLUEDART ,
we can see that, It has now created a Halt Candle on Support Trendline.
If it breaks, enter on breaking its high with low as SL.

liquidity sweep Refer chart for details
Stock name : bluedart
Timeframe : 1hr
Higher time frame choch reversal done

BLUE DART EXPERESS BREAKDOWNNNNNNNNNNBreakdown not sooo solid buy small sl can short when it crosses low below the breakout candle on tuesday with 1:2 minimum take profit

bottom fish on higher waters1. structure change to LH-LL
2. entry can be planned for a retracement for 1:~2 RR
3. price reversed from pivotal support

BLUEDART LongStock looks good for a move up basis the lows being protected with volumes and good cash flow taking place
Levels plotted on the chat for reference

BLUEDARTBLUEDART:- Heavy selling has been seen in the stock but in the last two months, The stock is consolidating in a small range, if the stock gives a breakout and sustains above the resistance, there is a good movement to the upside. Keep your eye on it.
Hello traders,
As always, simple and neat charts so everyone can understand and not make it too complicated.
rest details mentioned in the chart.
will be posting more such ideas like this. Until that, like share and follow :)
check my other ideas to get to know about all the successful trades based on price action.
Thanks,
Ajay.
keep learning and keep earning.

Looking good in coming daysThe stock gave a parallel channel breakout, pulled back and again closed strong. Buy above 7735 for both intraday and positional further move.

Bluedart !!As narrow range is forming on daily chart(48 Points).Usually candle's range is 100 or more than 100 points. Bullish Diversion on RSI . Volume is getting Down.

BlueDart Weekly Breakdown - Short tradeNo fancy indicators or astro gann knowledge needed for this , just the Price action support and resistance formula would help to analyse a stock. This stock has broken the weekly support and closed below. One can go short for a target of 7680.

Blue dartBLUE DART: 2015-2016 BREAKOUT ON THE CHART. Looks good at CMP can give good return in mid to long term.

BLUEDART ROUNDING BOTTOMMakkale check Bluedart chart pattern and it breakout from rounding bottom pattern. Take decision as per your view.
