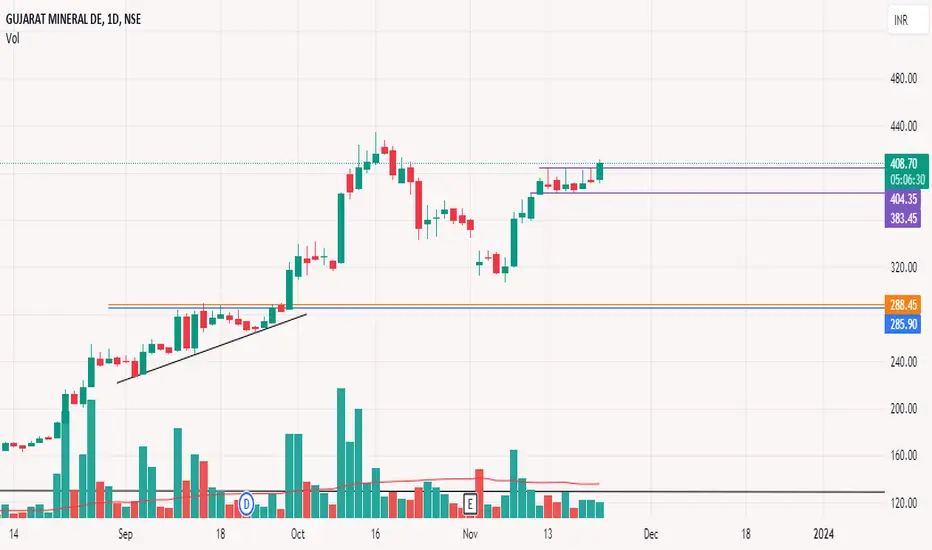
Stock is ready to fire NSE:GMDCLTD Stock near breakout zone. chart looks strong at this level. After 440 can expect good upside movement
GMDCLTD trade ideas

GMDC - TGT 502-550 DT 04.05.2024Gujarat Mineral Development Corporation Ltd. is an interesting chart with following
1. RSI on all time frames above 60
2. Narrowing Bollinger Bands on weekly chart
3. Price gain with Green Marubozu candle with high volume on daily chart
4. both SRS and ARS above zero
5. Close crossing last week's and last month's high
Attractive RIsk reward with major support near 402-415 zone and TGT 502-550 zone
lets see how it evolves
Disclaimer: NOT A BUY / SELL RECOMMENDATION I am not an expert I just share interesting charts here for educational purpose and not to be taken as buy/sell recommendation. Please seek expert opinion before investing and trading as trading/ investing in market is subject to market risks. I do not hold any position in the stock as on date but I may look to buy on dips with my own Risk Reward matrix.

gmdc ltd breakout with high volumestock : gmdc ltd (gujarat mineral development corporation ltd)
trade : long (cash segment)
buy @ 454 above
sl @ 419
target1 @ 500
target2 @ 540
note :
this information is for education only

What do you think of this swing trading approach?Hi TV community.
This view is based on my own approach to swing trading.
METHOD
Select 60 PSU stocks
Trade only on the Weekly Timeframe
Exit trade when price hits 6.8% over entry price. (The 6.8% corresponds to one year FD interest rate of SBI)
There is no concept of stop loss with this approach as we give 52 weeks time for the stock to hit TP level of 6.8%. In most cases, TP level will be hit well within that period.
OPPORTUNITIES
After taking out all trading holidays there are 50 weeks of opportunities every year. So, with 60 stocks you will have hundreds of opportunities in 50 weeks.
I have personally experienced that this presents ample opportunities for regular trades. Since I trade only on PSUs, even if price slips for a couple of months, then also there is no stress because I know I will get dividend while waiting for price to hit my target price.
RULES THAT I FOLLOW
My capital is always 1,00,000 per trade.
Profit target is always 6.8%.
ADVANTAGES
This approach ensures that trading is very organised and systematic as the universe of stocks consists of fundamentally strong ones. As trading is on weekly time-frame, it helps in relaxed trading. Trading rules ensure that reward and waiting period are known in advance - so expectations are always grounded. Because the trades are only on PSUs, bigger capital can be deployed per trade with confidence. This discipline ensures that trading is approached with a business-like mindset.
So, as an ex-Banker, I always approach every trade with safety in mind and found that only trading PSUs as per the approach outlined above has helped me be profitable in the stock market.
Hope this idea makes sense and appeals to some of you.
All the best with your trading.

GMDCLTD | Good for Long |NSE:GMDCLTD
CMP: 434.8
Reason for Trade : Near support Area
Entry : Cmp or near Support 420
Stop Loss: According to one's Risk Reward ratio
#Study, Learn & Earn.
If you love this post please like and comment your thoughts below. That will be a great motivation for me to post similar ideas ahead.
Disclaimer: All the information posting on this page are for the educational purpose only, we are not SEBI registered financial advisor. We wont recommend any BUY/SELL of stocks. Contact your financial advisor before taking any action

GMDC predictions - not trade advise, sharing just for educationGMDC at important level to cross 510. Any long must be initiated above 510-520 range looking at price action.
Below 480 it can again move back the consolidation range so that is short opportunity level

GMDCLTD - Long Setup, Move is ON..NSE:GMDCLTD
✅ #GMDCLTD trading above Resistance of 471
✅ Next Resistance is at 588
Related charts:
Charts are self-explanatory. Levels of breakout, possible up-moves (where stock may find resistances) and support (close below which, setup will be invalidated) are clearly defined.
Disclaimer: This is for demonstration and educational purpose only. This is not buying or selling recommendations. I am not SEBI registered. Please consult your financial advisor before taking any trade.

GMDCLTD - Trade set up1. 16 Months consolidation
2. Trend - Bullish
3. Strength - Strong
4. Breakout - Confirmed if close today above resistance

Retest DoneRetest Done
GMDCLTD
+ VCP pattern retest and bounce
+ Took 20 EMA Support
+ Low Volume during pull back


Buy Gujarat Mineral Development Corporation Short Term Trading Advice by Goodluck Capital
Buy Gujarat Mineral Development Corporation (NSE:GMDCLTD)
Buy Range- 410 - 420
Target- 475 - 490
StopLoss- below 385
Potential Return- 14-18%
Approx trade duration 18 - 20 days

GMDCLTD bullish; above 461? - Monday 8 Jan.
The above information does not constitute investment/trading recommendation and it is purely for educational purpose. Please check the Strategy below...
SWING Trading Strategy:
Position is created, only upon stock closing above the entry price on day closing basis and is held on for 5-10 trading sessions for larger gains (5-10%)
INTRADAY Trading Strategy:
1) Impulse upmove stage: The strong upmove (nearly upto 2% from breakoutprice) happens within five to 15 minutes. "High Risk Traders" buy in hope of another 2% upmove intraday.
"High Risk Traders" patiently wait through the Pullback-Consolidation stage to realize profits. High risk/High reward set up as breakouts may fakeout (reversal)also
2) Pullback-Consolidation stage: After the above "Impulse upmove stage"; the price may then pull back and move sideways (between "Open" price and "High" of the above "Impulse upmove stage").
Safe traders with minimum risk profile wait for a breakout from the consolidation to enter at this stage to relize high profits in the final intraday final "Breakout continuation" stage
3) Breakout continuation: Stocks often in the third stage breaks up above the "High" of the first "Impulse upmove stage" and continue to go higher again.
Both Safe Traders/High Risk Traders book profits at this stage
This do not constitute, financial, investment, trading, or other types of advice or recommendation.

GMDC Healthy Uptrend with a Small Breakout – Swing TradeGMDC is currently showing promising signs of a healthy uptrend, marked by a recent small breakout. This breakout has been crucial in sustaining the stock through the last market correction, and the price action is further supported by the 50-day Simple Moving Average (SMA).
Breakout Analysis:
The small breakout witnessed in GMDC is a positive indication of underlying strength in the stock. Although not a large base breakout, the fact that the stock has been able to weather recent market corrections is a positive sign for traders. This breakout suggests that the bulls are in control, and the stock may be gearing up for a sustained move to the upside.
Uptrend Sustainability:
One of the key factors supporting GMDC's current uptrend is its ability to hold above the 50-day SMA. The stock has consistently found support at this crucial moving average, indicating that the trend remains intact. Traders often consider the 50-day SMA as a reliable level for assessing the health of an uptrend, and GMDC's ability to sustain above it is a bullish signal.
Volume Analysis:
While today's volume is not exceptionally high, it is essential to consider the context. In the case of GMDC, the breakout is not a large base breakout, and hence, a substantial increase in volume may not be expected immediately. The relatively lower volume could be attributed to the nature of the breakout. However, traders should continue to monitor volume levels as the trade progresses, as increasing volume can provide confirmation of a strengthening trend.
Disclaimer: This analysis is for informational purposes only and does not constitute financial advice. Traders should conduct their own research and consult with a financial advisor before making any trading decisions.

GMDC Ltd-Ascending Triangle breakout soon🔥My view on #GMDC Ltd
Verge of Ascending Triangle #breakout
Monthly CPR is inside indicates upcoming breakout on upside

GMDCLTD - Cup n Handle breakout - 25% upside potentialGMDCLTD has formed cup and handle pattern and given breakout from 440 resistance levels.
SL: Hrly candle close below 440.
Target: 500, 560+

3T VCP Pattern3T VCP Pattern
GMDCLTD
+ Young Stage 2 Stocks
+ Strong Move during 1st leg
+ High Accumulation Volume
+ Trading above Key EMAs

Pattern Resetting 📌Resetting
✅ Keep in Focus
GMDCLTD
+ Bouncing From 50 EMA
+ Small candles at the Falling TL resistance.
+ Currently at 20EMA Support

GMDCLTD - Perfect example of Multiyear BO StockGMDCLTD - Perfect example of Multiyear BO Stock.
This is not a buy sell reccomdation. This is for my learning and recording purpose.
For Tradingview Premium plan, Can go with the below link
in.tradingview.com

GMDCLTDVolatility Contraction Pattern is popularized by Mark Minervini, who is a two times US Investing Champion. Last year he won the championship with a record-beating 300+% in the year. He primarily uses VCP for his trading setups. It is a twist on the ascending triangle pattern with some variation.
It has the following characteristics:
The Stock must be in stage 2 uptrend.
A period of price consolidation must take place in thebase.
Price consolidation occurs after a stock has moved up in the price, the consolidation (or correction) is a constructive chart pattern that allows the stock to digest the bullish price movement.
Price volatility must contract through the base (from left to right).
During this period of price consolidation the stock price will correct.
Price must correct through a series of smaller contractions.
Each contraction should be tighter than the last, representing the absorption of more weak holders. Ideally this pattern has between2-4 contractions.

Breakout Attempt📌#Breakout Attempt
✅Keep in Focus
GMDCLTD
+ Great accumulation Volumes
+ Tight range with dried up Volume
+ Trading above Key EMAs
Multi year breakoutMulti year breakout with huge raise in volumes.
Stock retested the breakout levels on weekly chart and bounced back again with good volumes.
Short term trendline breakout on daily chart.

GMDCLTD (Watchlist Idea)GMDCLTD broke out of a 72 week base and has moved quite strongly post that.
Its a good addition to watchlist for some time ahead as it may form a base and give another entry point.

GMDCLTD - Long Setup, Move is ON..NSE:GMDCLTD
✅ #GMDCLTD trading above Resistance of 375
✅ Next Resistance is at 471
Related charts:
Charts are self-explanatory. Levels of breakout, possible up-moves (where stock may find resistances) and support (close below which, setup will be invalidated) are clearly defined.
Disclaimer: This is for demonstration and educational purpose only. This is not buying or selling recommendations. I am not SEBI registered. Please consult your financial advisor before taking any trade.
