MPHASISMPHASIS taking good support high possible to move and breaks resistance i think if market strong
MPHASIS trade ideas

LONG MPHASIS - SWING TRADE IDEASymbol - MPHASIS
Mphasis is currently trading at 2254
2200 - 2260 is a good support area for Mphasis.
I'm seeing a trading opportunity on buy side.
Buying Mphasis Futures at CMP 2254
I will be adding more if 2230 comes & hold with SL of 2180
Targets I'm expecting are 2370 - 2450 & beyond.
Disclaimer - Do not consider this as a buy/sell recommendation. I'm sharing my analysis & my trading position. You can track it for educational purposes. Thanks!

MPHASIS - bullish ABCD tgt 3080-3114Mphasis Ltd. is an interesting chart with following
1. High Trade and Delivery quantity
2. Increasing Relative Strength to bench mark index and sectoral index
3. Close within 52 week high zone + above last month's high
4. Both SRS and ARS above zero
5. RSI on all time frames above 60
6. Narrowing Bollinger Bands on Daily chart
7. Price Moving on upper Bollinger Band on daily chart
8. ABCD Pattern under formation on daily Chart
9. Break out and retest of Cup and Handle Pattern on Weekly chart.
Major Support at 2590 zone being 20 SMA and positional support near 2490 to 2440 zone
Can be a good risk reward with buy on dips and dips only with stop loss as per one's own risk reward matrix and for targets of 2970 and 3114 respectively in near term
Disclaimer: I am not an expert I just share interesting charts here for educational purpose and not to be taken as buy/sell recommendation. Please seek expert opinion before investing and trading as trading/ investing in market is subject to market risks. I do not hold any position in the stock as on date but I may look to buy on dips with my own Risk Reward matrix.


MPHASIS 01-04-2024Happy learning with trading. I just shared my view. If correct give me one like. If not correct me.
points to note:
1) trendline breakout possible.
2) price in in good support. we may see target 1 shortly .
Disclaimer:
I am not a Registered Analyst with SEBI and it is only for educational purposes. Please consult your financial advisor before making any decision. I will not be responsible for any of your profits or losses.

Mphasis - Keep On WatchFor the past 12 months, the stock has been moving in a rising parallel channel. This moment rests at the lowest edge of the channel. If takes support and bounces back, there may be a bullish phase.
Possible early targets may be 2600/2700.
The setup fails if the price trades below 2340 ( below the channel).
This is only for learning and sharing purposes, not a trading advice in any form.
All the best.

MPHASISMPHASIS Price making Higher high and running in parallel channel from April 2023.
Now its near lower end of the channel & trendline support area also there
price near Fibonacci retracement level, 61.8% .
morning star candle stick pattern at 61.8%
This idea is for Educational purpose and paper trading only. Please consult your financial advisor before investing or making any position. Facts or Data given above may be slightly incorrect. We are not SEBI registered.

REVERSAL SPOTTED IN MPHASISMphasis is resting near 200 ema on a daily time frame
bullish rally can be seen from 2450 level

MPHASIS - LOOKING WEAK FOR THIS WEEK - SHORT ENTRYAs per Chart MPHASIS suggests strong downtrend Momentum.
If trend continues we can see more Fall.
IT is underperforming as compared to NIFTY 50 and MPHASIS also showing weakness.
So the pattern will active below 2375
And pattern will be neglated above 2445

MPHASIS bottom channel retestIts moving in a channel and is at the bottom currently. We can enter the trade with SL: 2336 and target of 3000.

Mphasis :: IT giant ready to reach ATHRound bottom Formation on a Longer Time Frame
Inverted H&S Pattern is given a breakout.
Good Fundamental stock
one can keep in portfolio keeping the support of below trendline.
DISC: Only for educational purposes.

CHANGE OF POLARITY-MPHASIS
On weekly TF the resistance has been broken and is now acting as support.
Volumes are good and it is consolidating near support.
If it breaks and closes above resistance then it can be a good buy for ATH target.
Disclaimer: This is not a trade recommendation. This is purely for educational purpose.

resistance and support breakoutstock is trading near s & r it will intresting to see how it react at this level
keep on radar
only for educational purpose
not for sugesstion

MPHASIS TARGET 3167 STOP LOSS 2522Script is weekly brkeaout from the resistance of 2749 with weekly and day closing is bullish. If it sustains above 2749 with intraday thn it will reach the target of 3167

Mphasis: Cup with HandleMphasis a global Information Technology (IT) solutions provider specializing in providing cloud and cognitive services, applies next-generation technology to help enterprises transform businesses globally.

breakout trading !In technical analysis, a breakout refers to a substantial price movement of a financial instrument, such as a stock or commodity, surpassing a specific level of support or resistance. This occurrence is of paramount importance, as it frequently signifies the initiation of a new trend, offering traders and investors valuable insights for informed decision-making.
Outlined below are key aspects related to breakouts in technical analysis:
Definition: A breakout occurs when the price of an asset surpasses a well-defined level of support or resistance. The breakout can manifest as either an upward movement (bullish breakout) or a downward movement (bearish breakout).
Significance: Breakouts carry significance as they indicate a shift in market sentiment, suggesting that the prevailing trend may be weakening or reversing, potentially giving rise to a new trend.
Types of Breakouts:
Bullish Breakout: This occurs when the price surpasses a resistance level, signaling potential upward momentum.
Bearish Breakout: In contrast, a bearish breakout happens when the price drops below a support level, indicating potential downward momentum.
Volume Confirmation: Successful breakouts are often accompanied by an uptick in trading volume, serving as confirmation of the robustness of the new trend. Volume analysis is instrumental in validating the legitimacy of the breakout.
False Breakouts: It is important to note that not all breakouts lead to sustained trends. False breakouts can occur, wherein the price briefly breaches a support or resistance level but subsequently reverses. Traders commonly employ additional technical indicators or await confirmation before acting on a breakout.
Measuring Target: Traders frequently use the height of the pattern preceding the breakout, such as a triangle or rectangle, to estimate the potential price target. This aids in setting profit targets.
Common Chart Patterns Leading to Breakouts:
Triangles: Symmetrical, ascending, or descending triangles often precede breakouts.
Head and Shoulders: Both inverse and regular head and shoulders patterns can signal potential breakouts.
Rectangles and Flags: Consolidation patterns like rectangles and flags can lead to breakouts.
Role of Trendlines: Trendlines are commonly employed to identify potential breakout points. The intersection of a trendline with a support or resistance level is deemed a critical zone for a potential breakout.
Risk Management: Traders typically incorporate risk management strategies, such as setting stop-loss orders, to safeguard against false breakouts or adverse market movements.
In summary, breakouts in technical analysis are pivotal events offering valuable information to traders and investors about potential shifts in market trends. Effective breakout trading strategies involve confirmation, volume analysis, and meticulous consideration of various chart patterns.

Amazing breakout on Weekly / Daily Timeframe - MPHASISCheckout an amazing breakout happened in the stock in Weekly timeframe, macroscopically seen in Daily timeframe. Having a great favour that the stock might be bullish expecting a staggering returns of minimum 25% TGT. IMPORTANT BREAKOUT LEVELS ARE ALWAYS RESPEECTED!
NOTE for learners: Place the breakout levels as per the chart shared and track it yourself to get amazed!!
#No complicated chart patterns
#No big big indicators
#No Excel sheet or number magics
TRADE IDEA: WAIT FOR THE STOCK TO BREAKOUT IN LOWER TIMEFRAME AND RETRACE IF NEEDED. SL IS NEARER SUPPORT ZONE IN Daily TIMEFRAME.
PS: No new Nifty500 script can escape from me when making a breakout. :-)

MPHASIS - heading towards 3600NSE:MPHASIS
cmp 2800
MPHASIS gave breakout on weekly chart at 2760 zone in Dec 23
then gave a pullback till 2500 in Jan-Feb 24
now back to 2800 and heading towards 3600
The objective of this analysis is knowledge sharing and education. There isn't any buy or sell advise in this article. Every stock is held for a short to medium amount of time and is positional.
It is expected of each person to carry out independent research and evaluation to ascertain whether my perspective is consistent with your studies.

Mphasis Weekly Inverted H&S patternMphasis is currently trading at a CMP (Current Market Price) of 2801, with notable technical indicators suggesting a bullish sentiment. On the weekly chart, an inverted head and shoulders pattern has formed, typically indicative of a bullish reversal. The pattern is complemented by high trading volumes, affirming market participation and conviction. Furthermore, the breakout from the pattern followed by a period of consolidation reinforces the potential for upward movement. The MACD (Moving Average Convergence Divergence) indicator has exhibited a bullish crossover, adding to the positive sentiment. Moreover, with the RSI (Relative Strength Index) at 66, there is considerable momentum behind the price action. Additionally, the ADX (Average Directional Index) reading of 24 signals a strong trend, further bolstering the bullish outlook.
In terms of support and resistance levels, the support is identified at 2500, providing a significant level for potential downside protection. Conversely, the resistance level, as per the pattern, is estimated to be at 3450, serving as a target for potential upward movement. Considering these technical indications collectively, Mphasis appears to be positioned favorably for potential upside movement, with the aforementioned levels serving as key reference points for traders and investors.

Mphasis Ltd - Positional view on weekly chartFor those who have read Stan Weinstein's book "Secrets For Profiting in Bull and Bear Markets" will relate to the structure forming here and the stage in which the stock is currently in.
The stock price is hovering above the 40 Weekly Moving Average (WMA), is in an uptrend and has formed positive base formations. Post this week's bullish candle formation the stock price is near the buy zone.
Manage strict stop loss of 5-8% if the trade goes wrong
Note: Not a buy/sell recommendation. Please do consult your financial advisor.

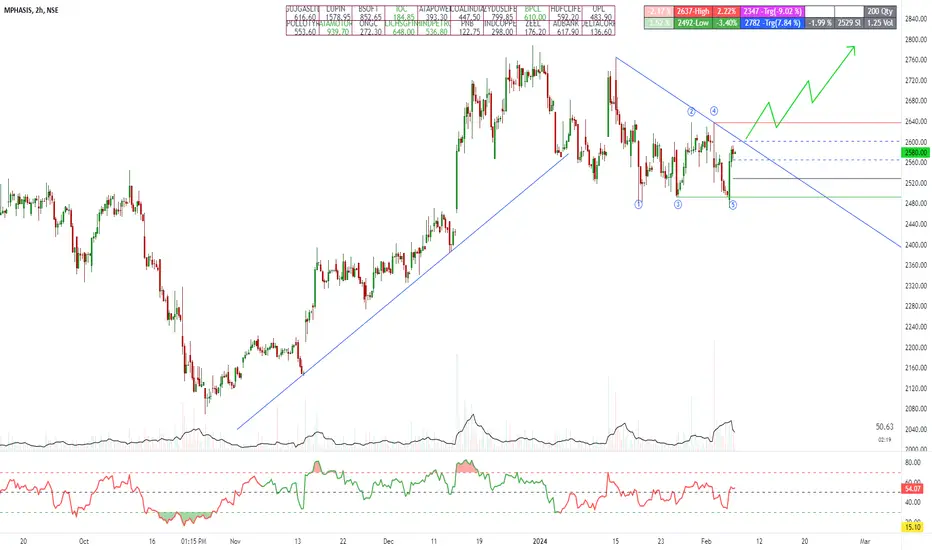
Wait for close above trendline in 2 hours time frameUp Trend
Tripple Bottom in Short time frame.
Macd will be positive above Trenline Breakout
RSI above 50
stoploss 3.40% @ 2492
Target 7.84@2782
Risk Reward : 1 : 2.30
MPHASIS MORNING TRADE SETUPReason to buy :-
1. Bullish candel on weekly chart.
2. Stock in rising channel, making lower lows and higher highs.
3. MACD revershal right from centre line.
4. RSI 64 considered to be bullish.
5. IT sector stock which has taken u turn from lows.
Trade:-
So, 2800 CE option Feb expity availablr at Rs 54, looking good. Lot 275.

MPHASISMphasis Limited is a information technology (IT) services and solutions provider. The Company is engaged in offering applications, business process outsourcing (BPO) and infrastructure services
Note:
1. Views are personal and for educational purposes only. Recheck and take the trade as per your RR.
2. Always remember SL is your lifeline, not the big target...
3. Follow us for more patterns and like, share so that we feel it is helpful to many and share more patterns...
3. Views given here is not a tip rather it is for educational purpose... Aftermarket opens, the condition might change so learn to handle different conditions...
Keep an eye ladies and gentlemen. Cheers and Happy Trading
