PFIZER 1:10+ RR set up1. Set up Reversal from Fib 61 Levels
2. Trend: Bullish
3. Sl follow on closing basis
4. RR: 1:10+
Next report date
—
Report period
—
EPS estimate
—
Revenue estimate
—
103.75INR
5.51 BINR
21.93 BINR
15.55 M
About PFIZER LTD
Sector
CEO
Meenakshi Nevatia
Headquarters
Mumbai
Website
Founded
1950
ISIN
INE182A01018
FIGI
BBG000CXR2S9
Pfizer Ltd. engages in the business of manufacturing, marketing, trading, import and export of pharmaceutical products. Its product offerings include treatment for depression, erectile dysfunction, high cholesterol, human immunodeficiency virus infection, hypertension, bacterial infections and systemic fungal infections, and other chronic therapeutic which includes pain, respiratory, vitamins or minerals, hospital anti-infectives, neurosciences, and cardiovascular. The firm's products include Prevenar 13, Lyrica, Ativan, Viagra, Zosyn, Minipress XL, Meronem, Enbrel, Dolonex, Magnex, Amlogard, Trulimax, Daxid, Neksium, Becosules, Gelusil, Mucaine, Folvite, Autrin, Citralka, Corex Range, Anacin, and Anne French. The firm operates through the India and Outside of India geographical segments. The company was founded on November 21, 1950 and is headquartered in Mumbai, India.

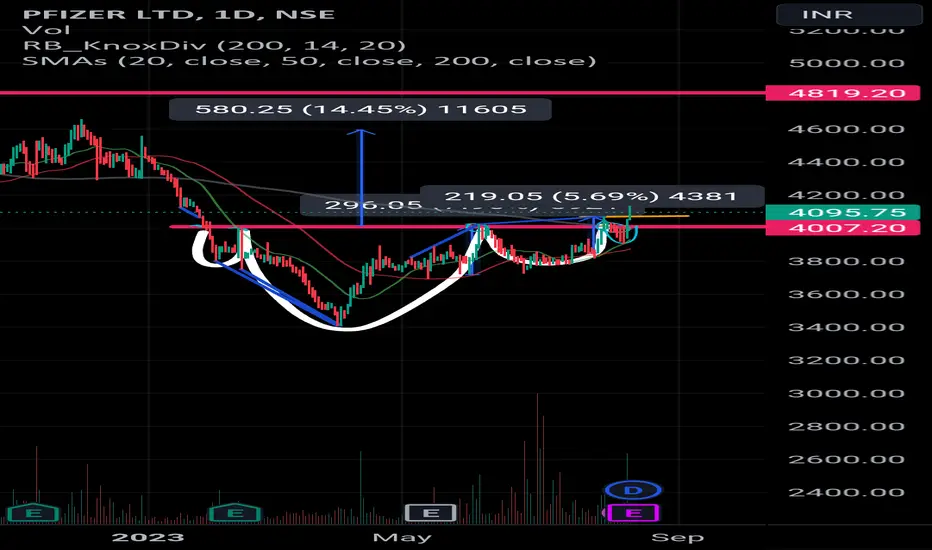
Pfizer - Cup & Handle breakout madePfizer has been consolidating for a couple of years and has now finally given a breakout with Cup & Handle pattern.
Cup & handle pattern is a highly trusted pattern for its bullishness.
Not to mention Pfizer is a strong company and should be part of everyone's portfolio.
CMP: 4240
Breakout leve

PFIZERparallel channel started from Mar'99 and making top in Sept 21
now head and shoulder formation is complete
now a dead cat bounce and followed by bears

A beautiful sport from where a stock Ready to go upBeautiful spot from where stock ready to go down to upside now reversal clearly visible with all indicator positive one can study like this stock nicely

PFIZER
The Monthly RSI has bounced from its Oversold zone 43-35.
The Monthly MACD has crossed above its Trigger line.
This suggests that prices have formed a base the low of 3408.
Past up-moves suggest that the price could now resume its up-move to initially test its prior all time high of 6175.
On

PFIZER StrategyTrendline support and good fundamental stock.
At Pfizer, we apply science and our global resources to bring therapies to people that extend and significantly improve their lives. We strive to set the standard for quality, safety, and value in the discovery, development, and manufacture of health ca

Pfizer | Trendline Breakout | Longpattern shows trendline breakout along with positive signals from other indicators.
Buy under 3900
Target : 4300
If trading for short term, SL: 3750
If trading for long term, SL: 3450

Bullish head & shoulder pattern Bullish head & shoulder pattern
Bullish for long term
Target mentioned in the chart
Available at good price
Good stock
Good volume
Breakout confirmation happen
Pfizer ready for a up move Trend reversal and Break out
Closed above 40 SMA
Volume accumulation seen on weekly chart
Can be consider for a decent gain

REVERSAL IN PHARMA SECTOR ?In this week the pharma sector witnessed a rally. Pfizer has still not witnessed a rally and technically it has started higher lows with a attempt to break the trendline. Any closing above 4050 will lead the stock towards 4400 and 4800 levels.

See all ideas
Trade directly on the supercharts through our supported, fully-verified and user-reviewed brokers.


Frequently Asked Questions
The current price of PFIZER is 4609.75 INR — it has increased by 0.72% in the past 24 hours. Watch PFIZER LTD stock price performance more closely on the chart.
Depending on the exchange, the stock ticker may vary. For instance, on NSE exchange PFIZER LTD stocks are traded under the ticker PFIZER.
PFIZER stock has risen by 0.74% compared to the previous week, the month change is a 9.73% rise, over the last year PFIZER LTD has showed a 21.29% increase.
We've gathered analysts' opinions on PFIZER LTD future price: according to them, PFIZER price has a max estimate of 5330.00 INR and a min estimate of 4595.00 INR. Watch PFIZER chart and read a more detailed PFIZER LTD stock forecast: see what analysts think of PFIZER LTD and suggest that you do with its stocks.
PFIZER reached its all-time high on Sep 9, 2021 with the price of 6175.00 INR, and its all-time low was 88.50 INR and was reached on Nov 22, 1995. View more price dynamics on PFIZER chart.
See other stocks reaching their highest and lowest prices.
See other stocks reaching their highest and lowest prices.
PFIZER stock is 2.18% volatile and has beta coefficient of 0.51. Track PFIZER LTD stock price on the chart and check out the list of the most volatile stocks — is PFIZER LTD there?
Today PFIZER LTD has the market capitalization of 210.43 B, it has increased by 1.15% over the last week.
Yes, you can track PFIZER LTD financials in yearly and quarterly reports right on TradingView.
PFIZER LTD is going to release the next earnings report on Aug 1, 2024. Keep track of upcoming events with our Earnings Calendar.
PFIZER net income for the last quarter is 1.79 B INR, while the quarter before that showed 1.30 B INR of net income which accounts for 37.61% change. Track more PFIZER LTD financial stats to get the full picture.
EBITDA measures a company's operating performance, its growth signifies an improvement in the efficiency of a company. PFIZER LTD EBITDA is 6.35 B INR, and current EBITDA margin is 28.97%. See more stats in PFIZER LTD financial statements.
Like other stocks, PFIZER shares are traded on stock exchanges, e.g. Nasdaq, Nyse, Euronext, and the easiest way to buy them is through an online stock broker. To do this, you need to open an account and follow a broker's procedures, then start trading. You can trade PFIZER LTD stock right from TradingView charts — choose your broker and connect to your account.
Investing in stocks requires a comprehensive research: you should carefully study all the available data, e.g. company's financials, related news, and its technical analysis. So PFIZER LTD technincal analysis shows the buy rating today, and its 1 week rating is strong buy. Since market conditions are prone to changes, it's worth looking a bit further into the future — according to the 1 month rating PFIZER LTD stock shows the strong buy signal. See more of PFIZER LTD technicals for a more comprehensive analysis.
If you're still not sure, try looking for inspiration in our curated watchlists.
If you're still not sure, try looking for inspiration in our curated watchlists.