SHRIRAM FINANCE // 23-05-24 // at Support Area This share trading at support area, may give 8% profit. Take position as per your risk reward ratio and that is not recommended only for educational purposes.
SHRIRAMFIN trade ideas

SFL preparing to shift in new upper trajectorygood q4 result , big bullish candle, seen buying interest and certainly will attract Bajaj finance disappointed investor :)

Double bottom pattern breakoutDouble bottom pattern breakout
52 week high breakout with good volumes

#SHRIRAMFIN BREAKS OUT FROM HEAD AND SHOULDERS #SHRIRAMFIN BREAKS OUT FROM HEAD AND SHOULDERS CONTINUATION PATTERN ON WEEKLY TIMEFRAME 📚📈
The price action in Shriram Finance shows a strong uptrend in the weekly time frame.
The price has been consolidating for some time, and the pattern that seems to emerge from this consolidation is a head-and-shoulder continuation pattern.
The price is also reversing off its rising trendline as it crosses above the 20-day moving average.
Shriram Finance is an outperforming stock.
The consolidation phase seems to be coming to an end.
Buy for a rally to 2650 and above that to 2850.
Keep the stop-loss below 2350.
Hold for a couple of weeks.

Shriram finance Ltd: Inverted H&S PatternShriram finance Ltd: Inverted H&S Pattern
10 %upside potential.
Levels mentioned on chart.
Plan your trade accordingly.
Views are for ‘’EDUCATIONAL PURPOSE ONLY’’,trade at your own risk.
"Trade what you see, Not what You Think"
Happy Trading(:)

#LONG on SHRIRAM FINANCE for LONG TERM; 25 Year High + BreakoutThe scrip was trading below multi-year resistance trend line since 2008.It gave a breakout from the trend line on 24th Jan'24. It formed a large bullish candle on a monthly time frame returning 16% in JAN'23 and nearly 99.5% in last 12 months.
The Stock rose nearly 3.30% today hitting an ATH of 2442 which is also a 25-Year High.
Stop Loss: as per risk appetite.
Potential:69% to 138%
Time period: 1-3 years (It's a long term bet)

sky is the limit in Shriram Transport Finance.1) Inv H&S formed on Weekly chart.. excellent depth of the head.. long 5 years consolidation.
3) symmetrical Triangle, breakout already done. Retest also done.... and fresh upmove started.
All this on weekly chart -- means target is big, very big.
Fundamental :-
1) excellent dividend payer.
2) Vehicle scrap policy will hit give a booster dose Auto Sector, and this stock be the biggest beneficiary.. .. Commercial vehicle scrappage is what govt is targetting. and commercial vehicle sector will be booom, I am already holding Force Motors -- giving 80% returns...
So just buy and buy and forget !!
Will see you guyz after 1 year @ 3000/- +


SHRIRAMFIN BULLISH OUTLOOKSHRIRAMFIN has been in consolidation phase and is looking for breakout. One should look for 8% up potential move up from this level soon.
SHRIRAMFIN C&H BREAKOUTShriramfin breaking c&h pattern
with good volume and rsi
trading above 20ema
educatinal idea only

Is it forming inverse cup pattern?Is it forming inverse cup pattern?
high risk.
Stop loss and hedge must.

Shriram Fin - Channel opportunityThis stock has been trading in the channel since 2008. It is highly unlikely that this will break is anytime soon, but given the elections in India, it might take at least 1 year for the stock to reach its bottom of the channel.
I will be placing my spot bet after election results on this stock.


Shriram finance Price Action.Shriram finance is form inverse Head & shoulder pattern. It can long from here if come near 1650 add more. Target would be 2700.

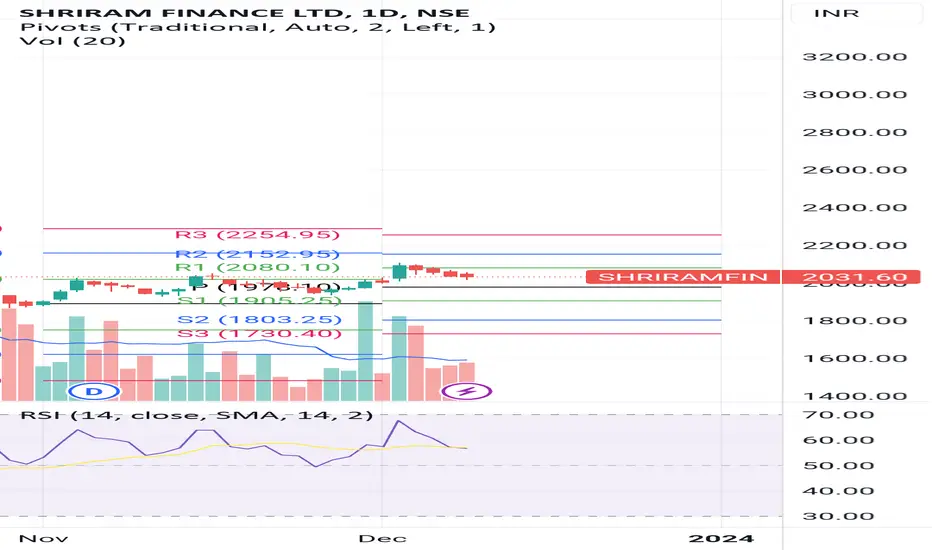
Good entry above 20401 Clear ICHIMOKU levels.
2 Stock at all time high.
3 Strong strength candle on daily, weekly, monthly time frames.
4. Good entry Above 2040.
5 Stock can reach 2080, 2000, 2015 levels on INTRADAY or coming sessions.
This view shared for educational purposes only. Please consult your financial advisor before entering into trades.

Shriram Finance Ltd breaks out Shriram Finance Ltd. NSE has broken out on the daily chart, with the price moving above the 200-day moving average. This is a bullish signal, and the stock could continue to rise in the coming days and weeks.

LONG BREAKOUT IN SHRIRAM FINANCE...BUY - SHRIRAM FINANCE LTD
CMP - Rs. 1734
Target - 1: Rs. 2106
Target - 2: Rs. 2365
.
.
Technicals - Trendline Breakout
.
This is just a view by an expert analyst, please invest at your own risk.
.
Follow me for more!

SHRIRAMFIN ANALYSISClean breakout at all time high . Buy can be initiate with the SL of 1517 and Target would be 2100 and 2395

Shriram transport Good For Long Term The Chart is Showing Inverted Head and Shoulder Breakout
Can Go Long
Also FII have Increased their Stake

shriram - sell - profit bookingsell at cmp
easy tg 1720
tg2- 1700
Disclaimer : This is my personal analysis for study purpose not intended for trading.

Shriram Finance : Technical Analysis Suggests Bullish TrendNSE:SHRIRAMFIN
The stock of Shriram Finance Company is currently trading above the 20-day exponential moving average (EMA), the 50-day EMA, and the relative strength index (RSI) is near 60. The stock has also re-entered the channel that it was trading in before the recent correction. This suggests that the stock is in a bullish trend and could continue to rise.
The Elliott wave theory suggests that the stock is currently in wave 5 of a larger uptrend. Wave 5 is typically the longest and most powerful wave of a trend, so it is possible that the stock could rise significantly from here.
The lookalike correction wave ABC is also complete, which is another bullish signal. The triangle breakout is also a bullish signal, as it suggests that the stock is breaking out of a period of consolidation and is ready to resume its uptrend.
Overall, the technical analysis of Shriram Finance Company is bullish. The stock is trading above key moving averages, the RSI is near 60, and the stock has re-entered the channel that it was trading in before the recent correction. The Elliott wave theory also suggests that the stock is in wave 5 of a larger uptrend.
However, it is important to remember that technical analysis is not always accurate. There is always the possibility that the stock could go against the technical analysis and decline. Therefore, it is important to do your own research and to only invest money that you can afford to lose.
Target price: 1487
Invalid level: 1316
Risk warning: Please buy at your own risk. Happy trading.

SHRIRAMFIN - Intraday Trade || 13th June, 2023 #stocks To be traded for Intraday today
13th June, 2023
SHRIRAMFIN
#intraday #stocks #priceaction
Analysis Criteria Used:
1. Please find the Chart Analysis done for the Intraday Trade Idea levels for 13th June, 2023
2. The analysis for the Trade ideas, has been done based on Trend analysis and Chart Patterns with Volume Buildups
Focus On:
1. Always keeping your Risk Management in play
2. Using a Stop Loss; because it is your Best Friend
3. Always Plan your Trade and stick to your Plan
4. Dont overthink or overanalyse
5. Treat this as your Business and get serious about it
#sharemarket #stockmarket #nifty #sensex #investing #trading #nse #bse #stockmarketindia #stocks #indianstockmarket #investment #stockmarketnews #banknifty #finance #money #intraday #intradaytrading #investor #niftyfifty #dalalstreet #sharemarketindia #sharemarketnews #stockmarketinvesting #business #sharemarkettips #stock #india #indiansharemarket #rakeshjhunjhunwala #bhfyp #mumbai #share #wealth #investment #market #invest #trading #investing #finance #FinancialFreedom #investor #trader #stocks #profit #investors #economy #equity #shares #nifty #stockexchange
DISCLAIMER:
.
* Please do your own research and/or contact your financial advisor before taking any trading opportunities
** We will not be responsible for your profit or loss
*** We are NOT SEBI REGISTERED
______________________
best stocks to buy today
best stocks to buy now
best stocks to buy
best stocks for Intraday tomorrow
best stocks for long term investment
best stocks to buy today india
best stocks for swing trading
swing trading strategies
swing trading beginners
what is swing trading
swing trading stocks
swing trading stock selection
swing trading kya hai
nifty analysis
nifty view
bank nifty analysis
top stocks to buy now
strong stocks
nifty view
nifty prediction
stock market view tomorrow
bank nifty Levels
bank nifty prediction
share news
stock market news
best stocks to buy now
profit booking stocks
multibagger stocks in discount
breakout stocks
best short term stocks
best short term shares
next multibagger stocks

SHRIRAMFIN - Weekly AnalysisIn the Weekly Chart of SHRIRAMFIN ,
we can see that; let it retest and then enter with SL.
