possible shortwhole week spent in consolidation, now if it trade below 85 support, then a 2% drop could be there...
Futures market

🔥GOLD CONTINUES TO REMAIN RANGE-BOUNDAfter experiencing a bottom-out recovery on Monday, a cross closing line appeared on Tuesday. Looking back at the trading trends in the past two days, the Asian market fell back, the European market stabilized, while the U.S. market rebounded after a second dip, rose further in late trading and broke through the high point of the Asian market. Based on this rhythm, we can consider adopting a similar strategy on this trading day. Gold prices hit a short-term high of 2431 last Friday and then plummeted, forming a 100-point downward trend. This signal indicates that gold prices will temporarily form a stagflation trend between 2400 and 2430.
The daily chart shows a cross closing line with obvious upper and lower shadow lines, indicating that there is a rebound after a decline, and a fall after an advance. This is a typical shock pattern. On Monday, we had expectations for this week's shock trend. After last week's pullback, we have emphasized the emergence of a correction week. It is expected that there will be a shock situation. Selling high and buying low around the range is the focus. What needs special attention are the two suppression points, one is 2392 and the other is 2400. When the price is close to these two positions, you can consider shorting, because it is obvious that the disk price has fallen back considerably after hitting these two positions. In terms of support, we should pay attention to the positions of 2333 and 2320. The 2320 support zone is the bottom line for bulls. If it is close to this area this week, there may also be a bottom-out rebound. Next, focus on the fluctuations between the range 2320 and 2400.
On the whole, today's short-term operation advice for gold is to mainly go short on rebounds, supplemented by longs on callbacks. The top short-term focus is on the resistance range of 2392-2400, and the bottom short-term focus is on the support range of 2345-2363.

Axis bank at Possible support ?Axis bank has historically using inclining trend line as a support
every consolidation period has been using a declining trend line support as can be seen on 1,2 & 3 scenarios
also RSI divergence is found in 1&2
this could repeat the same and head for a new all time high as it has done previously.

#Silver Weekly Update 🌟 18 - 24 April
Timeframe: 4-hour ⏰
A simple story unfolds as silver crafts a triangle pattern. Keep your eyes peeled for an exciting breakthrough above 84000, hinting at potential fireworks ahead! 🚀
More than 2600 points ahead.
DO YOU AGREE WITH THIS IDEA? GIVE IT THUMBS UP

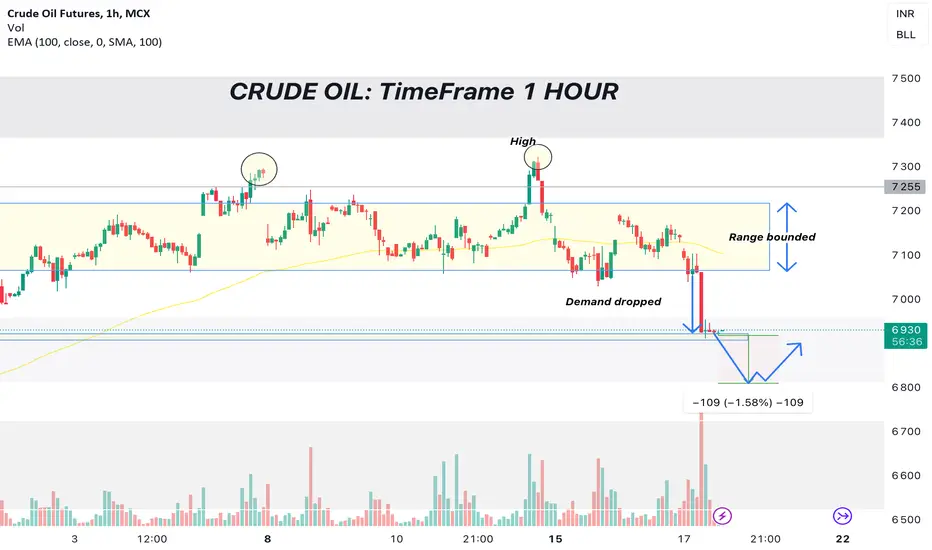
CrudeOil Alert! MCX 💥 Weekly 18 - 23Apr
Timeframe: 4-hour ⏰
🔍 Observing an intriguing D cup pattern emerging in crude oil. The alluring support beckons at 6726. Exciting times ahead! 💃🕺
Selling point at 6860
Target would be 6700 - 6680 (+150 -- +170 points)

NATURALGAS Weekly Trade || 18 April - 24 April
Timeframe: 4-hour
Entry: Favorable above 149
Targets: 155.5, 162
Stop Loss: 145
Technical Analysis:
Natural Gas Storage data is pivotal for price movements, reflecting the market's supply-demand equilibrium. Elevated storage builds may exert bearish pressure, while lower builds or draws could drive prices upward.

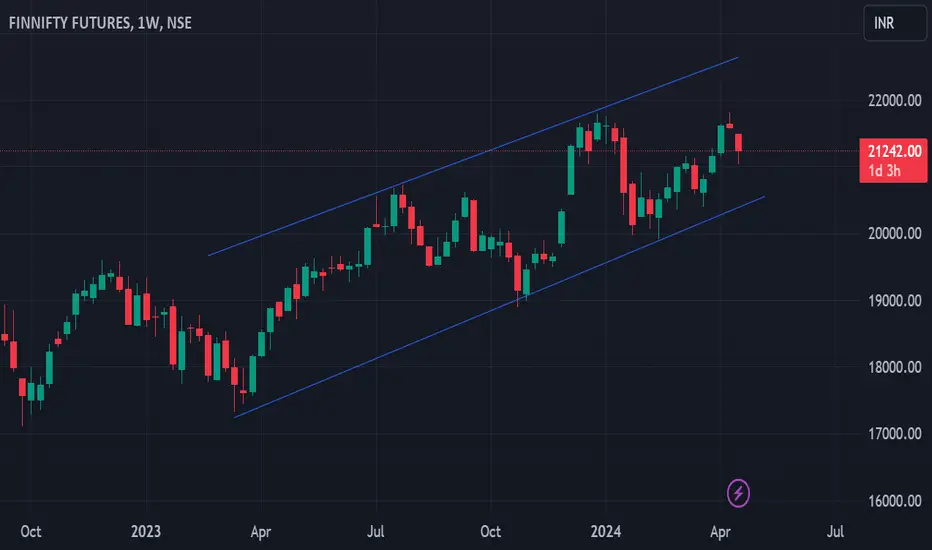
FINNIFTY Prepare for short term rallyFINNIFTY technically moving with an upward trend. No major fundamentals are supporting a change in a technical pattern other than the India-Mauritious tax issue on FIIs. But it is unlikely to affect Buying at lower levels
Buy can be initiated between 21000-20500
Make sure that one can Handling 500 points of volatility
800-1000 points can be expected before 7th May 2024
Support: 20500 Resistance: 22500
By Sathish Kavinchal
SEBI Registered Research Analyst
INH200007539
Disclaimer: Investments in the securities market are subject to market risks. Read all the related documents carefully before investing.

📆 #Crudeoil Update MCX || April 18Update :-
🔸Support at 6811, with a potential move towards the 7000 level for settlement. Long only above 6950-6960.
🔸Crude oil prices declined over 3% due to robust US oil supply & growing demand concerns.
🔸US crude inventories increased by 2.735 million barrels.
Silver Short As seen on chart, a Harmonic pattern can be recognized. So, assuming a reversal can take place from the given price level, A small risk trade can be taken with a tight SL. Targets are marked on chart.

NG to enter up trend on weekly chart, buy on dipsBoth indicators - stochastics and VI, are strongly oversold on weekly chart and there is a clear bullish wedge pattern. NG may touch 200. Buy on dips. Right now at 161 is a buy.

Gift Nifty At Strong Support 22150 to 22100Gift Nifty At Strong Support 22150 to 22100
Good Upmove Possible toward 23000
Still Buy On Dip, Buy On Dip...

Nifty - How to trade today
Please read the notes as mentioned on the chart.
Disclaimer: I am not a SEBI Registered Analyst. Please consult your financial advisor before making any decision. I will not be responsible for any of your profits/losses. This is only for educational purposes.
Let you grow. May! I follow you.

Bank Nifty - How to trade today
Please read the notes as mentioned on the chart.
Disclaimer: I am not a SEBI Registered Analyst. Please consult your financial advisor before making any decision. I will not be responsible for any of your profits/losses. This is only for educational purposes.
Let you grow. May! I follow you.

Natural Gas - Live Market Analysis
Please read the notes as mentioned on the chart.
4-18-24 4:25 AM
4-18-24 8:52 AM
4-18-24 1:18 PM
4-18-24 5:44 PM
4-18-24 10:11 PM
4-19-24 2:37 AM
11:59 p.m. candle was pivotal last night.
Disclaimer: I am not a registered analyst with any of the National or International agency and it is only for educational purposes. Please consult your financial advisor before making any decision. I will not be responsible for any of your profits or losses.
Thank you

GOLD IN CORRECTIONHi everyone...
Right now market touches our 1st Weekly PULL BACK zone which is 2357-2477 zone
We got Day High(using MY HIGH find method)-correction sell 80% confirms
In 4hrs the market got bounce on small buy zone which is 2335-2320
Also we got 15min low(using MY LOW find method)-trend continues
but doesn't get CHOCH(doesn't cross 2319) confirmation in 15Mins and 4Hrs
Careful with sell
And mainly in Monthly time frame previously we got H&S
so Head and Shoulder full target is 2527
Monthly 1st back zone we Got here which is 2462-2689
Here is the Result
1st Analysis
Buy@2344.3-2336
SL@2330(or use buy limit SL)
TP 2346
TP 2352
TP 2364
TP 2388
TP 2430
TP 2520
Buy limit@2329-2323
SL@2319
TP 2331
TP 2345
TP 2352
TP 2364
TP 2388
TP 2430
TP 2520
2nd Analysis
Sell limit@2388-2395(we need a confirmation before enter this)
SL@2397
TP 2386
TP 2380
TP 2300
TP 2278
TP 2167
TP 2050
TP 1973
Sell limit@2426-2428(EXTREME SELL zone BUT BE CARE FULL WE DOSENT GET 15M & 4h CHOCH)
SL@2432
TP 2424
TP 2400
TP 2380
TP 2300
TP 2278
TP 2167
TP 2050
TP 1973
USE RISK MANAGEMENT
SAFE TRADER ONLY TAKE 3 TO 5 TRGT BASED ON YOUR EQUITY BUT 1ST TP MUST
AFETR HIT 1ST TP MUST SET BE(Break Event)
==Use stop order -.5 pips from SL(if you ok)
stop order needs high equity==
NOTES:EDUCATIONAL PURPOSE ONLY

Gold price today: Still increasing regardless!Today, the price of gold continues to remain high and has a tendency to increase to nearly 2385 USD, with moments approaching the threshold of 2,400 USD/ounce.
Escalating tensions in the Middle East serve as a supportive factor for gold. Recent capital flows have consistently sought out gold as a safe haven. Gold could easily surpass the 2,400 USD/ounce mark for the second time if conflicts intensify in this region. Furthermore, it has already risen due to central bank purchasing activities and expectations of increasing inflation.


Crude Oil AnalysisHello Friends, Hope you find doing well.
As there are so up down in market now a days because of many reasons
Elections, war, Global data, USDINR, DXY.
So based on following all parameter i am trying to analysis crude oil price action, hope it helpful for all commodities trader.
As we can see in chart it is making bullish flag pattern on 4hr timeframe. So we will se break out up side and we can make better position according. It may trigger by global data or by war declare.
Plan your trade according your analysis. I do not recommended to do as i said. I just analysis chart pattern and data which make positive price action.
Best of luck
Regards.

Gold Trend 15/04The rapid retraction from the new high suggests the gold price has entered a short-term correction period.
Gold reached a new all-time high of 2431 last Friday after the US market opened, but the price quickly retreated. It lost key support of 2400 and 2380, falling back to the bottom support of Thursday near 2330, ending the weekly at 2343 with a slight increase of 13 dollars. The market had been anticipating retaliatory actions from Iran following the attack on the Iranian embassy in Syria, creating a relatively tense environment that led to the climb in gold prices in the past two weeks. There was noticeable profit-taking in the market, coincidentally 24 hours before Iran's retaliation. After the long-awaited Iran's retaliatory action, the risk sentiment decreased abruptly; although gold opened with a gap of around 10 dollars on Monday's Asian session, the movement remained relatively calm. The S-T upward trend began to slow down after the rapid retracement on Friday. At this point, we can expect a range-bound consolidation to begin to form this week.
1-Hr Chart - The gold price has been steadily climbing along the upward trend channel(1) since it broke through the 2300 resistance at the night of the non-farm payroll at the beginning of the month. The price is still sitting within the upward channel(1). However, S-T resistance is expected around 2375-2380 after the market experienced significant volatility on Friday. For now, the trading range for this week can be set at around 2318-2380(2).
Daily Chart - After the reversal in gold price last Friday, there is a clear indication of a potential peak (3). As long as the closing price in the next two days remains below 2373 (4), a more noticeable correction is likely to occur. The initial target for this correction can be set around the 20-day moving average (5).
Monthly Chart - It is important to note that the gold price is approaching the upper boundaries of the long-term upward channels (6) and (7). For the upward trend to continue, the gold price must break through the resistance line at the top of the channels. Otherwise, a correction in the overall trend may be needed.
S-T resistances:
2380
2370-72
2365
Market price: 2359
S-T supports:
2350
2345
2338-40
If you like my work, please give me a thumbs up 👍.
Feel free to leave a comment; share your thoughts 🤟.
P. To

Gold prices continue to trade high!Dear investors,
We are currently at an important turning point, faced with the choice between reinvesting in gold - an investment that has eternal appeal, or going in another direction, exploring new opportunities.
Yesterday, gold experienced strong fluctuations, when the price fell below 2,325 USD/ounce. However, as if it were participating in a detective movie, gold quickly recovered and reached a new high of 2,383 USD/ounce, moving closer to the historical record.
Confidence in gold has not diminished, as the need to find a safe haven is increasing due to political instability in the Middle East. Gold's price boom this week was also fueled by the strength of the dollar and US Treasury bond yields, after economic reports showed retail sales in the US in March outperformed expected, raising concerns that the Federal Reserve (Fed) may be hesitant to change its monetary policy.
The combination of geopolitical uncertainty and the prospect of a more accommodative monetary policy from the Fed in the second half of this year has added to gold's appeal as a safe-haven investment, making it the more attractive in the eyes of financial investors.
Let's consider our investment strategy to make the most of current opportunities in this volatile market context.

Update the latest gold price today!Gold prices moved in a narrow range on Tuesday, holding steady near a record high. The ongoing crisis in the Middle East continues to influence investor sentiment, increasing interest in the precious metal.
Even though the US dollar is strengthening, gold is still showing resilience as US Treasury yields fall from multi-month highs. Reducing geopolitical tensions between Israel and Iran has also failed to reduce demand for gold, as people predict prices will continue to rise. If this buying trend sustains, immediate resistance could reach $2,400 and potentially retest the all-time high of $2,432.
However, if gold fails to sustain above the $2,363 support level, the next support level for the buyers could be at $2,340.

🔥GOLD INTRADAY TRADING STRATEGYJudging from the daily chart of gold, the price of gold hit a record high last Friday, but then there was a correction, falling by about US$87 from the high to around US$2,344. This is because investors are taking profits and exiting the market when they see that the price rally may have been excessive. However, gold rebounded quickly on Monday after falling to around $2,324 and stood above $2,380, indicating that the correction may be over and the upward trend may continue. On the four-hour chart, gold rebounded quickly after falling to the $2,324 line during yesterday's U.S. trading session. The third Bollinger Bands track opened upward, the gold price ran between the middle and upper tracks, and KDJ diverged upward after the golden cross.The MACD green energy column begins to shrink, and the short-term trend becomes stronger.
In terms of the performance of a single trading day, the rebound is much faster than the decline, and there are signs of breaking through to new highs. The hourly line closed with five consecutive positive lines. In contrast, the performance of the negative line is tortuous and has poor continuity, so the current market rhythm is not weak. The decline is only temporary and corrective in nature. In the last trading session, a test of the support below $2333 showed strong support and especially a quick rebound, which confirmed our judgment that even if the price failed to form a bottom at $2333, It only tested the $2,320 level once. Therefore, a corrective low has emerged and the hour line real body closed near the $2,346 support. Therefore, for the next market trend, if the price falls below $2,346 again, you can consider intervening in long orders.
After last Friday's sharp decline, it is still difficult to return directly to strength. We define this week as a correction week and expect the market to remain volatile. There is a pressure range between $2380 and $2400, so we have reason to participate in short selling.
On the whole, today's short-term operation idea for gold is to mainly go short on rebounds, supplemented by longs on callbacks. The key resistance range above is $2380-2390, and the key support range below is $2346-2365.
