ARVSMART Swing (Trendline Support)SWING RESEARCH TO OBSERVE
ARVSMART Looks Good ABOVE 700
SL 580
Target 734, 771, 807, 844, 916
Hold few weeks
Please consult your financial advisor before investing
All research for educational purposes only.
ARVSMART trade ideas

ARVSMART - Triangle PatternARVSMART is making Triangle pattern at 4hr chart, Red Hammer Candle at 9:15am at 4hr chart on 13mar. Inside Bar candle at 9:15am.Also following 9EMA rule.
On 12mar it made a Bullish Engulfing pattern at 4hr time frame and today again gained 10points in the volatile market when Nifty50 was down by about 400points.
For my learning and digital records purpose only!

Box pattern breakoutDaily and weekly volume buildup is significantly good.
Box pattern trendline breakout with good volumes.
Wait for retest on trendline for conformation.
NOTE: I do my analysis, do your before trade.

Arvind Smartspaces LtdARVSMART seems breakout in daily concentrate if the price sustains above 470 in 4hrs

Resistance Breakout - ARVSMARPlease look into the chart for a detailed understanding.
Consider these for short-term & swing trades with 2% profit.
For BTST trades consider booking
target for 1%-2%
For long-term trades look out for resistance drawn above closing.
Please consider these ideas for educational purpose
Please note that, if there are some big targets, those are drawn thinking for long term.

ARVSMART - Symmetrical Continuation Triangle (Bullish)NSE:ARVSMART - DAILY CHART ANALYSIS
Pattern found - "Symmetrical Continuation Triangle (Bullish)"
A "Symmetrical Continuation Triangle (Bullish)" is a technical chart pattern used in technical analysis to predict potential future price movements in financial markets, particularly in stocks, currencies, commodities, or other assets.
This pattern is considered a continuation pattern, implying that it often suggests that the prevailing trend will continue after a period of consolidation.
Traders and investors use this pattern to make trading decisions. When a bullish symmetrical triangle pattern forms, it suggests that there is a good chance the asset's price will continue its previous upward trend, and traders may consider buying the asset.
However, like all technical patterns, it's essential to remember that they are not foolproof, and traders should use other indicators and risk management strategies to guide their decisions.
Always consider the broader market context and use other tools and analysis methods to increase the probability of successful trades or investments.

BREAKOUT IN ARVSMARTARVSMART, closed above 357 on 17/11/2023. Buy at open on 20/11/23.
Stoploss close below-340.8
Target- 480
Risk:Reward- 1:7.7

BREAKOUT, ARVIND SMARTSPACES, 53% RETURNS!!!BUY - ARVIND SMARTSPACES
CMP - Rs. 402
Target - 1: Rs. 524
Target - 2: Rs. 614
.
Timeframe - 4-8 months
.
Technicals - Trendline Breakout
.
This is just a view by an expert analyst, please invest at your own risk.
.
Follow me for more!

ARVSMART - Breakout and Potential RetestIn this technical analysis article, we will examine the recent breakout of ARVSMART and discuss the possibility of a potential retest. It is important to note that this analysis is for educational purposes only and I am not a SEBI registered analyst. If you find this analysis helpful, please like it and leave your comments with any observations you may have.
🚀 Breakout Analysis 🚀
ARVSMART displayed a beautiful breakout on June 1, 2023, accompanied by a strong bullish candle and significant volume. The stock reached an all-time high level, indicating bullish momentum. Now, it appears that the stock might be retracing the breakout with very low volumes, providing a potential entry opportunity.
💡 Entry and Stop Loss Levels 💡
To plan our entry, we can look for a retest above the 75-minute demand zone around 350.6. If the price surpasses this level, it could signal a continuation of the upward trend. However, it is crucial to manage risk effectively. Therefore, it is recommended to set a stop loss below the 75-minute demand zone to protect against potential losses.
⚡ Maximizing Profits ⚡
Since the stock is trading at all-time high levels, it is advisable to trail the stop loss to secure profits in case of further upward movement. This strategy allows traders to lock in gains while still participating in potential future growth.
📚 Key Terms Explained 📚
Breakout : A price movement that surpasses a significant level of resistance or support, often indicating a potential change in trend.
Retest : The act of revisiting a previously broken support or resistance level, which may serve as a confirmation of the breakout.
Demand Zone : A price range where buying interest is likely to be strong, potentially acting as a support level during price declines.
Stop Loss : A predetermined price level at which traders exit a trade to limit potential losses.
🙏 Appreciation and Call to Action 🙏
Thank you for your support, likes, follows, and comments. Your encouragement keeps me motivated to consistently provide valuable analysis. If you find this analysis helpful, please follow me on TradingView for more articles and trade setups: in.tradingview.com
💭 "Trade with confidence and embrace the journey to success!" 💪🚀

Fresh breakout with 5 months consolidation1. Major trend is Bullish
2. RR is lucrative about 1:5, if trade with aggressive SL
3. If target is 545 levels then keep room for price to move and wait for closing SL below 322
4. If trend changes and price to reverse then follow 305 level as SL


Buying Opportunity In ARVSMARTCMP : 308
Target : 329
Stoploss : 294
This is not a buy or sell call, this analysis is shared for educational purpose.

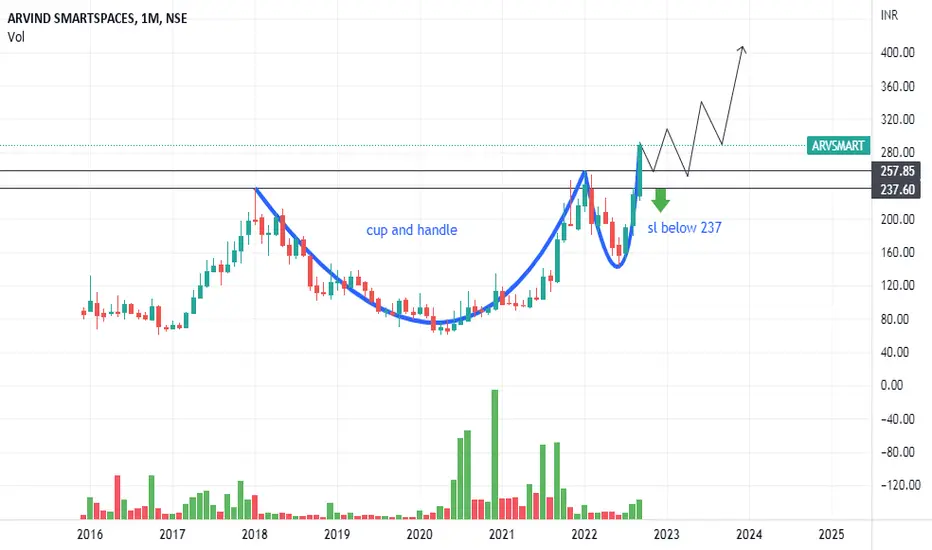
Break of strong trendline1.Arvind smart space broke the strong trendline
2.Forms cup pattern
3.volume is good
Recommended for BTST

higher high formation go long above 342 level higher high formation go long above 342 level
Price to sustain for about 30 mins above this level

Arvind smartspace Arvind smart space formed Head & Shoulder pattern as per pattern and on breakout first target around 380 long term term target is huge if u can hold

Arvind SmartSpaces LimitedARVSMART:- The stock was trading in a small range for many months now it has given a breakout keep an eye.
Hello traders,
As always, simple and neat charts so everyone can understand and not make it too complicated.
rest details mentioned in the chart.
will be posting more such ideas like this. Until that, like share and follow :)
check my other ideas to get to know about all the successful trades based on price action.
Thanks,
Ajay.
keep learning and keep earning.

On Demand - ARVIND SMART SPACESBSE:ARVSMART is looking bullish to me. If it gives a breakout from these levels then it can easily show 300 levels again. I am not sure about its fundamentals but technically its looking strong. So be advised to have a strict SL of 245.

4 Years Multiyear Breakout at ARVSMART 4 Years #Multiyear #Breakout at #ARVSMART (Arvind SmartSpaces Ltd) Weekly Chart. Its Started #Outperformed #Nifty.
What Is the Inverse #headandshoulders ?
An inverse head and shoulders, also called a "head and shoulders bottom", is similar to the standard head and shoulders pattern, but inverted: with the head and shoulders top used to predict reversals in downtrends.
This pattern is identified when the price action of a security meets the following characteristics: the price falls to a trough and then rises; the price falls below the former trough and then rises again; finally, the price falls again but not as far as the second trough. Once the final trough is made, the price heads upward, toward the resistance found near the top of the previous troughs.
An inverse head and shoulders is similar to the standard head and shoulders pattern, but inverted.
It may be used to predict reversals in downtrends.
An inverse head and shoulders pattern, upon completion, signals a bull market
Investors typically enter into a long position when the price rises above the resistance of the neckline.
ONLY FOR #educational
NOT SEBI REGISTERED. #LEARNEARN (TRUST YOURSELF)
#nifty50 #sharemarket #BREAKOUTSTOCKS #Multibagger #sharemarket #sharemarketindia #sensex #technicalanalysis #Chartanalysis #headandshoulders #doubletop #doublebottom #parallelchannel #relativestrength
DISCLAIMER: I am not SEBI registered analyst. All posts are for educational purpose only. I am not responsible for your any loss or profit. Consult your adviser before taking any trade. I help people to learn technical analysis & charts reading.

ARVIND SMARTSPACES FOR POSITIONAL TRADEThis is only for education purpose only. Please check your own analysis before you take a trade
Arvind SmartSpaces Breakout1. Buy or Sell at your own risk
2. Don't risk more than 1%-2% of your capital as stop loss
3. Position Size formula:- Stop Loss Amount/(Buy Price-Initial Stop Loss Price)
4. Sell on RSI close below 30 (or use any other method of your liking)
5. Some other ways to sell stocks can be
a. 25% or 50% up in three weeks or less
b. Weekly tailing tops with high volume
c. Exhaustion gaps
d. Heavy daily volume without further upside
e. Largest one day price drop
After a consolidation since November 2021, NSE:ARVSMART has given a breakout today. Buy with a stop just below ₹220. (One can use the low of the previous bar/supertrend indicator/previous support point/fixed percentage from the buy price as stop loss also)
Strengths: -
1. Quarterly sales growth is at 124% and quarterly profit growth is at 219%, TTM sales growth is at 75% and TTM profit growth is at 86%
2. Debt to equity at 0.07(less than 1 is good), Interest Coverage at 4.66(greater than 3 is good), Current Ratio at 1.59(greater than 1.5 is good)
3. India Ratings and Research (Ind-Ra) has upgraded Arvind SmartSpaces Limited’s (ASSL) Long-Term Issuer Rating to ‘IND A’ from ‘IND A-’. The Outlook is Positive.
Weaknesses: -
1. Stock is trading at 2.57 times its book value
2. The company has delivered a poor sales growth of 10% over the past five years
3. The company has a low return on equity of 8% for the last 3 years
4. Promoter holding has decreased over the last 3 years: -5.58%
Disclaimer: I am not SEBI Registered. Do trade or invest at your own risk, I am not responsible for any losses and won't claim anything from your profits either. Take financial advice from your advisors before jumping in.


Swing trade Entry at current level with positive upside momentum, with SL 170
This recommendation is only for education purpose

ARVIND SMARTSPACE PERFECT PULLBACKArvind Smartspace Monthly Chart show in the brackout and after brackout the share is pullback and than again a good strength, my view this share is good for the upcoming month.
