CG Power breakout soonCG power results looked promising. 20 day SMA analysis shows the constant uptrend. Long term hold is recommended. SL @ 550. Price and Volume are constantly up. Mainly volume spurts are noticed for last couple of weeks.
CGPOWER trade ideas

CGPOWER - 4 Months Consolidation BreakoutCG Power & Industrial Solutions Ltd
1) Time Frame - Weekly.
2) The Stock has been in a Consolidation since (November, 2023). Now It has given a Consolidation breakout & Closed above it's (November, 2023) High with good bullish momentum candle & with good volume in Weekly Time Frame.
3) The stock may find It's next resistance around the (price 620) in short term.
5) Recommendation - Since the market is quite weak Consider Buying it with tight Stop Loss.

CG Power looks strongNSE:CGPOWER has declared a strong set of numbers and continues to do well even in a weak market. Keep a stop loss at 540 (for short term traders) and continue to ride momentum here.

CgpowerThis stock up move as per the below prediction
1.21 Ema above 50 Ema
2.50 Ema above 200 Ema
3.Price above 21 EMA
4.21 Ema retrace
5.Stock in unmoved
5.ROCE >15
6.Debt to equity<1
This is for the educational purposes

Bullish Channel - Ideally suitable for swing and long termBullish Channel - Ideally suitable for swing and long term
Entry point would we be at the lower end of the channel with right stop loss amount.
Depending on swing or long term appropriate targets could be projected and booked appropriately as per the upper channel zones.
Disclaimer: This is published for educational purpose only for understanding the chart structure.
#BullishChannel

CG Power and Industrial Solution - Breakout Setup, Move is ON...#CGPOWER trading above Resistance of 527
Next Resistance is at 647
Support is at 417
Here is previous chart:
Chart is self explanatory. Levels of breakout, possible up-moves (where stock may find resistances) and support (close below which, setup will be invalidated) are clearly defined.
Disclaimer: This is for demonstration and educational purpose only. This is not buying or selling recommendations. I am not SEBI registered. Please consult your financial advisor before taking any trade.

cg power and indus stock : cg power and indus
trade : long
buy @ 550 above
sl @ 505
target 1 @ 630
target 2 @ 660
note :
this information is only for education

BUY TODAY SELL TOMORROW for 5%DON’T HAVE TIME TO MANAGE YOUR TRADES?
- Take BTST trades at 3:25 pm every day
- Try to exit by taking 4-7% profit of each trade
- SL can also be maintained as closing below the low of the breakout candle
Now, why do I prefer BTST over swing trades? The primary reason is that I have observed that 90% of the stocks give most of the movement in just 1-2 days and the rest of the time they either consolidate or fall.
Trendline Breakout in CGPOWER
BUY TODAY SELL TOMORROW for 5%

CG POWER is again RockingThere is a one more stock Which is showing a great opportunity again, stock is near resistance and ready to blast already moved a little today in 4 hour TF. what is your view please comment it down. We are NISM Certified. All views shared on this channel are my personal opinion and is shared for educational purpose and should not be considered advise of any nature.

CGPOWERThere is a one more stock Which is showing a great opportunity, stock is in near resistance. what is your view please comment it down. We are NISM Certified. All views shared on this channel are my personal opinion and is shared for educational purpose and should not be considered advise of any nature. Pasted a image from my private idea because daily idea post limit is reached.

Bullish Continuation Diamond PatternNSE:CGPOWER - Continuation Diamond Pattern (Bullish)
Following a period of consolidation, the price has surged upwards, indicating a potential continuation of the previous upward trend.
The sequence typically initiates within a downtrend, where prices form higher highs and lower lows in a broadening pattern.
Subsequently, as highs reach their peak and lows begin to ascend, the trading range gradually contracts.
Upon the breakout beyond the boundary lines of this diamond-shaped pattern, it signals the revival of the prior uptrend.
PLEASE NOTE THAT:
This chart analysis is only for reference purpose.
This is not buying or selling recommendations.
I am not SEBI registered.
Please consult your financial advisor before taking any trade

CG POwer - LongCG POwer - Long
Price levels
Buy & accumulate zone: 412 - 447
Target 1: 479
Target 2: 502.95
Major Support: 389.7
**Disclaimer:
I am NOT a SEBI registered consultant/Advisor (and NOT any country-authorized board registered consultant/Advisor). It is completely my view and opinion.
My intention is not to provide any financial advice, training advice, or any type of advice or any recommendations on stock/Forex/Coin buying or selling.
Please do your research and consult with your financial advisor before taking any action.
I am not responsible for any of your actions on buying, selling, or holding the above-mentioned stock or/and index or/and Forex or/and coins.

CG POWER looks like cg power is reaady to go back up and its taking its time. will be good to hold a small qty of it right now, and keep adding as you go

CG Power: Range breakout on back of expected good QTR NumbersNSE:CGPOWER - Technical Analysis Update 🚀📊
Current Price: ₹479.65 (as of Jan 5, 2024, 12:08 PM)
Key Indicators:
Opening Price: Above critical level of ₹469.75, indicating a positive trend 🟢
Moving Averages: Recent bullish crossover in EMA and MA
MACD: Anticipated crossover in next 1-2 days; Current MACD at 6.85, Signal at 7.82
Stochastic RSI: Recovery from oversold, K at 61.25, D at 33.09
%R: -31.76, still below upper band
Fisher Transform: Positive crossover at 0.08 (Fisher), -0.37 (Trigger)
Market Outlook:
Positive momentum observed, with a break in the short-term price range.
Bullish signals from moving average and MACD crossovers.
Trading Targets:
First Target: ₹488.50 🎯
Second Target: ₹503.55 🎯
Caution:
STOP LOSS: exit around ₹461.55 - ₹461.80 (0.382 Fibonacci level).
Monitor closely for sustaining the upside movement. ⛔
Conclusion:
CG Power shows strong potential for growth, with key indicators pointing towards a bullish trend. Ideal for investors looking at short to mid-term gains. Stay vigilant and trade smartly! 🌟⚡
Disclaimer:
Informational Purpose: This analysis is for informational purposes and does not constitute financial advice.
No Guarantee: The accuracy or completeness of the information is not guaranteed.
Investment Risks: Stock market investments are subject to market risks, including the loss of principal.
Independent Research: Investors should conduct their own research and consult a financial advisor before making investment decisions.
No Responsibility: The author is not liable for any losses or damages arising from the use of this analysis.
Regulatory Compliance: This analysis is not a guarantee against regulatory risks.
Hashtags:
#CGPower #StockMarketIndia #TechnicalAnalysis#InvestingTips #NSEIndia #TradingView #StocksToWatch #MarketInsights #Finance #TradingSignals #WealthManagement #InvestmentStrategy #BullishTrends #FinancialPlanning

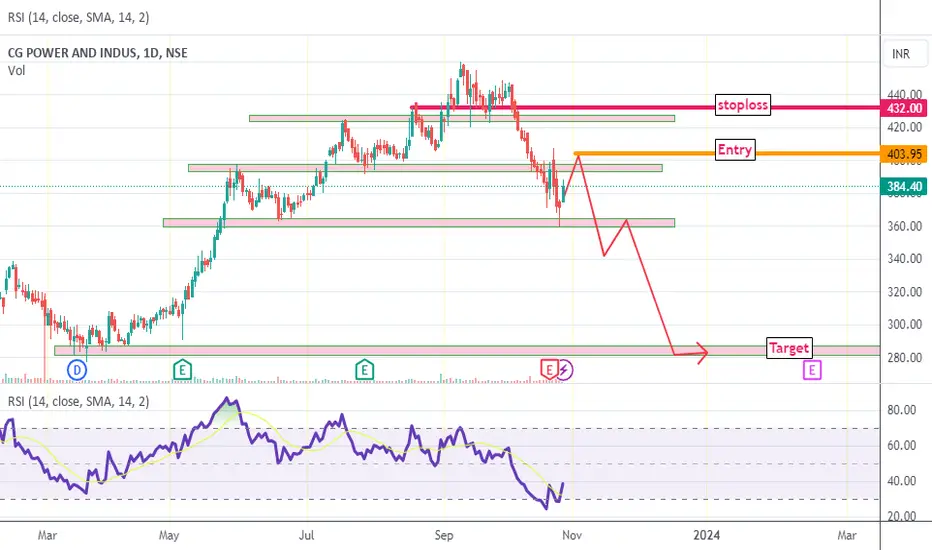
CG POWERS REVERSALCG POWER broke its all levels and ready for downside.
if it get resistance then entry is possible,
so wait watch observe and booommm
CG PowerPower conversion equipment items are designed and produced by CG Power & Industrial Solutions Ltd.
CMP: 400, CGPower reaches an all-time high of 460, and its high has been corrected by nearly 12%. I noticed that the volume was high at the 404 level, and if it crossed that threshold, I thought there was a chance for a good prize.
By going past the 404–405 level, one can go to 425, 450, or 460.
This is not a recommendation; it is merely for educational purposes.
Before making an investment, kindly consult your advisor.

CGPOWER Is heading towords 514cg power is maintaining its bullish momentum and soon it will touch 470 and then 511 withing 2 to three months

Buying On daily charts , after continuous downtrend, there is good candle formation (similar to Piercing pattern but with opening above the previous close) with good volumes on Friday. Also, it is very close to 200 EMA on daily charts. However, weekly and monthly charts are in upward trend. Taking it as a CONTRA trade with small qty at CMP and would build up position as and when the stock resumes uptrend on daily charts.

CG POWER MOVING IN A RANGEThe stock has formed a parallel channel and the stock is at crucial level and can possibly rebound

CGPOWER ( SMC Concepts - Bullish View)This is my own opinion. Am not SEBI Registered consultant. Kindly consult your financial consultant before making your financial decisions.

CG POWER MOVE UPTO 443CG POWER stock move upto 443.
stock is moving ahead and and above EMA34,
So stock is in strong upmove so before retracement it will touch 443.

C. G. Lower continues in uptren &fresh breakout with volumeC. G. Lower- continues in uptrend &
fresh breakout with volume on weekly & monthly chart.. All oscillators are +ve.
Buy above 435
Sl 411
Tgt 443-453-483 as per fib level

CG Power and Industrial Solutions LtdCG Power - Short-term trade
good volume, possible up move
Buy above 433 | Tgt 446, 460 | sl 423
It is my view, to trade at your own analysis
