TD Power system fantastic breakoutTD Power system gave a rectangle breakout with very good volume. RSI also had breakout. Good fundamental company. Capital goods, transformers, oil, gas stocks are good
TDPOWERSYS trade ideas

TD Power Systems - Breakout Setup, Move is ON...#TDPOWERSYS trading above Resistance of 309
Next Resistance is at 390
Support is at 228
Here are previous charts:
Chart is self explanatory. Levels of breakout, possible up-moves (where stock may find resistances) and support (close below which, setup will be invalidated) are clearly defined.
Disclaimer: This is for demonstration and educational purpose only. This is not buying or selling recommendations. I am not SEBI registered. Please consult your financial advisor before taking any trade.

TD Power Systems - Long Setup, Move is ON...#TDPOWERSYS trading above Resistance of 228
Next Resistance is at 309
Support is at 146.20
Here are previous charts:
Chart is self explanatory. Entry, Resistances and Support are mentioned on the chart.
Disclaimer: This is for demonstration and educational purpose only. This is not buying or selling recommendations. I am not SEBI registered. Please consult your financial advisor before taking any trade.

TD powergenerators & motors are designed to meet various applications, specifications, and adapt to different geographical and climatic conditions - showcasing our

TDPOWERSYS: Bullish Opportunity Ahead 🚀The Essence of Technical Analysis
At the heart of trading lies technical analysis – the study of price action and market behaviour through charts and technical indicators. This method helps traders identify trends, patterns, and potential reversal points in the market. By understanding the past and present behaviour of the market, traders can make educated guesses about future price movements.
Decoding the Time Frames
LTF (Lower Time Frame) : This is used for executing trades. It offers a close-up view of recent price action, helping traders make quick decisions.
ITF (Intermediate Time Frame) : It's crucial for identifying the overall trend. This time frame balances detail and broader market perspective.
HTF (Higher Time Frame) : Essential for a broader view and zone identification. It helps in understanding the bigger picture and locating significant support and resistance zones.
Zones to Watch
Zones are footprints of institution and zones are key areas where significant price movements can originate. They are based on historical price action and include:
RBR Zones (Rally-Base-Rally) : Indicate a potential continuation of an uptrend after a consolidation.
RBD Zones (Rally-Base-Drop) : Suggest a potential downtrend following a consolidation.
DBR Zones (Drop-Base-Rally) : Signify a possible uptrend reversal after a downtrend.
DBD Zones (Drop-Base-Drop) : Point towards a continuation of a downtrend.
TDPOWERSYS's Demand Zone Analysis
Let's dive into a practical example by analyzing TDPOWERSYS, which is currently trading close to a potent Daily Time frame (Lower Time Frame) Demand Zone characterized by a Drop-Base-Rally. This zone is especially significant because, following its formation, the stock reached an all-time high. Presently, the price has returned to this zone, indicating a prime buying opportunity.
A trend analysis on the weekly time frame (Intermediate Time Frame) reveals an upward trend, and a location analysis on the monthly time frame (Higher Time Frame) shows the absence of a significant supply zone. This comprehensive analysis suggests that buying from this demand zone could be a strategic move.
Lastly, thank you for your support, your likes & comments. Remember, this analysis is for educational purposes only and not intended as a trading or investment recommendation, as I am not a SEBI registered Analyst.

BUY TODAY SELL TOMORROW for 5%DON’T HAVE TIME TO MANAGE YOUR TRADES?
- Take BTST trades at 3:25 pm every day
- Try to exit by taking 4-7% profit of each trade
- SL can also be maintained as closing below the low of the breakout candle
Now, why do I prefer BTST over swing trades? The primary reason is that I have observed that 90% of the stocks give most of the movement in just 1-2 days and the rest of the time they either consolidate or fall.
Trendline Breakout in TDPOWERSYS
BUY TODAY SELL TOMORROW for 5%

TDPOWERSYSsymbol TDPOWERSYS
company t d power systems ltd.
type long term & swing trade
price 285.5
date of entry 23-02-2024
risk market slowdown

Perfect morning star after a retracementA great opportunity to enter long after the presence of this clear morning star after a small retracement in the uptrend in daily chart
But in trading nothing works 10 percent .so,a decent stop loss in place.

"TDPOWERSYS: Capitalizing on a Strong Uptrend"Description:
📈 TDPOWERSYS: Riding the Momentum of a Strong Uptrend! 🚀
Prepare to embark on a profitable journey with TDPOWERSYS, a stock that's riding a robust uptrend. Here's why this trade setup deserves your attention:
Key Points:
📊 Entry Price (in Rupees): Consider entering the trade at Rs 250, positioning yourself for potential gains as TDPOWERSYS continues its impressive uptrend.
❌ Stop Loss (in Rupees): Safeguard your investment with a stop loss at Rs 218. This level acts as a critical safety net in case the trade doesn't unfold as anticipated.
🎯 Target Price (in Rupees): Our target is set at Rs 310, reflecting a substantial potential upside. This is where you may contemplate taking profits.
🕒 Trade Duration: Plan to hold this trade for 45 to 90 days, aligning with your trading strategy and market conditions.
📈 Risk-Reward Ratio: The risk-to-reward ratio for this trade is approximately 1:1.39. For every unit of risk, there's a potential reward of 1.39 units, resulting in a risk-reward ratio of "1:1.39."
🚀 Trade Strategy: Stay confident as TDPOWERSYS continues its strong uptrend. Keep your stop loss intact and consider trailing it periodically to secure gains as the stock progresses.
📉 Correction from Highs: TDPOWERSYS has undergone a healthy correction from its higher levels, creating an attractive entry opportunity.
📊 Trading on Support: The stock is currently trading on a supportive level, with today's daily candle indicating a potential bounce back.
💰 Favorable Risk to Reward: This trade presents a favorable risk-to-reward ratio, allowing you to aim for higher rewards while diligently managing risk.
This trade idea offers a comprehensive plan, complete with a calculated risk-to-reward assessment. Capitalize on the strength of TDPOWERSYS' uptrend with confidence and seize the opportunity for potential gains. Happy trading!
(Note: Always conduct your own research and assess your risk tolerance before executing any trade. Trading involves risks, and past performance is not indicative of future results.) 📊💼🧐

TDPOWERSYSTEMMOMENTUM TRADE
TDPOWER SYSTEM
Symmetrical Traingle pattern breakout
High volume
Above 50 EMA
T1-163.5 (As per Fibonacci Retracement)
T2-200+ (As per Fibonacci Retracement)
SL - 128
This chart is only for educational purpose
Do your own study before taking any trades

TDPOWERSYS LongParallel Channel BO
TDPOWERSYS
Buy above 241
SL below 210
Targets 252, 270
***Educational Purpose only***

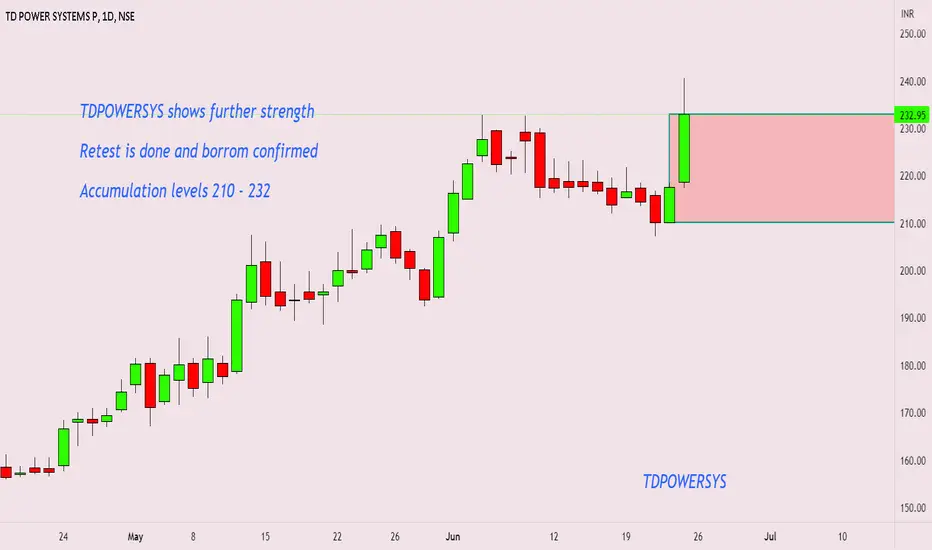
#TDPOWERSYSTDPOWERSYS shows further strength
Retest is done and borrom confirmed
Accumulation levels 210 - 232
TD Power systemsTD Power systems - short term
Buy above 255 | Tgt 270 | sl 247
Keep this stock in your radar to catch the momentum

TDPOWERSYS NEW TRENDLINE BOUNCE> fibonacci retracement @50% on a trendline
> this pattern also happend previosly (marked)
> go long at least 8-10%
> SL below horizontal support, this is also a rotation period, so its a strong support

TDPOWERSYS - Ichimoku BreakoutStock Name - Td Power Systems Limited
Ichimoku Cloud Setup :
1). Today's close is above the Conversion Line
2). Future Kumo is Turning Bullish
3). Chikou span is slanting upwards
All these parameters are showing bullishness at Current Market Price
and more bullishness AFTER crossing 250
#This is not Buy and Sell recommendation to any one. This is for education purpose and a helping hand to learn trading in Market.
# Cloud Trading
# Ichimoku Cloud
# Ichimoku Followers
I hope you all like my analysis.
Please do share your thoughts into comment section.
Please give a like, share & subscribe for daily analysis.


BUY TODAY SELL TOMORROW for 5% DON’T HAVE TIME TO MANAGE YOUR TRADES?
- Take BTST trades at 3:25 pm every day
- Try to exit by taking 4-7% profit of each trade
- SL can also be maintained as closing below the low of the breakout candle
Now, why do I prefer BTST over swing trades? The primary reason is that I have observed that 90% of the stocks give most of the movement in just 1-2 days and the rest of the time they either consolidate or fall
Trendline Breakout in TDPOWERSYS
BUY TODAY SELL TOMORROW for 5%

TD POWER SYSTEMS TARGET 257TD POWER SYSTEMS weekly and daily uptrend channel breakout. And day closing is bullish. If opens above 193 and sustains above in daily it will reach the first target 226 and next 257

TD POWER SYSYTEM LONG 6 MONTHS AT LEASTNSE:TDPOWERSYS
As per price action Buy between 140 to 160
Possible Targets - 200 T0 231
Its price action based study

TD Power Systems - Bounced up from Support LineEngaged in the manufacturing of Ac generators and electric motors . Company is reducing debt with zero promoter pledge. Stock is moving closer towards its 52 week high. Moving through a parallel band now . Broken the resistance level and retested back . Again its bouncing up from its support level or trend line to break the upper trendline of the band.

TD Power systems - Broken the resistance level Engaged in the manufacturing of Ac generators and electric motors . Company is reducing debt with zero promoter pledge. Stock is near 52 week high. Moving through a parallel band now . Now broken the resistance level.

Formation of cup pattern 1.tdpower is travelling in all time high
2.formation of trendline ..high resistance @ 155 might be a institutional zone to note
3.if it is gap up can expect more highs
Support near 148

Resistance Breakout in TDPOWERSYS DON’T HAVE TIME TO MANAGE YOUR TRADES?
- Take BTST trades (high momentum stocks) at 3:25 pm every day
- Try to exit by taking 4-7% profit of each trade
- SL can also be maintained as closing below the low of the breakout candle
Now, why do I prefer BTST over swing trades? The primary reason is that I have observed that 90% of the stocks give most of the movement in just 1-2 days and the rest of the time they either consolidate or fall
Resistance Breakout in TDPOWERSYS
BUY TODAY SELL TOMORROW for 5%
