Fills
Introduction
Some of Pine Script’s visual outputs, including plots, hlines, lines, boxes, and polylines, allow one to fill the chart space they occupy with colors. Three different mechanisms facilitate filling the space between such outputs:
- The fill() function fills the space between two plots from plot() calls or two horizontal lines (hlines) from hline() calls with a specified color.
- Objects of the linefill type fill the space between line instances created with line.new().
- Other drawing types, namely boxes and polylines, have built-in properties that allow the drawings to fill the visual spaces they occupy.
`plot()` and `hline()` fills
The fill() function fills the space between two plots or horizontal lines. It has the following two signatures:
fill(plot1, plot2, color, title, editable, show_last, fillgaps) → void
fill(hline1, hline2, color, title, editable, fillgaps) → void
The plot1, plot2, hline1, and hline2 parameters accept plot
or hline IDs returned by
plot() and
hline() function calls.
The fill() function is the only built-in that
can use these IDs.
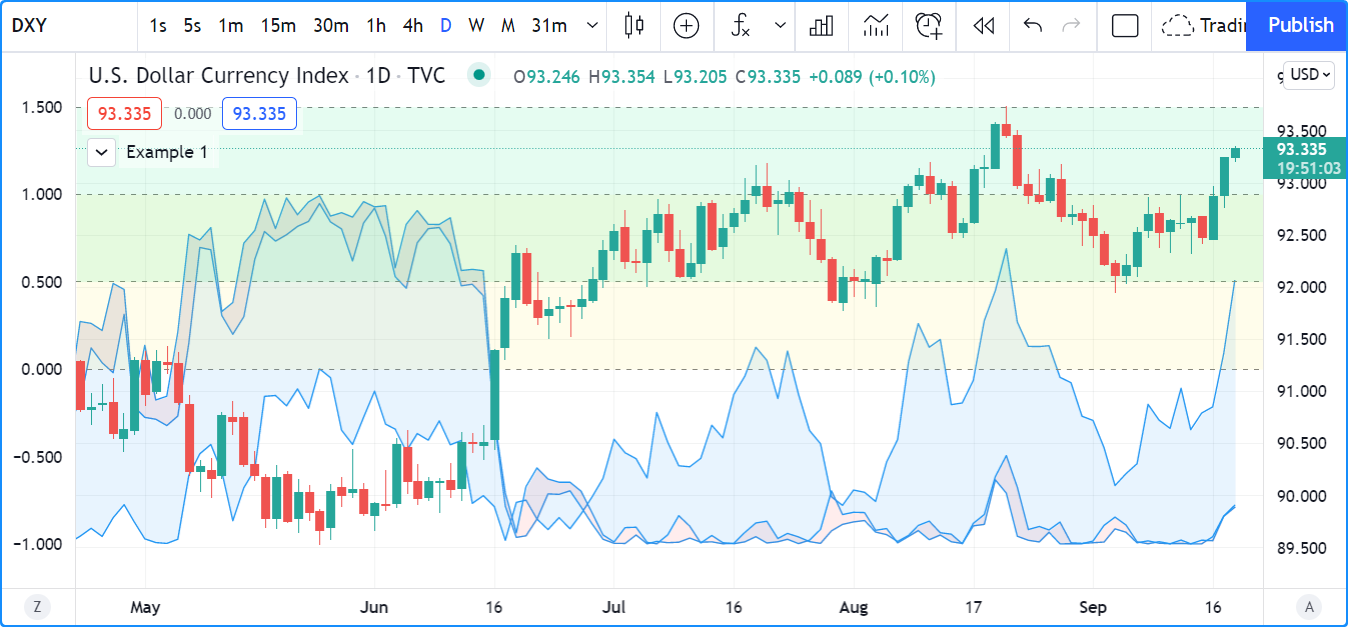
This simple example demonstrates how the fill()
function works with plot and hline IDs. It calls
plot() and
hline() three times to display arbitrary
values on the chart. Each of these calls returns an ID, which the script assigns to variables for use in the
fill() function. The values of p1,
p2, and p3 are “plot” IDs, whereas h1, h2, and h3 reference “hline” IDs:
//@version=5
indicator("Example 1")

// Assign "plot" IDs to the `p1`, `p2`, and `p3` variables.
p1 = plot(math.sin(high), "Sine of `high`")
p2 = plot(math.cos(low), "Cosine of `low`")
p3 = plot(math.sin(close), "Sine of `close`")
// Fill the space between `p1` and `p2` with 90% transparent red.
fill(p1, p3, color.new(color.red, 90), "`p1`-`p3` fill")
// Fill the space between `p2` and `p3` with 90% transparent blue.
fill(p2, p3, color.new(color.blue, 90), "`p2`-`p3` fill")

// Assign "hline" IDs to the `h1`, `h2`, and `h3` variables.
h1 = hline(0, "First level")
h2 = hline(1.0, "Second level")
h3 = hline(0.5, "Third level")
h4 = hline(1.5, "Fourth level")
// Fill the space between `h1` and `h2` with 90% transparent yellow.
fill(h1, h2, color.new(color.yellow, 90), "`h1`-`h2` fill")
// Fill the space between `h3` and `h4` with 90% transparent lime.
fill(h3, h4, color.new(color.lime, 90), "`h3`-`h4` fill")
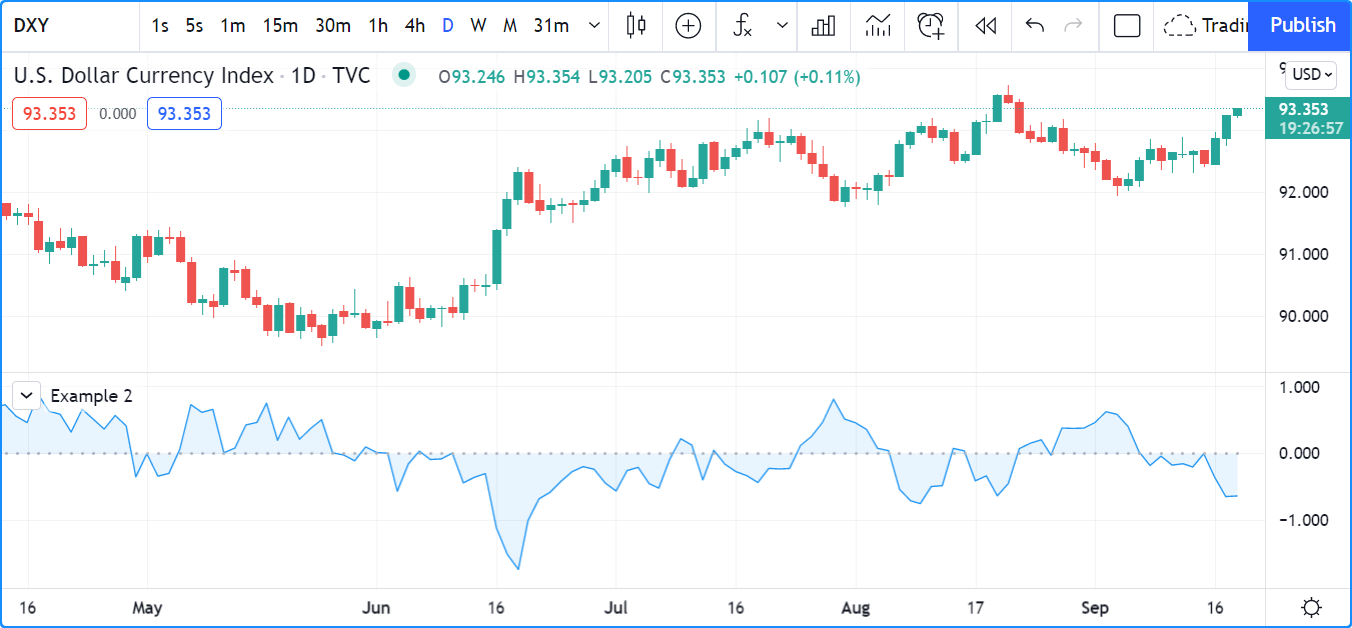
It’s important to note that the fill() function requires either two “plot” IDs or two “hline” IDs. One cannot mix and match these types in the function call. Consequently, programmers will sometimes need to use plot() where they otherwise might have used hline() if they want to fill the space between a consistent level and a fluctuating series.
For example, this script calculates an oscillator based on the percentage distance between the chart’s
close price and a 10-bar
SMA, then plots it on the chart pane.
In this case, we wanted to fill the area between the oscillator and zero. Although we can display the zero level with
hline() since its value does not change, we cannot
pass a “plot” and “hline” ID to the fill() function.
Therefore, we must use a plot() call for the level to
allow the script to fill the space:
//@version=5
indicator("Example 2")

//@variable The 10-bar moving average of `close` prices.
float ma = ta.sma(close, 10)
//@variable The distance from the `ma` to the `close` price, as a percentage of the `ma`.
float oscillator = 100 * (ma - close) / ma

//@variable The ID of the `oscillator` plot for use in the `fill()` function.
oscPlotID = plot(oscillator, "Oscillator")
//@variable The ID of the zero level plot for use in the `fill()` function.
//          Requires a "plot" ID since the `fill()` function can't use "plot" and "hline" IDs at the same time.
zeroPlotID = plot(0, "Zero level", color.silver, 1, plot.style_circles)

// Filll the space between the `oscPlotID` and `zeroPlotID` with 90% transparent blue.
fill(oscPlotID, zeroPlotID, color.new(color.blue, 90), "Oscillator fill")
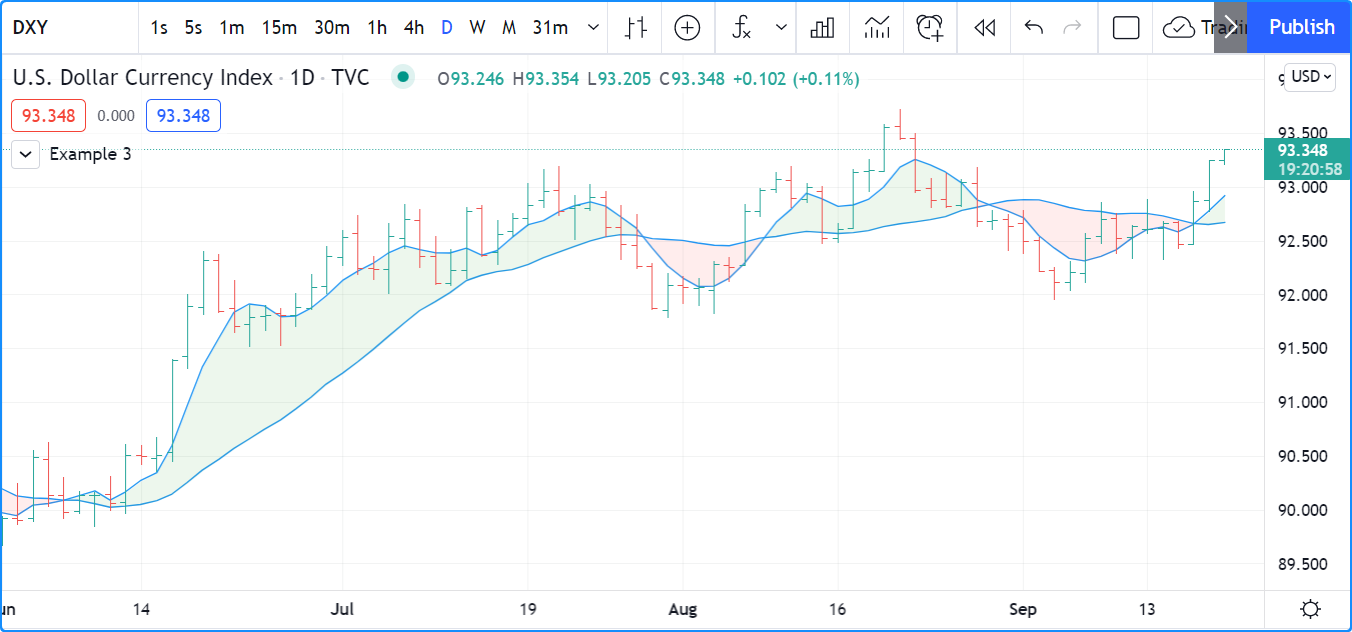
The color parameter of the fill()
function accepts a “series color” argument, meaning the fill’s color can change across chart bars. For example,
this code fills the space between two moving average plots with 90% transparent green or red colors based on
whether ma1 is above ma2:
//@version=5
indicator("Example 3", overlay = true)

//@variable The 5-bar moving average of `close` prices.
float ma1 = ta.sma(close, 5)
//@variable The 20-bar moving average of `close` prices.
float ma2 = ta.sma(close, 20)

//@variable The 90% transparent color of the space between MA plots. Green if `ma1 > ma2`, red otherwise.
color fillColor = ma1 > ma2 ? color.new(color.green, 90) : color.new(color.red, 90)

//@variable The ID of the `ma1` plot for use in the `fill()` function.
ma1PlotID = plot(ma1, "5-bar SMA")
//@variable The ID of the `ma2` plot for use in the `fill()` function.
ma2PlotID = plot(ma2, "20-bar SMA")

// Fill the space between the `ma1PlotID` and `ma2PlotID` using the `fillColor`.
fill(ma1PlotID, ma2PlotID, fillColor, "SMA plot fill")
Line fills
While the fill() function allows a script to fill the space between two plots or hlines, it does not work with line objects. When a script needs to fill the space between lines, it requires a linefill object created by the linefill.new() function. The function has the following signature:
linefill.new(line1, line2, color) → series linefill
The line1 and line2 parameters accept line IDs.
These IDs determine the chart region that the linefill
object will fill with its specified color. A script can update the color property of a
linefill ID returned by this function by calling
linefill.set_color() with the ID as its
id argument.
The behavior of linefills depends on the lines they reference. Scripts cannot move linefills directly, as the lines that a linefill uses determine the space it will fill. To retrieve the IDs of the lines referenced by a linefill object, use the linefill.get_line1() and linefill.get_line2() functions.
Any pair of line instances can only have one
linefill between them. Successive calls to
linefill.new() using the same line1 and
line2 arguments will create a new linefill ID
that replaces the previous one associated with them.
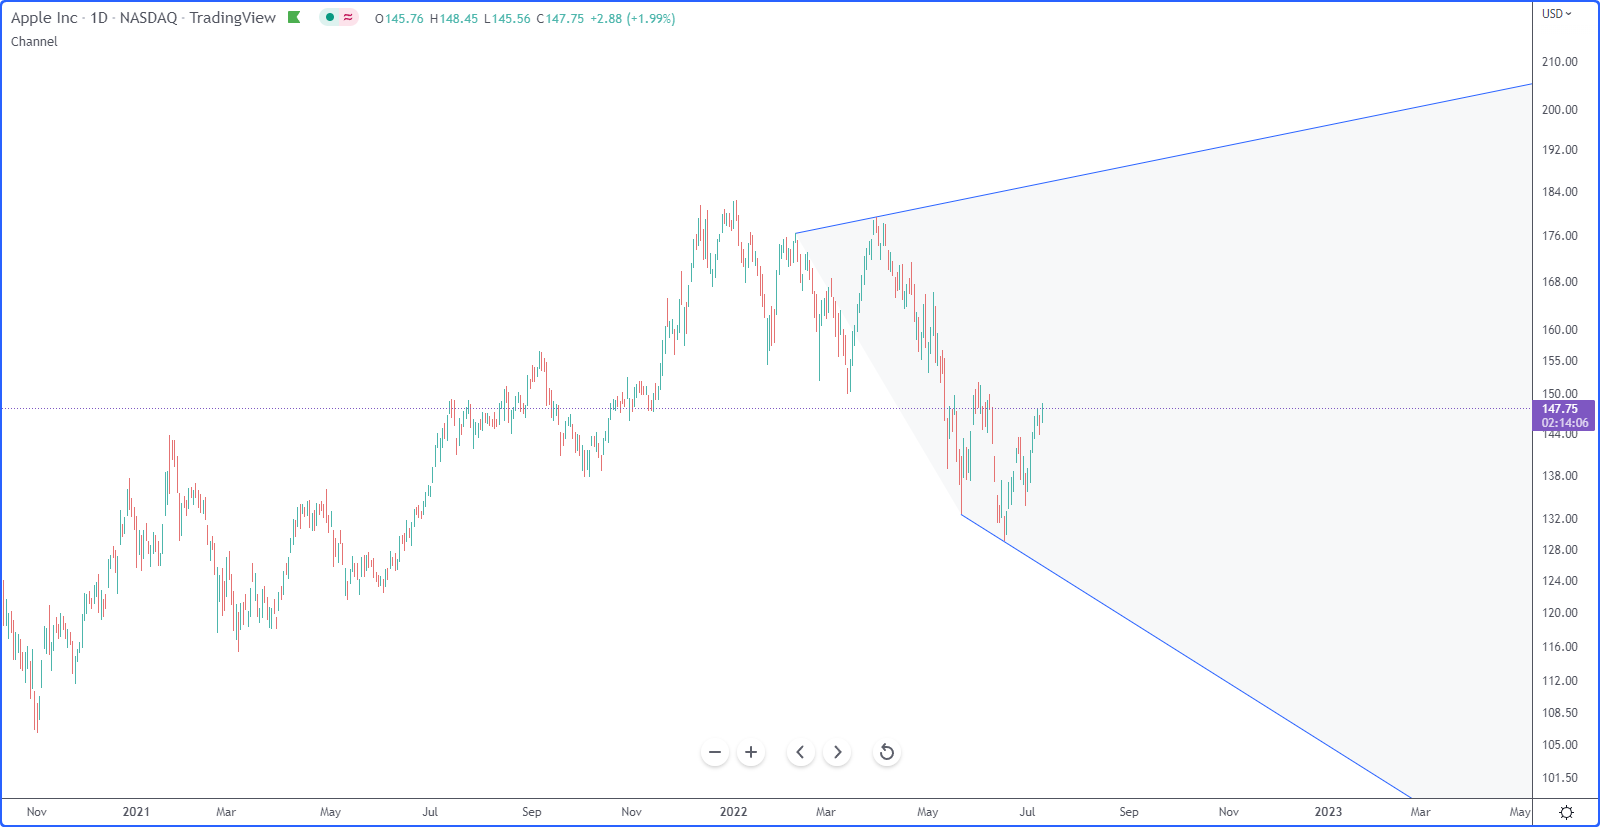
The example below demonstrates a simple use case for linefills. The script calculates a pivotHigh and pivotLow
series using the built-in ta.pivothigh() and
ta.pivotlow() functions with constant leftbars
and rightbars arguments. On the last confirmed historical bar, the script draws two extended lines. The first line connects
the two most recent non-na pivotHigh values, and the second connects the most recent non-na pivotLow values.
To emphasize the “channel” formed by these lines, the script fills the space between them using linefill.new():
//@version=5
indicator("Linefill demo", "Channel", true)

//@variable The number bars to the left of a detected pivot.
int LEFT_BARS = 15
//@variable The number bars to the right for pivot confirmation.
int RIGHT_BARS = 5

//@variable The price of the pivot high point.
float pivotHigh = ta.pivothigh(LEFT_BARS, RIGHT_BARS)
//@variable The price of the pivot low point.
float pivotLow = ta.pivotlow(LEFT_BARS, RIGHT_BARS)

// Initialize the chart points the lines will use.
var firstHighPoint  = chart.point.new(na, na, na)
var secondHighPoint = chart.point.new(na, na, na)
var firstLowPoint   = chart.point.new(na, na, na)
var secondLowPoint  = chart.point.new(na, na, na)

// Update the `firstHighPoint` and `secondHighPoint` when `pivotHigh` is not `na`.
if not na(pivotHigh)
    firstHighPoint  := secondHighPoint
    secondHighPoint := chart.point.from_index(bar_index - RIGHT_BARS, pivotHigh)
// Update the `firstLowPoint` and `secondLowPoint` when `pivotlow` is not `na`.
if not na(pivotLow)
    firstLowPoint  := secondLowPoint
    secondLowPoint := chart.point.from_index(bar_index - RIGHT_BARS, pivotLow)

if barstate.islastconfirmedhistory
    //@variable An extended line that passes through the `firstHighPoint` and `secondHighPoint`.
    line pivotHighLine = line.new(firstHighPoint, secondHighPoint, extend = extend.right)
    //@variable An extended line that passes through the `firstLowPoint` and `secondLowPoint`.
    line pivotLowLine = line.new(firstLowPoint, secondLowPoint, extend = extend.right)
    //@variable The color of the space between the lines.
    color fillColor = switch
        secondHighPoint.price > firstHighPoint.price and secondLowPoint.price > firstLowPoint.price => color.lime
        secondHighPoint.price < firstHighPoint.price and secondLowPoint.price < firstLowPoint.price => color.red
        =>                                                                                             color.silver
    //@variable A linefill that colors the space between the `pivotHighLine` and `pivotLowLine`.
    linefill channelFill = linefill.new(pivotHighLine, pivotLowLine, color.new(fillColor, 90))
Box and polyline fills
The box and polyline types allow scripts to draw geometric shapes and other formations on the chart. Scripts create boxes and polylines with the box.new() and polyline.new() functions, which include parameters that allow the drawings to fill their visual spaces.
To fill the space inside the borders of a box with a
specified color, include a bgcolor argument in the box.new()
function. To fill a polyline’s visual space, pass a fill_color argument to the
polyline.new() function.
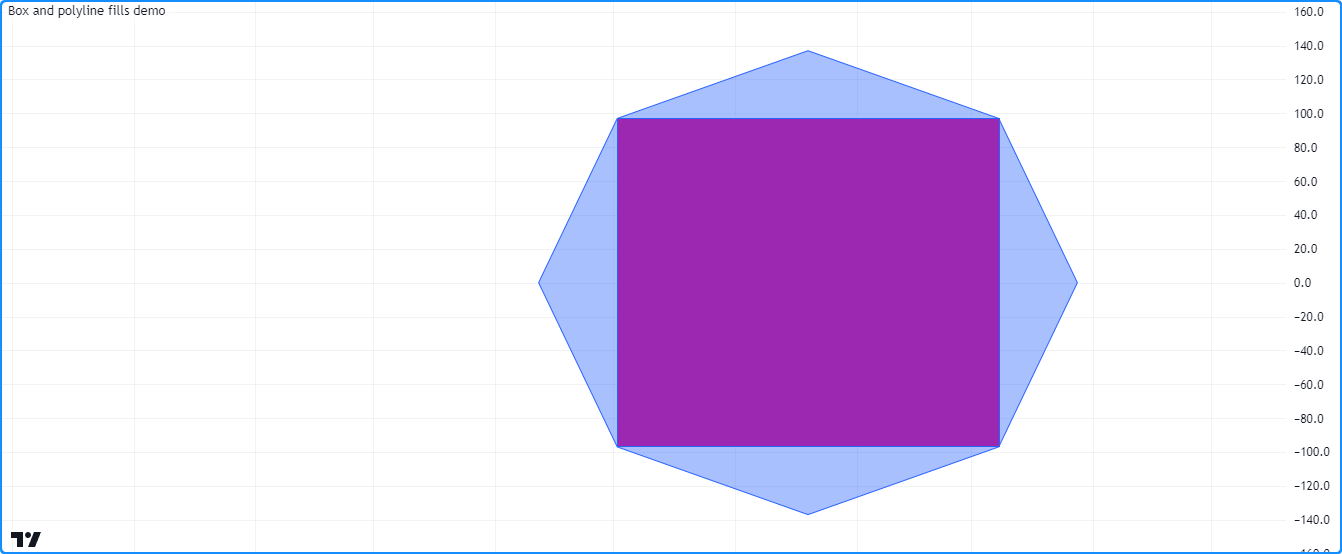
For example, this script draws an octagon with a polyline
and an inscribed rectangle with a box on the last confirmed
historical bar. It determines the size of the drawings using the value from the radius variable, which corresponds to
approximately one-fourth of the number of bars visible on the chart. We included fill_color = color.new(color.blue, 60)
in the polyline.new() call to fill the octagon with a
translucent blue color, and we used bgcolor = color.purple in the
box.new() call to fill the inscribed rectangle
with opaque purple:
//@version=5
indicator("Box and polyline fills demo")

//@variable The number of visible chart bars, excluding the leftmost and rightmost bars.
var int barCount = 0
if time > chart.left_visible_bar_time and time < chart.right_visible_bar_time
    barCount += 1

//@variable The approximate radius used to calculate the octagon and rectangle coordinates.
int radius = math.ceil(barCount / 4)

if barstate.islastconfirmedhistory
    //@variable An array of chart points. The polyline uses all points in this array, but the box only needs two.
    array<chart.point> points = array.new<chart.point>()
    //@variable The counterclockwise angle of each point, in radians. Updates on each loop iteration.
    float angle = 0.0
    //@variable The radians to add to the `angle` on each loop iteration.
    float increment = 0.25 * math.pi
    // Loop 8 times to calculate octagonal points.
    for i = 0 to 7
        //@variable The point's x-coordinate (bar offset).
        int x = int(math.round(math.cos(angle) * radius))
        //@variable The point's y-coordinate.
        float y = math.round(math.sin(angle) * radius)
        // Push a new chart point into the `points` array and increase the `angle`.
        points.push(chart.point.from_index(bar_index - radius + x, y))
        angle += increment
    // Create a closed polyline to draw the octagon and fill it with translucent blue.
    polyline.new(points, closed = true, fill_color = color.new(color.blue, 60))
    // Create a box for the rectangle using index 3 and 7 for the top-left and bottom-right corners,
    // and fill it with opaque purple.
    box.new(points.get(3), points.get(7), bgcolor = color.purple)
See this manual’s Lines and boxes page to learn more about working with these types.