NLCINDIA LongDate : 01-06-2024
-------------------------------------
SWING RESEARCH TO OBSERVE
NLCINDIA Looks Good ABOVE 250
SL 200
Target 280, 296, 334, 371, 400
Hold few weeks
Please consult your financial advisor before investing
All research for educational purposes only.
NLCINDIA trade ideas


NLCINDIA Analysis & Prediction in DTFThis is the analysis of NLCINDIA in Daily Time Frame. Watch carefully. The chart explains itself.
There are some prediction levels. These Levels act as Support and Resistance according to position of price. You have to trade according to level breakout or breakdown.
Always maintain your risk management.
Book your profit according to your “STOMACH”.
Disclaimer:
This is not investment advice. I am not a SEBI Registered Analyst. Anything posted here is my own analysis and views. This is created for educational purposes only. Always consult your Financial Advisor before taking any decision or trade.
Happy trading.
About NLCINDIA :
NLC India Ltd. engages in the provision of mining and energy properties. It operates through the Mining and Power Generation segments. The Mining segment includes mining of lignite and coal. The Power Generation involves the generation of power and sale to power utilities across the country. The company was founded on November 14, 1956 and is headquartered in Neyveli, India.

NLCINDIA | Good for Long |
CMP: 250.55
NSE:NLCINDIA
Reason for Trade : Resistance BO
Entry : Cmp or near Support 245-235
Stop Loss: According to one's Risk Reward ratio
#Study, Learn & Earn.
If you love this post please like and comment your thoughts below. That will be a great motivation for me to post similar ideas ahead.
Disclaimer: All the information posting on this page are for the educational purpose only, we are not SEBI registered financial advisor. We wont recommend any BUY/SELL of stocks. Contact your financial advisor before taking any action

nlcindiastock : nlcindia
trade : long (cash segment)
buy @ 294 above
sl @ 234
target @ 290
note :
this information is for education only

BREAKOUT IN NLC 📌SWING TRADE FOR NEXT WEEK🚀
Hello Traders⚡
I am a Swing Trader by Passion i only trade on Momentum Stock's.
📌I Post Daily SWING CHARTS Analysis on My Trading view profile..
So let's Start
📌TRADE ANALYSIS OF -NLC-
• Potential Breakout Chart
• VCP Pattern
• Short Range Consolidation
• Price Can Take Retest from support Line
• Overall The Price Is Moving In HH-HL Formation
• Volume Buildup Near BO Zone
• Looks Good For 10-20% Upside Levels After The Breakout
📌 If you have any questions about any stock you can comment on post 📱
📌Disclaimer:-
This all chatrs analysis are only for educational purposes only
I do not provide any CALL or Tips

NLCINDIA - SWING TRADE - 3rd December #stocksNLCINDIA (1D TF)
Swing Trade Analysis given on 3rd December, 2023 (Sunday)
Pattern: RECTANGLE BOX BREAKOUT
- Volume Buildup Near Resistance - Done ✓
- Trendline Breakout - Done ✓
- Retracement + Consolidation - In Progress
#stocks #swingtrade #chartanalysis #priceaction #traderyte #nlcindia

NLC INDIA NEAR MULTI YEAR BREAKOUT@NLC INDIA Stock Near Multi year breakout on weekly chart...First breakout fail...
Now consolidate before breakout...if price break resistance level and sustain price..then its ready Big Move
So wait Break out with Volume.
Tecnical Analysis
RSI-above 50
RS-Positive
Super trend-Positive
Fundamental Analysis
Sales Growth-16%(CAGR)
Profit Growth-19%(CAGR)
PE-13(Below Industry PE)
ROE-15.5%
Debt to equity-1.32(its negative for me)
Strategy- Buy on Dip
Stop Loss-Super trend or anything else
Disclaimer
This Analysis is for Educational purpose only
not recommendation any buy or sell
Please do your study

BREAKOUT IN NLC 📌SWING TRADE FOR NEXT WEEK🚀
Hello Traders⚡
I am a Swing Trader by Passion i only trade on Momentum Stock's.
📌I Post Daily SWING CHARTS Analysis on My Trading view profile..
So let's Start
📌TRADE ANALYSIS OF NLC IND
• Potential Breakout Chart
• VCP Pattern
• Short Range Consolidation
• Price Can Take Retest from support Line
• Overall The Price Is Moving In HH-HL Formation
• Volume Buildup Near BO Zone
• Looks Good For 10-20% Upside Levels After The Breakout
📌 If you have any questions about any stock you can comment on post 📱
📌Disclaimer:-
This all chatrs analysis are only for educational purposes only
I do not provide any CALL or Tips

NLCINDIA#NLCINDIA has taken support from the demand zone after the low-volume pullback. Sl below the demand zone.

NLC INDIA SUSTAINING MULTI YR BREAKOUTNLC INDIA, 170, is sustaining after breakout of 135 weekly/monthly range with volumes. Stock likely to test 210-240 range. Use dips till 145.
invalid below 135 closing on weekly basis

NLCNLC india moving towards all time high. Getting support at 222. In recent days stock gained good amount of buying volume. If this rally getting same power we expect this price at 248.

short term pick NSE:NLCINDIA bullish flag and look like inside candlestick pattern
target will be 196 stoploss 164.

TIME CYCLE AND FIBONACCI SPIRAL" GOD MUST BE A MATHEMATICIAN " If we look at the construction of universe and movements of the planets & other celestial objects movements, flowering & fruiting cycles in trees etc. everything has a pattern and they are cyclical in nature. That very same assumption is applied and works well in stock market, commodities and forex as well.
Identifying the time zones of a stocks is a pure trial and error method where one needs to find the high and low making cycle of a particular stock manually. Here NLC INDIA LTD has been taken as an example and a Price and Time analysis has been done on monthly chart using Time Zones & Fibonacci Spiral for future support and hypothetical path identification.
The lows of the trend labelled as W, X,Y in rectangular spots. Point "X" has been formed 79 Months after the point "W". But magically Point "Y" has been formed after 79 months after Point "X"
The highs of the trend are labelled as A & B in circular spot. Point "B" has been formed 79 Months after Point "A". Looking at the cycle of 79 Months in the Lows and Highs Formation we can make an assumption that the next high ( Point "C" ) would be after 79 Months from Point "B" ie. Dec 2023.
Fibonacci Spiral is a natural pattern that can be seen everywhere in nature including flowers, pinecones, hurricanes and even huge spiral galaxies in space. This is rarely used but useful pattern in charts for finding expected supports and resistance. In this chart we can see that after the formation of low at Point "Y", with the help of Fibonacci Spiral we have a continuous expected support. Till now after 2.5 Years the monthly closing of a single candle has never been below the Fibonacci Spiral(try to adjust the X axis of the chart incase you don't see a perfect fit) .So the fact if Fibonacci Spiral used wisely can be a useful pattern for finding support and resistance levels cannot be denied.
Currently NLC INDIA LTD is at resistance of the trendline drawn from the previous 2 highs ie. Point "A" & "B". Hopefully it will breakout because stock increases at a increasing near its high, which hasn't happened yet with this stock. Till now NLC_INDIA is far away from its expected high according to the time cycle and Trend based fibonacci retracement level. The gann level of 1.33 is at 136.55 by Trend based fibonacci retracement and the expected time is Dec 2023 time cycle. Thus this is how a hypothetical conclusion can be drawn that NLC INDIA LTD will attain a price level of 136.55 by DEC 2023.
Recently a study was done on NIFTY, predicting perfectly the low making day and the target date for NIFTY proving that time cycles works very well with indices and stocks.Link has been given below.
STUDY & ANALYSIS
ADARSH KUMAR DEY

Resistance Breakout - NLCINDIAPlease look into the chart for a detailed understanding.
Consider these for short-term & swing trades with 2% profit.
For BTST trades consider booking
target for 1%-2%
For long-term trades look out for resistance drawn above closing.
Please consider these ideas for educational purpose
Please note that, if there are some big targets, those are drawn thinking for long term.

NLC INDIA 1DGave a bO on daily time frame with a strong uptrend and after consolidation in uptrend + good volumes. can give good returns in swing trading

NLC INDIA-Looks bullishNLC INDIA-RSI ideally placed. spurt in volume with rounding bottom- suggests a target of 150

NLC INDIA - FUTURE MULTIBAGGER STOCK!!!BUY - NLC INDIA LTD
CMP - Rs. 97
Target - 1: Rs. 133
Target - 2: Rs. 169
Target - 3: Rs. 234
.
.
Technicals - Trendline Breakout
.
This is just a view by an expert analyst, please invest at your own risk.
.
Follow me for more!


BUY TODAY SELL TOMORROW for 5%DON’T HAVE TIME TO MANAGE YOUR TRADES?
- Take BTST trades at 3:25 pm every day
- Try to exit by taking 4-7% profit of each trade
- SL can also be maintained as closing below the low of the breakout candle
Now, why do I prefer BTST over swing trades? The primary reason is that I have observed that 90% of the stocks give most of the movement in just 1-2 days and the rest of the time they either consolidate or fall
Trendline Breakout in NLCINDIA
BUY TODAY SELL TOMORROW for 5%

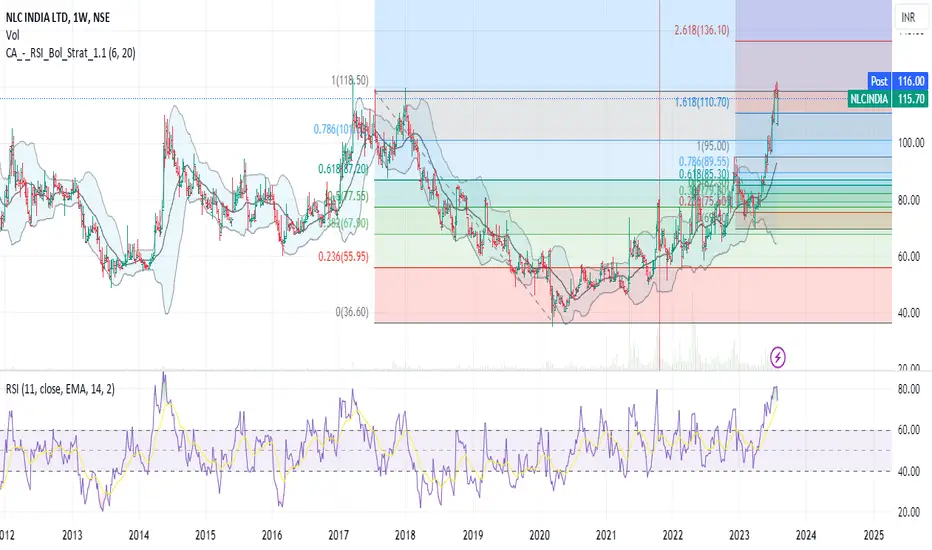
NLC Break outNLC India CMP 115.7
It has touched 121.5 which it crossed 5 years back.
has made perfect rounding bottom, good positive sign.
if it break 122-123 see the fibo levels and confirm targets.
RSI getting positive.
Disclaimer: the idea is for educational purpose not for buy/sell, please ask your advisor before investing.
Nlc- VCL PATTERNNLC
VLC Pattern is forming and nearly 3RD phase of breakout on the hourly chart. Volatality decreased with increasing of price and decreased in volume and making HH-HL.
BUY ABOVE 118
SL 116
TGT 120-122-125
