US OIL TARGET ACHIEVED 🫶As i shared this idea as early as possible .
Hope my followrs have made huge profit with 1:3 risk to reward ratio.
Do Follow for more updates .
Make money together ❤️.
Futures market

gold looking for shortas per price action we can see a nice selling in gold untill asia session low......

Gold price today: Gaining momentum again!Golden information:
According to the weekly report from the US Department of Labor, the number of first-time applications for unemployment benefits in this country has increased to the highest level since August last year. In the week ending May 4, the number of people applying for unemployment benefits for the first time in the US increased by 20,000 people compared to the previous week, an increase that exceeded expectations, to 231,000 people.
The data raises expectations that the Fed will begin cutting interest rates at some point this year. Gold is a non-interest-bearing asset, so the strength of gold prices is often reinforced when the prospect of the Fed cutting interest rates increases.
In addition, gold price this session is also supported by the decrease in USD exchange rate and US Treasury bond yields.
After the US jobs report, the Dollar Index measuring the strength of the USD decreased by about 0.3%, to more than 105.2 points. Gold is priced in USD, so USD depreciation is a beneficial factor for gold prices.

US OIL: DOWNTREND We can see downtrend and could capture big move if price break below the trend line .

Trend analysis and levels for gold by happening Market Trend analysis and levels for gold by happening Market

Bullish - COPPERCopper seems to be breaking out of a continuing Triangle Pattern , Let's observe how it goes.

Natural Gas MCX Future Intraday Level for 10 May, 2024📊 NG MCX Future Technical Chart Analysis
🎯 Range Point: 191.10
🎯 Day Range: 12.90
📉 Buy Above: 188.27
📉 Average At: 186.75
🎯 Buy Target 1: 199.07
🎯 Buy Target 2: 204.00
🛑 Buyer Stoploss: 183.97
📉 Sale Below: 185.23
🎯 Sale Target 1: 183.13
🎯 Sale Target 2: 189.53
🛑 Seller Stoploss: 189.53
Don't forget to reciprocate your love by boosting, following and responding, your actions fuel my efforts to do even better for you!
#NG #NaturalGas #GasPrices #NatGas #EnergyTrading #MCX
#CommoditiesFutures #CommoditiesOptions

🔥GOLD TRADING STRATEGIES💲Gold has been going back and forth recently, with short-term gains reaching a high of 2321 and then falling rapidly. Its trend is still unable to escape the shock pattern, and it is expected to continue to maintain this trend pattern today!.
On the daily chart, gold prices continue to fluctuate, with the current price range roughly fluctuating between 2280 and 2330. In the 4-hour trend, the short-term moving average remains basically stable, indicating that the short-term trend may continue to remain volatile. Currently, the short-term price range is constrained by a narrow range from 2306 to 2320.
The 30-minute moving average shows that the short trend continues, indicating that downward pressure is still there. The price of gold is restricted by the downward trend line, and the rise is blocked, or even falls directly. The current trend line resistance is near 2318, so during the European trading period, the rebound may be limited by the trend line, and it is recommended to continue to be bearish.
On the whole, today's short-term operation of gold recommends mainly shorting on rebounds, supplemented by longs on callbacks. The top short-term focus is on the 2318-2320 resistance range, and the bottom short-term focus is on the 2300-2290 support range.
Gold Trading Strategies Reference
🎯Strategy 1: Go short when gold rebounds to around 2318-2320, stop loss 6 points, target around 2310-2300, break the position and look at the 2290 line✅
🎯Strategy 2: Go long when gold pulls back to around 2290-2293, stop loss by 6 points, target around 2300-2310, and look at the 2320 line if the position is broken✅

GOLD SHOWING A GOOD CLEARCUT UPMOVE In this chat you can see the trendline
The prise crossed the trendline lable
Its mean the prise breaked the trendline
And its also itts breaked the rectangle small zone
It will take time to break fully
But..
After full breakout a good fall momentum will shown in gold
So keep in your mind
This can break
Stay connected with gold
Watch in lower timeframe
After a good confermation
just enter

XAUUSD - Shocking price increaseEveryone, let's find out what's new in the gold market today!
Yesterday, gold saw a significant breakthrough, as the metal rose from around $2300 USD to as high as $2350 USD at the moment, completely shedding previous bearish sentiment.
The weakening of the USD has strongly supported the upward trend in the price of this precious metal. In addition, gold prices rose even higher "after a number of major central banks decided to cut interest rates or signaled their willingness to cut interest rates further in the future." Lower interest rates reduce the "opportunity cost" of holding gold, a non-yielding asset, making it a more attractive investment.
Looking at the chart analysis: Gold is approaching the resistance area as marked.
On the upside: If it succeeds in maintaining this trend and successfully closes above resistance, XAUUSD will open up a profitable opportunity to quickly move towards $2400 USD. On the other hand, if a pullback to correct the trend occurs, XAUUSD will retest the breakout zone at $2330 USD once again, but the uptrend will still be maintained as the 34 EMA is reversing and signaling positivity for buyers.

15 M resistance 15Msupport resistance area... So Sell SL maintain. Support resistance bass trading plan. Happy Trading. Thank you.

4Hr resistance 4hr resistance area... So Area near Sell SL maintain. Support resistance bass trading plan. Happy Trading. Thank you.

Nifty Intraday Levels | 10-05-2024The Green line is marked for breakout,
The Red line is marked for breakdown,
The Black lines are for the target.
Stay tuned, if any levels occur, I will update you in the comment section.

Nifty Institutional levels | Intraday - 10-May-2024Soon i will give update on how to use this IT levels in Options Trading.
Disclaimer:-
The information provided by our advisory service is for educational and informational purposes only. We do not provide investment, financial, or legal advice. Trading and investing involve risks, and past performance is not indicative of future results. Any decision to engage in trading or investment activities is at the sole discretion and risk of the individual. We strongly recommend consulting with a qualified financial advisor or professional before making any investment decisions. We do not guarantee the accuracy, completeness, or reliability of any information provided, and we disclaim any liability for any loss or damage arising from reliance on the information provided. Users are solely responsible for their own investment decisions and actions and off course we are not SEBI registered.
Gold Trend 06/05 - Let's the S-T rebound beginsGold tested the 2280 support 3x last week, with the lowest hitting a 4-week low of 2277. The gold price held on to the 2280 support following a relatively neutral Powell's Fed announcement and weak US employment data. Since the price has bottomed out near the end of last week, expect the gold price to initiate a rebound in S-T.
1-Hr Chart - The gold price has rebounded quickly each time after it touched the 2280(4) support last week, showing strong buying near the 2280-5(4) level. The downward trend that originated on Apr 20 has ended after the price broke out from the downward resistance line(1) in the early Asian session back from the weekend. The S-T target can be set at 2328(2). There is no important economic data scheduled to be released this week, so once the gold price clears the resistance at 2328(2) later this week, the next target can be set at 2350(3).
www.tradingview.com
Daily Chart - The gold price has not been able to stay below 2300(7) for more than one day, reflecting the strong buying support below 2300. We can operate the 10-day MA(5) and the 20-day MA(6), taking advantage of the 2280-2355(8) range in S-T. Based on the current market conditions, I believe the gold price needs more news stimulation for it to escape the 2280-2355(8) range.
Please give me a thumbs up 👍.
Feel free to leave a comment & share your thoughts 🤟.
P. To

BNF support broken. 47000 possible support Bnf broke the support and closed below forming a big red candle. Now the most likely place of support is 47450 and 47000 where the market can take support. Get ready for a few more down points.

XAUUSD or LongMy view on this script Bullish
Ofter breaking Resistance with good dynamics
I took long entry...💹💲

Trend analysis for natural gas by happening Market Trend analysis for natural gas by happening Market !
9 may to 10 May!

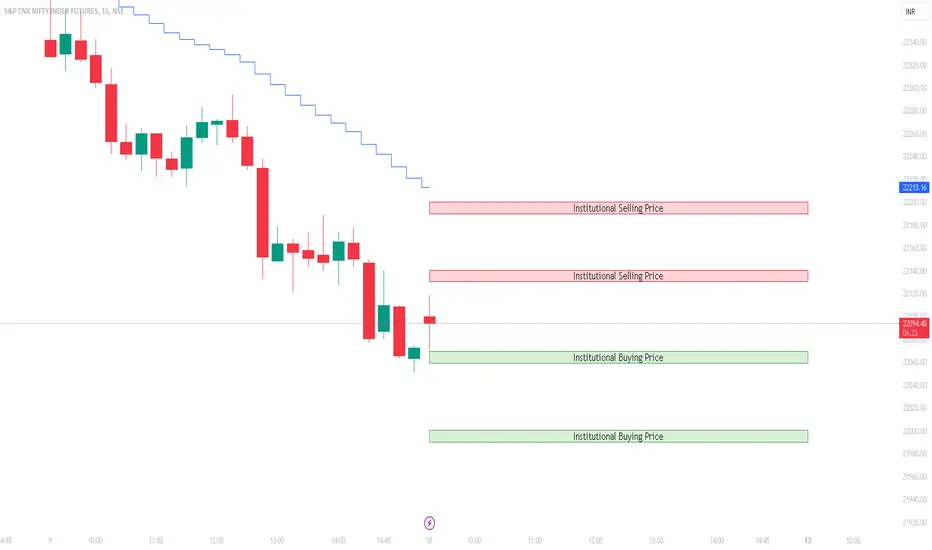
Nifty Institutional Levels | Demand & Supply | INTRADAY TRADING
Disclaimer:-
The information provided by our advisory service is for educational and informational purposes only. We do not provide investment, financial, or legal advice. Trading and investing involve risks, and past performance is not indicative of future results. Any decision to engage in trading or investment activities is at the sole discretion and risk of the individual. We strongly recommend consulting with a qualified financial advisor or professional before making any investment decisions. We do not guarantee the accuracy, completeness, or reliability of any information provided, and we disclaim any liability for any loss or damage arising from reliance on the information provided. Users are solely responsible for their own investment decisions and actions and off course we are not SEBI registered.


🔥Gold Trend Analysis May 8💲Gold showed weakness immediately after the opening yesterday. Although the European market rebounded slightly, the US market once again shot up to around 2323 and then began to fall back to around 2307. Although there is another upward move this morning, bears are still expected to fall. Considering that the overall trend in the early stage is weak, the morning rebound is often a signal for short selling.
The 4-hour trend is currently a rectangular shock consolidation in the mid-term decline. Gold prices have been in a downward trend channel since mid-April. The RSI indicator remains below its 50 midline, showing the bearish sentiment towards gold.
The current rebound of gold is blocked at 2321, failing to break through the downward trend line and beginning to come under pressure. The half-hour chart shows a downward trend, the rebound has encountered resistance, and the highs have begun to fall back under pressure. The downward trend line resistance has dropped to around 2323, and below this is a short-selling opportunity. Short positions can be considered near 2320-2323. The U.S. market can be seen as weakly supported near 2290, and attention will be paid to whether the U.S. market can break through 2300.
Comprehensive analysis, today's short-term gold operation advice is mainly to go short on rebounds, supplemented by long orders on callbacks. The top focus is on the resistance range of 2320-2323, and the bottom focus is on the support range of 2281-2277.

Gold price today: Prospect of price increase delayed!Hello dear friends, let's understand today's gold price!
Currently, today's gold price continues to move above 2,300 USD and has not changed much compared to the same trading session yesterday.
Accordingly, Gold remains at familiar levels in the context of rising US Treasury bond interest rates and a strong US dollar. Traders await unemployment claims on Thursday, followed by the University of Michigan's Consumer Sentiment survey on Friday to find new direction for the metal.
Looking at the outlook from the technical chart:
The 4h chart of XAU/USD shows that the upside potential is still limited, the metal continues to be limited below the resistance of 2335 USD and moves below the two EMAs 34, 89 without a clear direction. Bears may have a better chance of a clear break below the $2,300 mark until Gold breaks below that level and trades around $2,260 according to the trendline.

Update the latest gold price today!Hello everyone, today we will learn about the gold market to determine whether this is the right time to buy or sell.
Starting with the current gold price chart, we see that the gold price has increased by more than 6 USD, currently sitting at around 2131 USD. Even so, there haven't been any significant breakthroughs. Gold prices remain stable around 2,305 USD, and the market is waiting for new information to be announced later in the day to have a clearer view.
There are two important events that will affect the USD exchange rate:
Claim unemployment benefits
Auction of 30-year US bonds
Outlook Analysis: On the 1-hour chart, gold appears to be in the process of consolidating and moving sideways. Because the Bollinger Bands index shows no major changes affecting the current trend, we can expect gold prices to not change much until important news is announced.
Careful observation and attention will be the key to determining the right time to trade. Gold is expected to fluctuate between 2328 - 2305 USD until the end of the day.
