SILVER – Triangle Pattern breakout – 45 – 70% upside potentialSilver has given triangle pattern breakout from 26 resistance levels.
Initial target is coming to 30, then 37.5 and 48 (previous All time high).
SL: Daily close below 26.
Futures market

GOLD – Cup and Handle breakout - 30% upside potential2040 to 2060 has been a resistance zone for Gold which has been broken now.
Very good Cup and Handle pattern breakout also can be seen on weekly timeframe, target is coming to 2500+ and then 3040+.
Any fall towards 2100 zone would be a good buying opportunity.
SL: Daily close below 2100.

Copper MCX Future Weekly Chart Analysis 08-12 April📊 COPPER 28 MAR WEEKLY FUT LEVELS
🎯 Weekly Range: 42.55
📉 Buy at: 788.15
🎯 Buy Target 1: 827.70
🎯 Buy Target 2: 843.95
📉 Average Position: 783.13
🛑 Buyer Stoploss: 773.97
📉 Sell at: 778.10
🎯 Sell Target 1: 775.10
🎯 Sell Target 2: 758.85
🛑 Seller Stoploss: 792.28

crude oil intraday levels for tradingMCX:CRUDEOIL1! watch crude below 7155 for short trade till 7102 zone

GOLD NEXT MOVE(trend continuation with a correction)(03-04-2024)Go through the analysis carefully, and do trade accordingly.
Anup 'BIAS for the day (03-04-2024)
Current price- 2272
"if Price stay above 2252, then next target is 2286 and 2300 and below that 2230.
-POSSIBILITY-1
Wait (as geopolitical situation are worsening )
-POSSIBILITY-2
Wait (as geopolitical situation are worsening)
Best of luck
Never risk 2% of principal to follow any position.
Support us by liking and sharing the post.

GOLD NEXT MOVE (bulls are in upper hand )(02-04-2024) Go through the analysis carefully, and do trade accordingly.
Anup 'BIAS for the day (02-04-2024)
Current price- 2264
"if Price stay above 2248, then next target is 2284 and 2300 and below that 2230.
-POSSIBILITY-1
Wait (as geopolitical situation are worsening )
-POSSIBILITY-2
Wait (as geopolitical situation are worsening)
Best of luck
Never risk 2% of principal to follow any position.
Support us by liking and sharing the post.

GOLD NEXT MOVE (bulls are cheering: watching ATH )(01-04-2024)Go through the analysis carefully, and do trade accordingly.
Anup 'BIAS for the day (01-04-2024))
Current price- 2255
"if Price stay above 2233, then next target is 2280 and 2300 and below that 2204.
-POSSIBILITY-1
Wait (as geopolitical situation are worsening )
-POSSIBILITY-2
Wait (as geopolitical situation are worsening)
Best of luck
Never risk 2% of principal to follow any position.
Support us by liking and sharing the post.

GOLD WEEKLY ANALYSIS (April 01- April-05)Go through the analysis carefully, and do trade accordingly.
Anup 'BIAS for the week (April 01- April-05)
Current price- 2233
"if Price stay above 2195 then next target is 2250 and 2280 and above that 2310.
"if Price stay below 2195 then next target is 2170 and 2152 and below that 2110.
-POSSIBILITY-1
Wait (as geopolitical situation are worsening )
-POSSIBILITY-2
Wait (as geopolitical situation are worsening)
Best of luck
Never risk 2% of principal to follow any position.
Support us by liking and sharing the post.


📊 SILVER 29 APR WEEKLY CHART FUT LEVELS FOR 8-12 APRIL 📊 SILVER 29 APR WEEKLY FUT LEVELS
🎯 Weekly Range: 6020.00
📉 Buy at: 78730.36
🎯 Buy Target 1: 84583.36
🎯 Buy Target 2: 86883.00
📉 Average Position: 78020.00
🛑 Buyer Stoploss: 76723.69
📉 Sell at: 77309.64
🎯 Sell Target 1: 77142.64
🎯 Sell Target 2: 74843.00
🛑 Seller Stoploss: 79316.31

Gold MCX Future Weekly Analysis 08-12 April Also For Options📊 GOLD 05 APR WEEKLY FUT LEVELS
🎯 Weekly Range: 2636.00
📉 Buy at: 69692.05
🎯 Buy Target 1: 72265.05
🎯 Buy Target 2: 73272.00
📉 Average Position: 69381.00
🛑 Buyer Stoploss: 68813.38
📉 Sell at: 69069.95
🎯 Sell Target 1: 69006.95
🎯 Sell Target 2: 68000.00
🛑 Seller Stoploss: 69948.62

NATURAL GAS 26 MAR LEVELS 📊 NATURAL GAS 26 MAR LEVELS
🎯 Weekly Range: 16.30
📉 Buy at: 153.67
🎯 Buy Target 1: 161.57
🎯 Buy Target 2: 167.80
📉 Average Position: 151.75
🛑 Buyer Stoploss: 148.24
📉 Sell at: 149.83
🎯 Sell Target 1: 141.43
🎯 Sell Target 2: 135.20
🛑 Seller Stoploss: 155.26

CRUDE OIL 20 APR WEEKLY MCX FUT/OPTIONS LEVELS 📊 CRUDE OIL 20 APR WEEKLY FUT LEVELS
🎯 Weekly Range: 404.00
📉 Buy at: 7141.67
🎯 Buy Target 1: 7533.67
🎯 Buy Target 2: 7688.00
📉 Average Position: 7094.00
🛑 Buyer Stoploss: 7007.00
📉 Sell at: 7046.33
🎯 Sell Target 1: 7034.33
🎯 Sell Target 2: 6880.00
🛑 Seller Stoploss: 7181.00

Rounded BottomWhat is Rounding Bottom pattern:
The Rounding Bottom pattern, also known as the saucer bottom, is a bullish reversal pattern observed in technical analysis. It typically emerges after a prolonged downtrend and signifies a potential shift in market sentiment from bearish to bullish. Characterized by a gradual decline followed by stabilization and a subsequent gradual ascent, the pattern resembles a rounded bowl or saucer. Confirmation of the pattern occurs when the price breaks above the resistance level, usually accompanied by increased volume, signalling a buying opportunity. Traders often set their price targets by measuring the depth of the pattern and adding it to the breakout point. While the Rounding Bottom pattern provides valuable insights into potential trend reversals, traders should consider other factors such as overall market conditions and fundamental analysis for comprehensive decision-making.
echnical Analysis and Outlook:
Gold price is currently scaling higher, with the potential to surpass the $2,300 mark. The Daily Relative Strength Index (RSI) indicates overbought conditions, warranting caution among investors. Near-term consolidation or a corrective pullback may offer buying opportunities, with support levels identified around $2,265 and $2,250. A break below the weekly low of $2,228 could trigger technical selling, potentially leading to a decline towards the psychological $2,200 mark.
Conclusion:
The surge in gold prices amidst geopolitical uncertainty and Federal Reserve policy ambiguity underscores the metal's role as a safe-haven asset. While bullish momentum persists, investors should exercise caution, considering the potential for technical corrections and market volatility. Monitoring key economic indicators and geopolitical developments will be crucial for navigating the gold market in the coming weeks.

crdue mcx or spot update education purposecrude gap dwn open now looking short covring here yes if gap fill thna mkt abv 7160 looks 7250-7400++++ where support 7111 only break blw thna more other wise if hold abv support mkt up side only buy on dips with supporting sl

#NaturalGas Update | MCX | 5th - 8th AprilTechnical Analysis Report
Timeframe: 1 Hour
Long Entry: Buy Natural Gas between the price range of 105.7 to 105.9.
Target Price: Aim for a target range of 152.4 to 153.
Stop Loss: Set a stop loss at 149.1.
Logic: Anticipating upward movement towards the 100-period Exponential Moving Average (EMA) and resistance at 152.4.

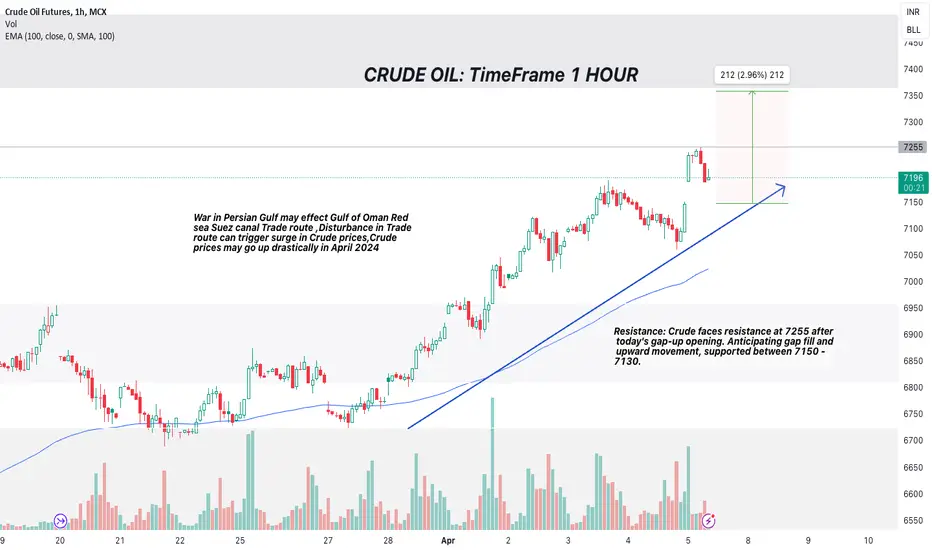
#CrudeOil update | MCX | 5- 7th April Timeframe: 1 Hour
Crude oil opened with a gap-up today, indicating bullish momentum.
The price faces resistance at the 7255 level, a significant barrier observed in historical price action.
Anticipation of a gap fill suggests a potential retracement to fill the void created by the gap-up opening.
Support is identified between the 7150-7130 zone, where buying interest is expected to emerge.
Trend Analysis:
In the short term, crude oil is exhibiting bullish momentum, supported by the gap-up opening.
However, the resistance at 7255 suggests a potential reversal or consolidation.
Technical Indicators:
Moving Averages: The 50-day and 200-day moving averages may act as dynamic support levels, reinforcing the overall bullish bias if the price remains above them.
Relative Strength Index (RSI): Currently, the RSI indicates overbought conditions, suggesting a potential pullback or consolidation in the near term.
Trading Strategy:
Long Opportunity: Traders may consider entering long positions if the price successfully breaks above the 7255 resistance level, targeting higher price levels.
Short Opportunity: Alternatively, a short position could be initiated if the price fails to sustain above the resistance level and breaks below the support zone of 7100.

Natural Gas - How to trade tomorrow
Please read the notes as mentioned on the chart. Time candles for tomorrow are 4-8-24 9:10 AM (Pivotal)
4-8-24 1:36 PM
4-8-24 6:03 PM
4-8-24 10:29 PM
4-9-24 2:55 AM
Top most candle is pivotal and will decide the future trend in the evening session.
10:29 p.m. candle is pivotal for evening session.
Disclaimer: I am not a SEBI Registered Analyst. It is only for educational purposes. I will not be responsible for any of your profits or losses.
Thank you

XAUUSD BUY PROJECTION 07.04.24Reason Behind Buy
1. Breaked Resistance @ 2310
2. Will Retest Trendline + Support @ 2310
3. Next XAUUSD/GOLD Move towards last week High 2331
4. Jio Politic War - Reason 1
5. US intrest Rate - Reason 2
Overall Possible outcomes
XAUUSD BUY @ 2295-2310
SL 2267
TP 2330
TP 2 2400

Brent Crude BullishW pattern in making
already reversed from Double bottom.
rest all levels are marked on the chart.
Breakout Based:
Buy above 95
SL 91.5
Tgt 114 - 120 - 131
Support Based:-
Buy near 87
SL 82.5
Tgt 95 - 114 - 120 - 131
This is for educational purpose and papertrading only. Please consult your financial Advisor before investing. We are not SEBI registered.
Happy Trading.

WTI Crude BullishW pattern in making
already reversed from Double bottom.
rest all levels are marked on the chart.
Breakout Based:-
Buy above 92.5
SL 87.5
Tgt 108 - 118
Support Based:-
Buy near 82.8
SL 79.5
Tgt 92.5 - 108 - 118
This is for educational purpose and papertrading only. Please consult your financial Advisor before investing. We are not SEBI registered.
Happy Trading.

Crude Oil (MCX) BullishW pattern in making
already reversed from Double bottom.
rest all levels are marked on the chart.
Breakout Based:-
Buy above 7702
SL 7418
Tgt 8789 - 9560 - 9997
Support Based:-
Buy near 7060
SL 6787
Tgt 7702 - 8789 - 9560 - 9997
This is for educational purpose and papertrading only. Please consult your financial Advisor before investing. We are not SEBI registered.
Happy Trading.
