gold mcx update blw after payrol data-edu. purgold mcx stay blw 69650 or 2290 spot looks dwnn 69380--220++ in spot looks dwn 2274+++ or more where hurdel 2297 or in mcx 69888 only stya abv or close thna nxt rally possible
Futures market

silver blw 79100 update edu pur.silver stya blw 79100 looks breakdown tgt 78100--77600 sell on rise with tight sl 79422 spot blw 26.50 dwn only looks 261.0

XAUUSD - SMALL RISK FOR HUGE REWARD ?XAUUSD currently trading at 2292
Shorting XAUUSD at CMP with 2320 SL.
Target would be 2230 - 2200 - 2180
Expecting a fall soon!
Disclaimer - Do not consider this as a buy/sell recommendation. I'm sharing my analysis & my trading position. You can track it for educational purposes. Thanks!

MCX GOLD - ONE MORE SHORT ATTEMPT ?MCX GOLD is currently trading at 68900.
I shorted GOLD twice in last three weeks. One position was closed in 700 points profit and other went 1000 points in profit and then closed CTC.
I'm shorting MCX Gold Futures once again at CMP 68900. I will add more short position if 69600 comes & will hold with SL above 70100.
I think rally in gold is about to end and I'm expecting Gold to fall soon & change its trend from bullish to sideways - negative. M pattern is in making in 4 HTF.
Disclaimer - Do not consider this as a buy/sell recommendation. I'm sharing my analysis & my trading position. You can track it for educational purposes. Thanks!

USOIL is ready to rockUS Oil is at important zone formation of pole and flag pattern.If this sustain then we can see a good move. what is your view please comment it down. We are Certified. All views shared on this channel are my personal opinion and is shared for educational purpose and should not be considered advise of any nature

US Oil , Peak Formation high has been locked TDI Sell Hook: TDI stands for "Traders Dynamic Index," which is a technical indicator used to identify trends. A "sell hook" would suggest a potential reversal from an uptrend to a downtrend. This could indicate that the market sentiment is shifting towards selling pressure.
Level 3 on H4: This likely refers to a specific level or zone identified on the H4 timeframe, which typically means the 4-hour chart. Level 3 could represent a significant level of resistance or a point where sellers are likely to step in strongly.
Market Maker Strategy: Market makers are entities that provide liquidity to the market by buying and selling assets. The market maker strategy could refer to trading strategies or techniques employed by market makers to profit from price movements.
In essence, it seems like you're observing technical signals suggesting a potential sell-off in the US Oil market. It's important to note that while technical analysis can provide valuable insights, trading decisions should consider other factors such as fundamental analysis, market sentiment, and risk management. Additionally, no strategy can guarantee profits, and traders should always be cautious and informed when making trading decisions.

XAUUSDThe departure from the upward trend channel has led this product into a significant price decline. It is currently trading below the resistance levels of 2285 and 2290. A strong downward trend was established after taking profits at the $2305 mark, with stable trading activity observed on the 1-hour chart.
Given these observations, it wouldn't be surprising to anticipate further price drops after testing the aforementioned resistance levels (as illustrated on the 2-hour chart), with an expected decrease to $2.248.
If you find this post insightful and valuable, don't forget to leave a like and share your thoughts. It would make me extremely happy.

Copper Weekly Break Out Underway. Buy on Dips For Bigger TargetsBullish View: Copper's weekly breakout move in underway currently. With the first target being achieved this week.
The chart pattern suggests its a 'Buy on Dip' opportunity and we could look to enter in the Buying Zone as shown in the chart for higher targets. Of course this view is negated at the breach of 680 levels on weekly closing basis.
We could play the rising copper trade as a Pair trade set up by going long those companies which stand to benefit from rising copper and shorting those companies (or at-least avoiding going long) which can face problems on account of rising copper prices.
Examples of companies that can benefit are: Hindustan Copper, Hindalco, Sterlite Copper.
Examples of companies that can face pressure are: Havells, PolyCab, KEI Industries, Finolex, etc.

"In a world of uncertainties, gold remains a timeless anchor"After facing rejection four times at the @2080 price level over a span of 1302 days, there's a compelling possibility of a breakout. Each rejection indicates a significant resistance point, but the frequency of attempts suggests growing pressure for a potential breakout.

XAUUSD: Setting new highs!Today's gold price gently adjusted, from $2,300 to $2,272, reflecting volatility but not eclipsing the long-term growth trend. In the face of inflationary pressure and positive economic data, the Fed may continue its strict monetary policy. However, policy flexibility is still the driving force behind gold prices, along with pressure from the national debt, creating a solid foundation for price increases. Gold, therefore, is still an attractive investment channel, resistant to inflation and instability.
From a technical perspective: price is still well supported by EMA 34.89. It is expected that the price will recover after the correction and retest the EMA 34.89.

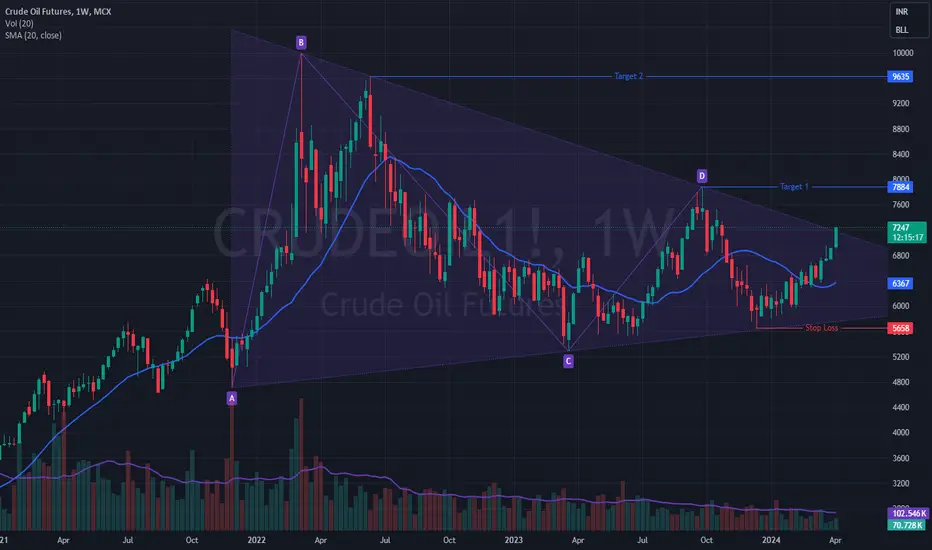
Weekly Triangle Pattern Breakout in CrudeWeekly triangle pattern break out in Crude.
Entry: CMP
Stop Loss: 5658
Target 1: 7884
Target 2: 9635
Positive for: Companies with crude as an output. Examples are ONGC, IOC, RIL, OIL INDIA, BPCL, HPCL, ETC.
Negative for: Companies with crude as an input. Examples are ASIANPAINT, BERGER PAINTS, MRF, APOLLOTYRE, GSFC, TATACHEM, ETC.
More importantly rising crude prices is bad news for economy as inflation is likely to continue to remain elevated. With higher than normal predicted summer temperatures, electricity bill for end users is likely to remain elevated.
XAUUSD 1H SELL PROJECTION 05.04.24Reason Behind SELL
1.Breaked Support @ashoksharma_2285
2.Immediate Support @ 2280 Which Entry Point
3. Formed Three white soldiers
4. Retesing Yesterday Low
Overll Possible Outcomes
GOLD SELL 2279.20
SL 2290.15
TP 2252.00

XAUSUD is ready🚀XAUUSD Which is showing a great opportunity XAUUSD is ready to breakout. what is your view please comment it down. We are Certified. All views shared on this channel are my personal opinion and is shared for educational purpose and should not be considered advise of any nature.

Gold price extends pullback from record high ahead of US NFPAfter rising for seven consecutive days, the spot Gold price (XAUUSD) witnessed a pullback from an all-time high and closed in the red. That said, the precious metal’s retreat remains intact early Friday as the US Dollar pares weekly losses ahead of the key US employment data, mainly the Nonfarm Payrolls (NFP). Technically, the XAUUSD justified overbought RSI conditions and sluggish MACD signals to ease from the record high. This suggests brighter chances of the bullion’s further pullback toward a one-month-old previous resistance line, close to $2,258 by the press time. However, the quote’s downside past $2,258 appears difficult as an ascending trend line from late February challenges the bears around $2,220. Even if the commodity price manages to break the $2,220 support line, the $2,200 threshold and a four-month-old horizontal region surrounding $2,141-50 will be tough nuts to crack for the bears before taking control.
On the flip side, the Gold price rebound needs validation from the $2,300 threshold and downbeat prints from the US employment data. Following that, an upward-sloping resistance line from March 21, close to $2,313, will restrict further advances of the XAUUSD. It should be noted that the quote’s sustained run-up beyond $2,313 enables it to aim for the 78.6% and the 100% Fibonacci Extension (FE) levels of its February-March moves, near $2,345 and $2,398 respectively. Following that, the $2,400 will act as the final defense of the sellers.
Overall, the Gold price remains bullish beyond $2,141 but a short-term pullback can’t be ruled out unless today’s US jobs report disappoints the US Dollar bulls.

GOLD - ready NEW MAXIMUM?!We had a volatile day yesterday, with gold prices skyrocketing from 2275 to a new peak of 2305. Today continues to be an important day with news that could trigger a price correction. While gold is not typically a top choice for technical analysis, it is currently approaching the top of the price channel. However, we also know that gold is always a sought-after asset for investment and storage, continuing to drive prices up.
So I set my next target for gold at the new price level - 2320.
Please share your thoughts or opinions, I always look forward to hearing from you.

Technically, gold will continue to riseOn April 4, gold was correcting its recent extreme overbought conditions. The 4-hour chart showed that technical indicators fell sharply, almost vertically downward, but still well above the midline. The highs and retracements have not changed gold's original bullish technical barriers. The large structure does not require too much analysis at present, and it is a relatively obvious bullish trend. Not to mention the previous increase in the monthly K line, the physical Dayang K in March is enough to support gold's certain increase in April. Week K also rose by 100+ US dollars starting from 2146 after the weekly red three soldiers, and there is currently no sign of retreat. At this stage, the small cycle operation of hourly and four-hour lines cannot judge the effective resistance above. Without significant bad news or a rapid decline caused by a large number of selling, gold will still be mainly long.
Looking at the 60-minute chart, the 20-day moving average and the 50-day moving average extend upward in parallel, and the MACD indicator is also well above the 0 axis, indicating that it is still in a strong upward stage. Unless there is major news that is not conducive to the rise, the rise will continue.
The first support level is seen near $2,288. If the price falls back to $2,285-2,288, you can go short and long. Highs above are expected to be around $2,315.
If the price falls below $2,280, the price may then fluctuate in the range of $2,265-2,288. But as long as the price touches around $2,165, you can still go long.

xauusd looking for sellas per price action price has been taken yesterday high liquidity . now going to test low level 2266 is our ideal target. price action also our favour and As per smc fvg and orderblock also filled......

MCX ALUMINIUM - LOOKING GOOD FOR A SHORT TRADE ?MCX ALUMINIUM is currently trading at 212.
210-215 is a good resistance zone for Aluminium as per price action and longterm charts.
Hence I'm opening short positions in MCX Aluminium Futures at CMP 212.
I will be adding more position if 215 comes & will hold with SL 218.
Targets I'm expecting are 205-202 & beyond.
Disclaimer - Do not consider this as a buy/sell recommendation. I'm sharing my analysis & my trading position. You can track it for educational purposes. Thanks!

gold mcx stya abv 69700 update edu pur.gold mcx stya abv 69700 looks up 69900--70000++++++ buy on dips sl 69555

BECAREFULL WITH GOLDMarket still round 2193 to 2203
Wait today...today Unemployment and Final GDP NEWS
If market cross & CLOSE ABOVE 2222 next zone will me 2238-2300
If market cross & CLOSE BELOW 2145 it will be RED ROSE...
then NEXT buy zones will be
2038-2025
1995-1973
1948-1931
1829-1811
Checking in day candle body doesn't close above DAY BOS in line chart seems M PATTERN ...
SO 60%SELL AND 40% BUYING
Sell Flip Zone 2203-2209
EURUSD,GBPUSD,NZDUSD,AUDUSD starts falls
so GOLD also will FALL soon...
Low equity members avoid trade today...
Use small lot max 0.01- 0.03 and 6-7 orders
SELL @
1st sell zone
2198-2200
2nd sell zone
2203-2207
Sl 2213
Tp 2193
Tp 2186
Tp 2176
Tp 2160
Tp 2148
Tp 2038
Tp 1950
Tp 1840
Buy stop @2212.8
x2lot size of sell total order
Tp 2221
Tp 2238
Tp 2270
Tp 2300
or avoid trade today
NOTES: EDUCATIONAL PURPOSE

Silver triangle breakout Good triangle seen in silver.
Breakout target is close to earlier resistance.
Good 30% upside expected.

Silver Update || Apr 5 || MCX
TimeFrame: 1 Day
Price Levels: Silver is currently trading above the crucial psychological level of 79000, indicating strong investor interest and bullish sentiment in the market.
Current Price: 79650
Target: 80300- 80400
All-Time Highs: The ongoing price action has resulted in the establishment of consecutive all-time highs, suggesting an uptrend with considerable momentum.
Trend Line Analysis: Within the 1-day timeframe, a discernible trend line can be observed, consistently connecting the successive highs. This trend line serves as a visual representation of the prevailing bullish momentum in the market.
Bullish Momentum: The consistent upward movement in silver prices, coupled with the formation of all-time highs and the supportive trend line, underscores the prevailing bullish sentiment and momentum in the market.

Gold continues to increase strongly!Hello, my notable friends!
Today, the price of gold has seen an impressive increase, with spot gold rising by $29.9 to $2,281 per ounce.
This significant surge on April 2nd, according to US time, has been driven by the relentless demand for a safe haven amidst escalating tensions in the Middle East. The gold market continues to defy the strength of the US dollar and predictions of interest rate cuts in the US, consistently setting new records.
Furthermore, strong demand from retail investors and global central banks also play a crucial role in extending the upward momentum of this precious metal.
Considering these factors, a target of $2,300 for gold seems not only feasible but highly likely!
