Mastering the TradingView watchlists
Watchlists allow you to track the assets you are most interested in — all in one place. On TradingView, you can create lists based on various criteria, customize their view, explore asset fundamentals, track the latest news, and much more. This feature is readily available from any page and product on the platform.
CONTENTS:
Setting up your watchlist
The first step is to add symbols for your analysis. Click the Watchlist icon on the right-hand toolbar to open the panel.
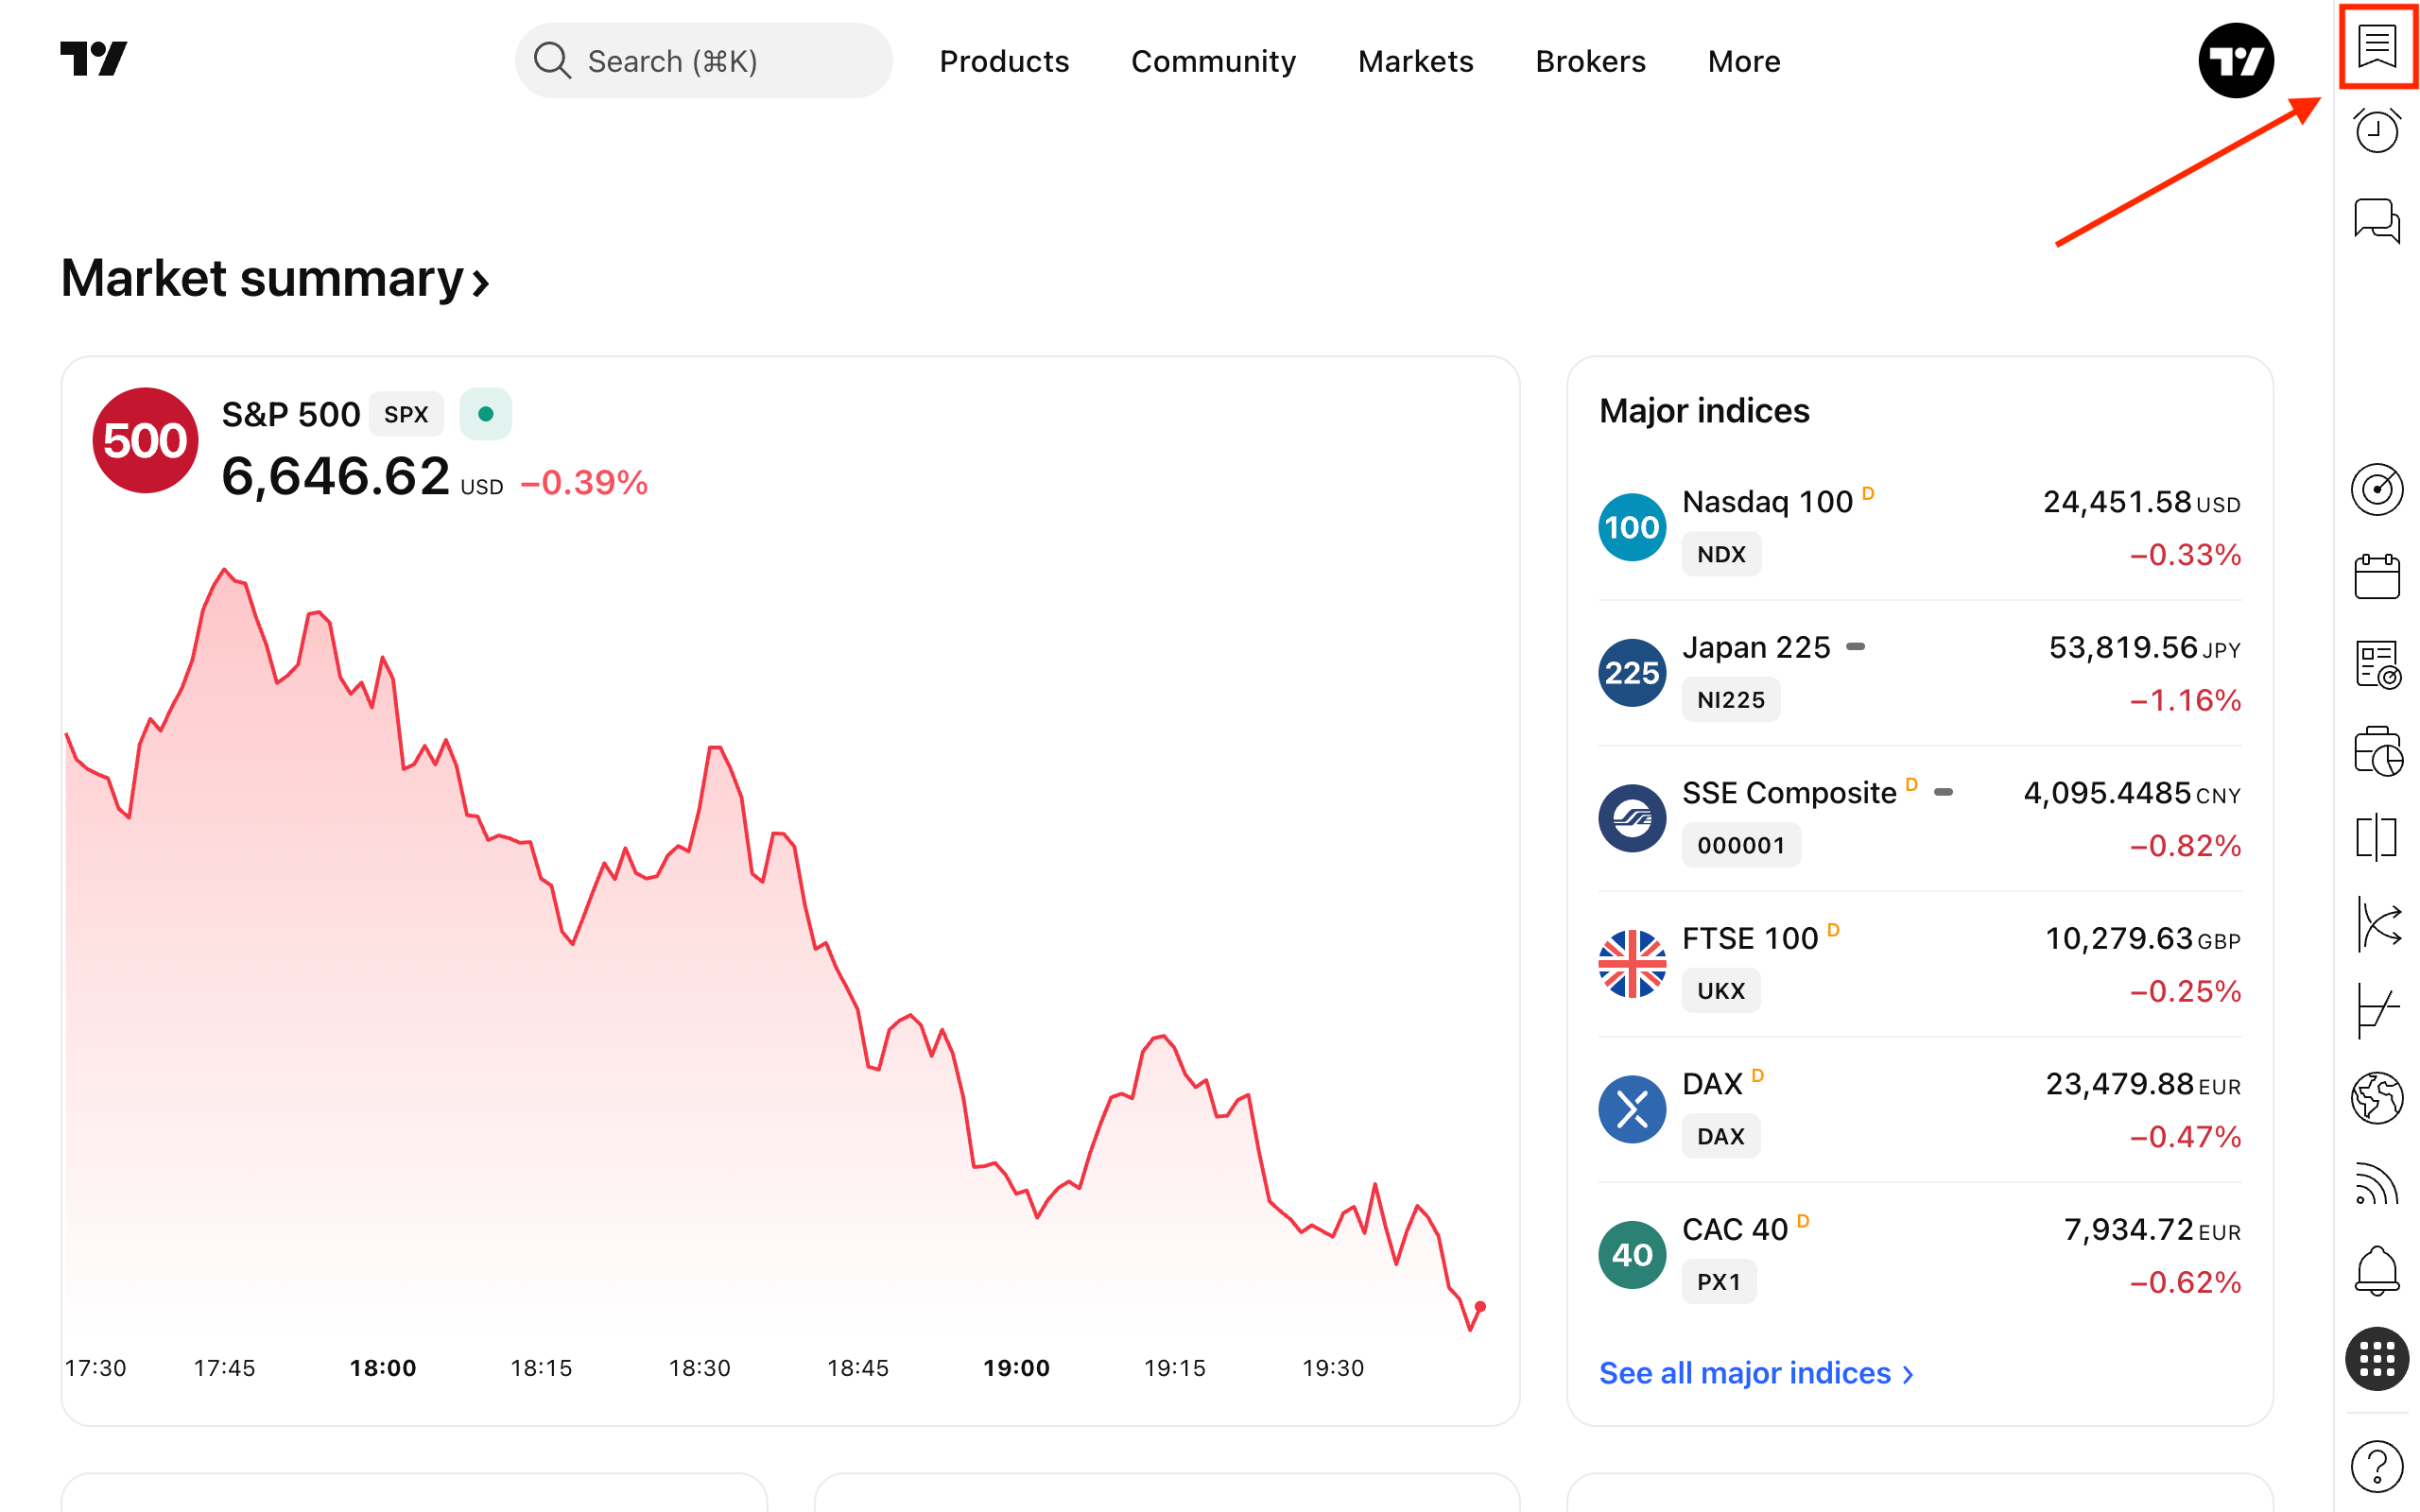
From there, you can add and remove symbols, creating custom lists based on asset type, market, sector, or even your trading mood. These lists allow you to easily track:
- Related news.
- Fundamental data.
- Technical summaries.
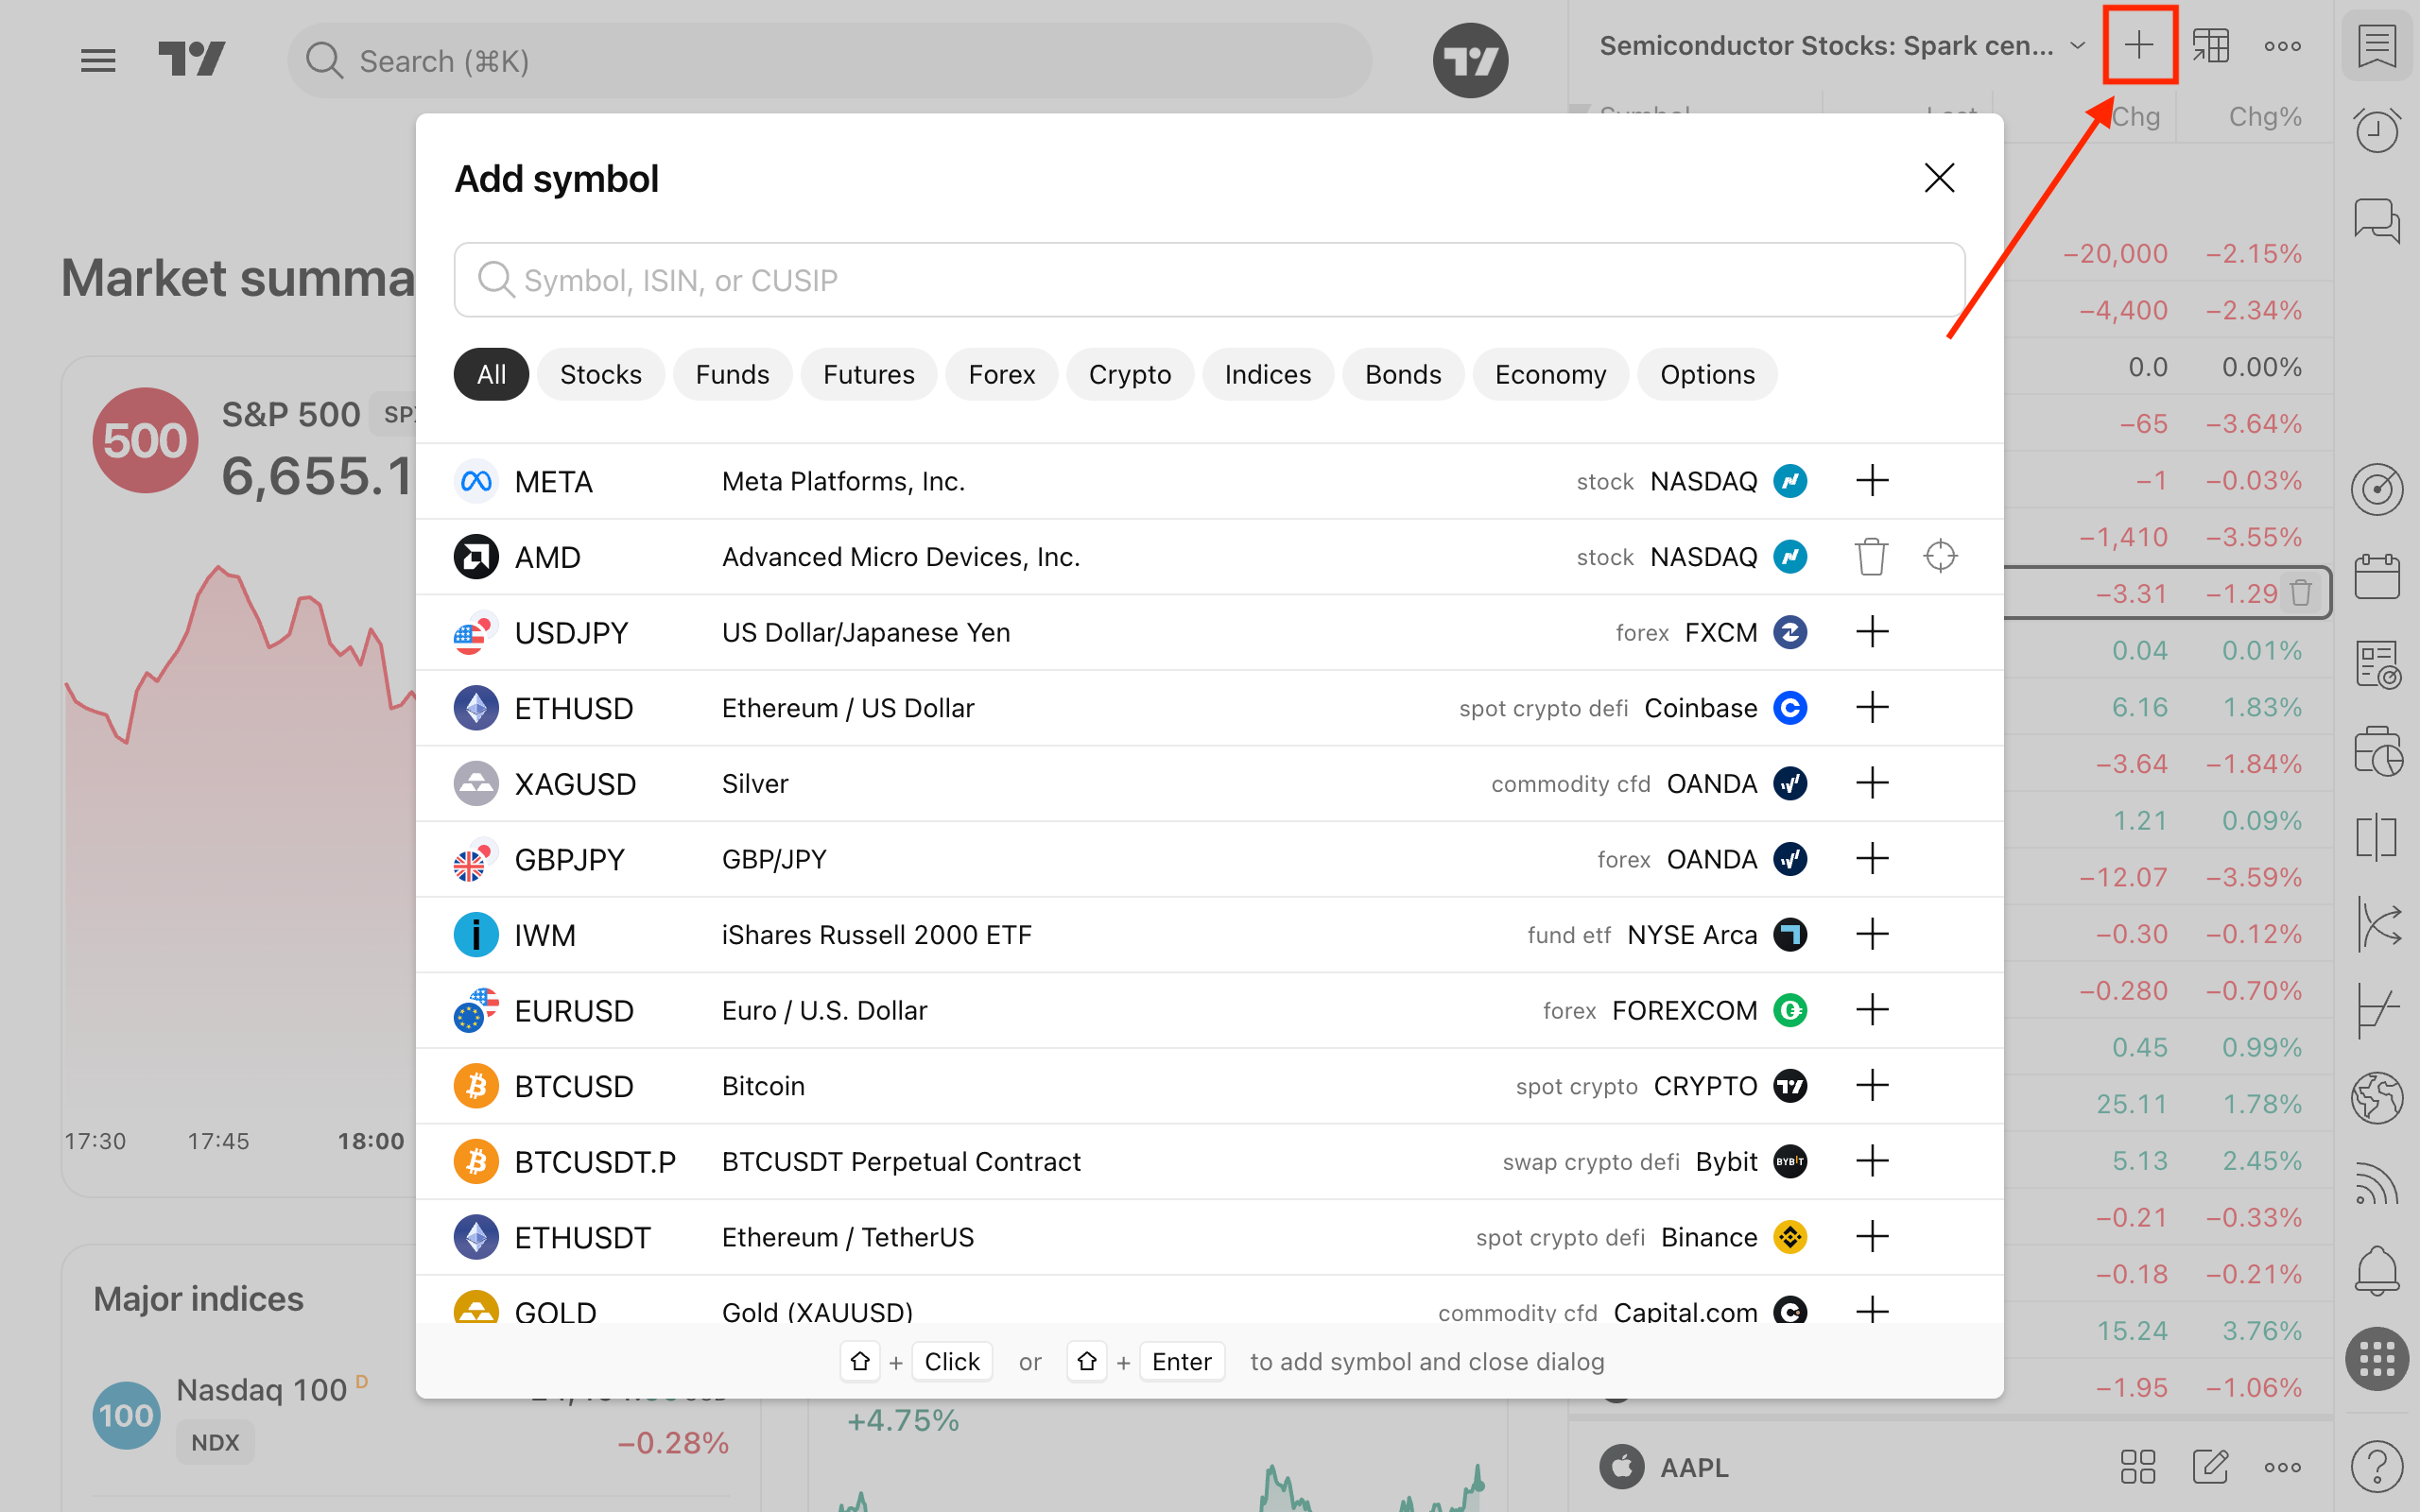
Choose the asset type, search for the symbol you want to track, and click the plus icon next to it.
The new symbols will appear at the bottom of your watchlist. You can drag and drop them into any section to sort them exactly how you like.
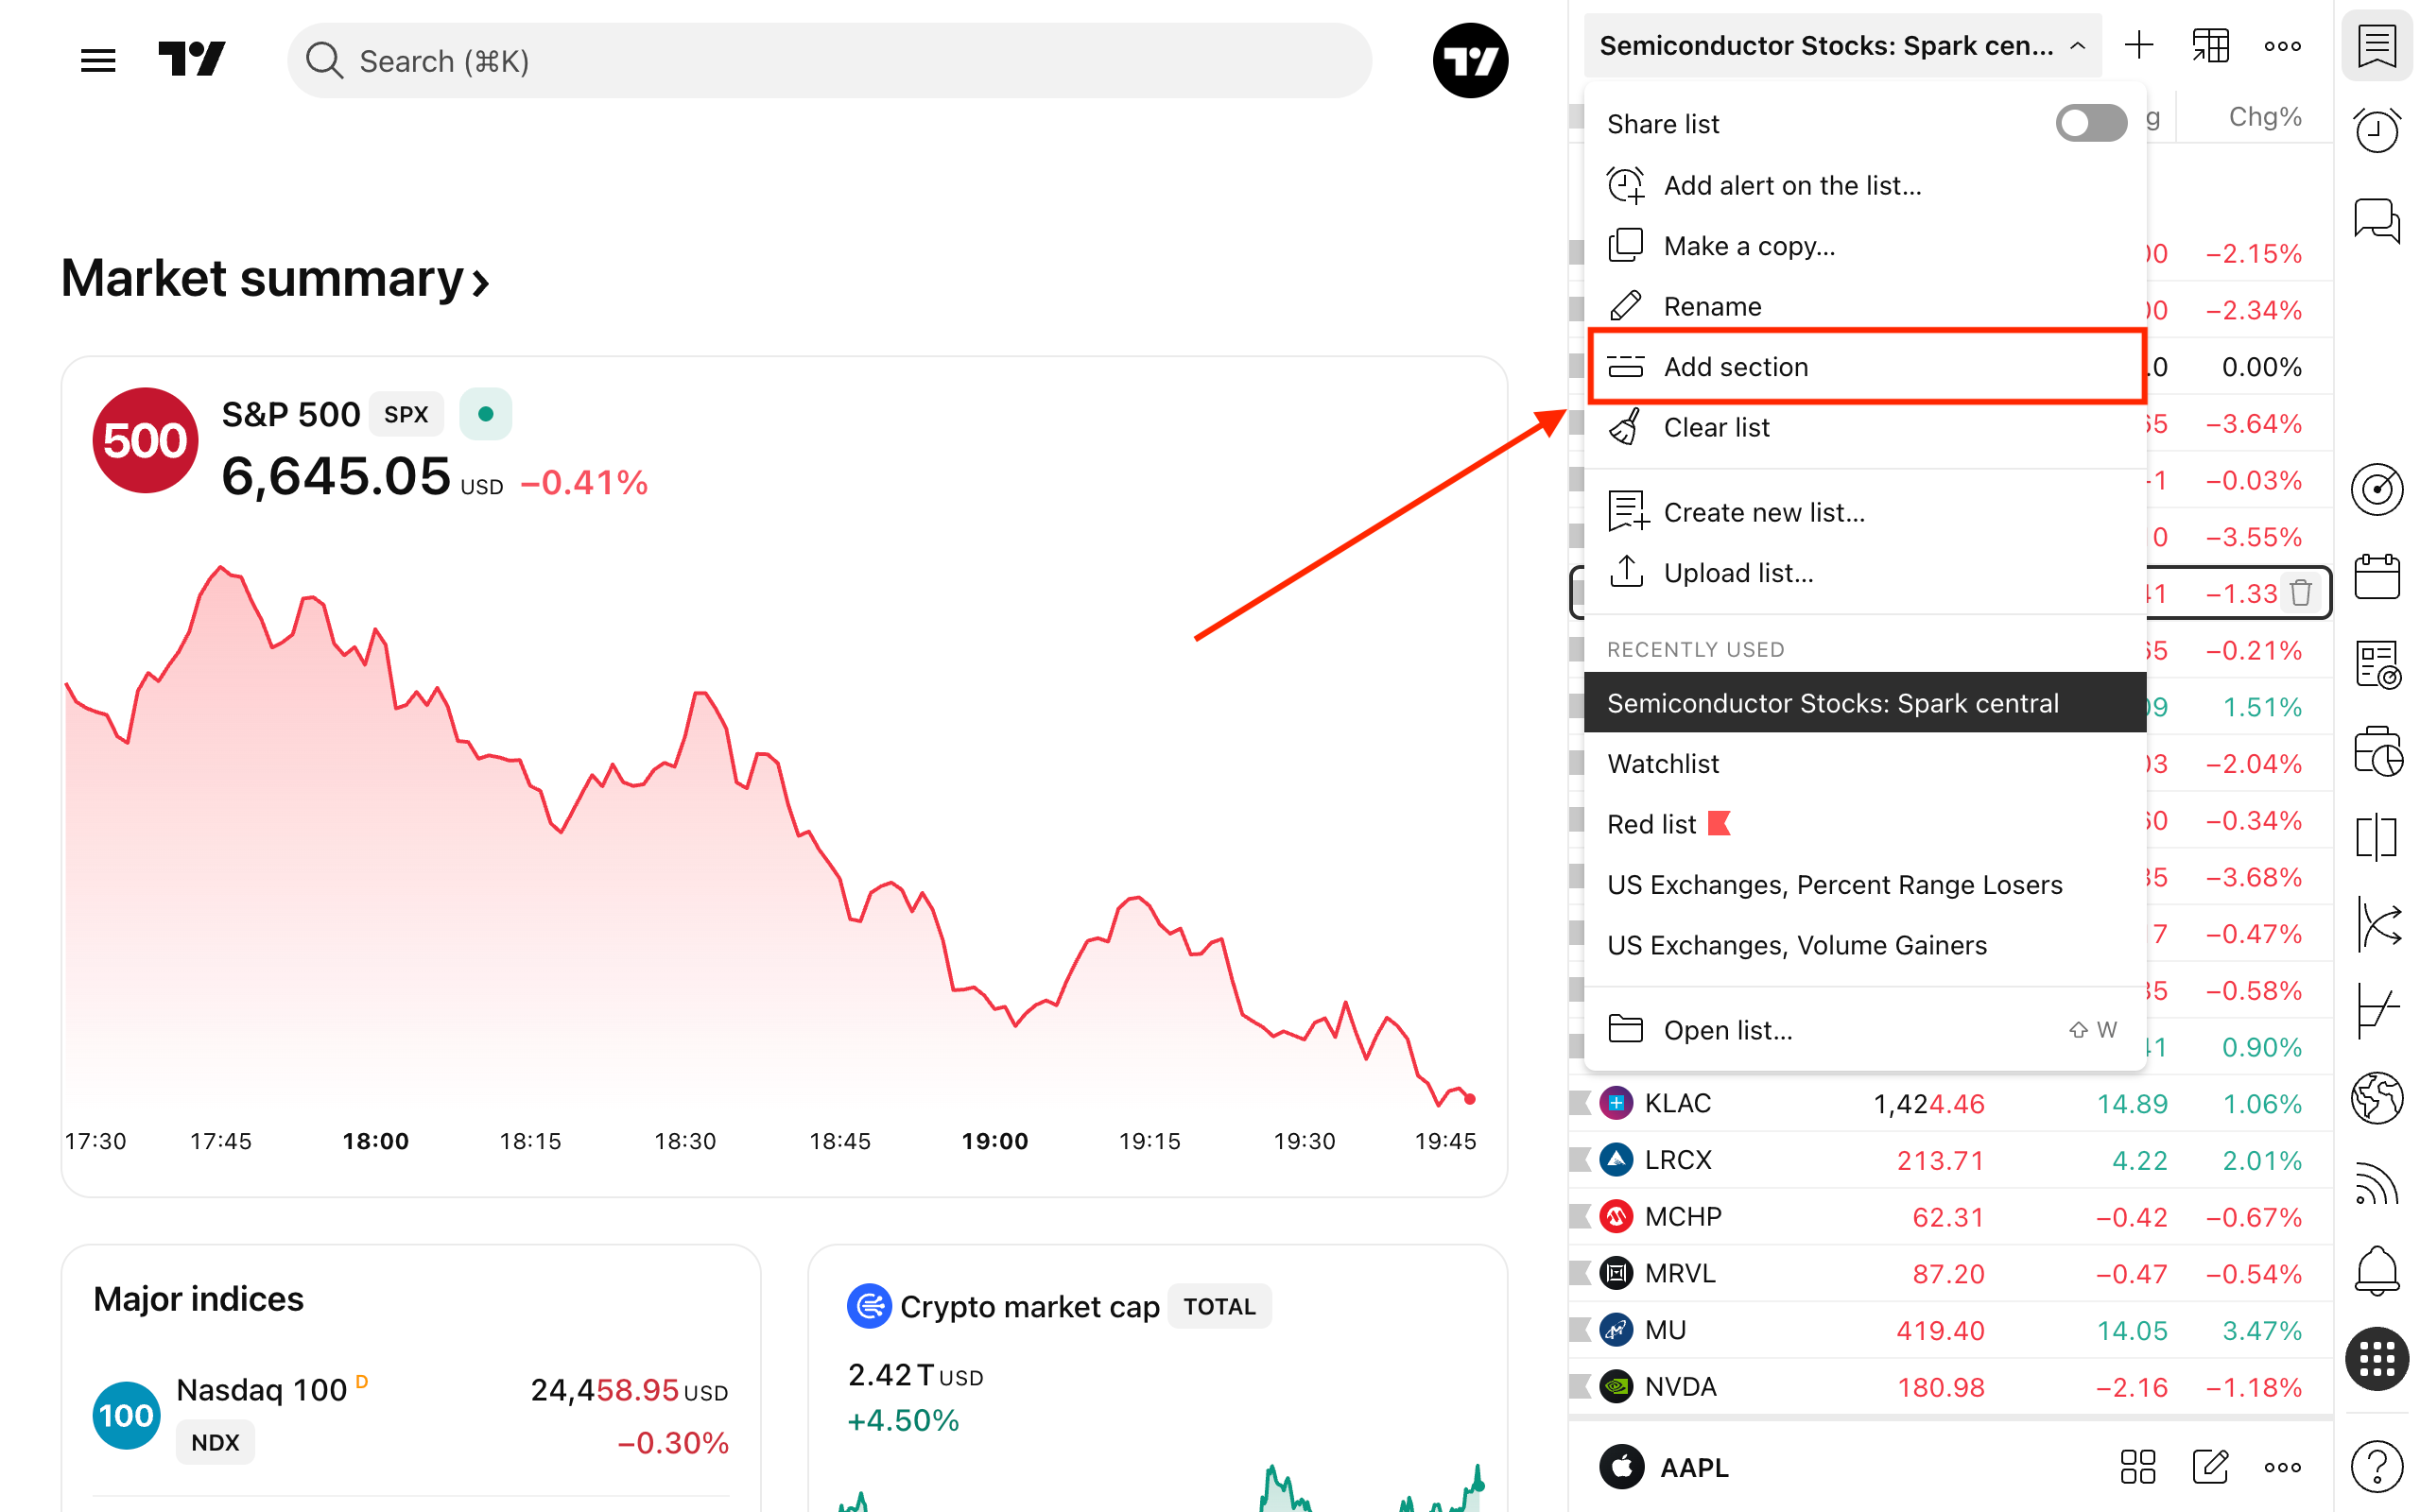
If you need better organization with sublists, click on the name of your watchlist and select Add section. You can rename, move, or remove these dividers at any time.
Watchlist metrics
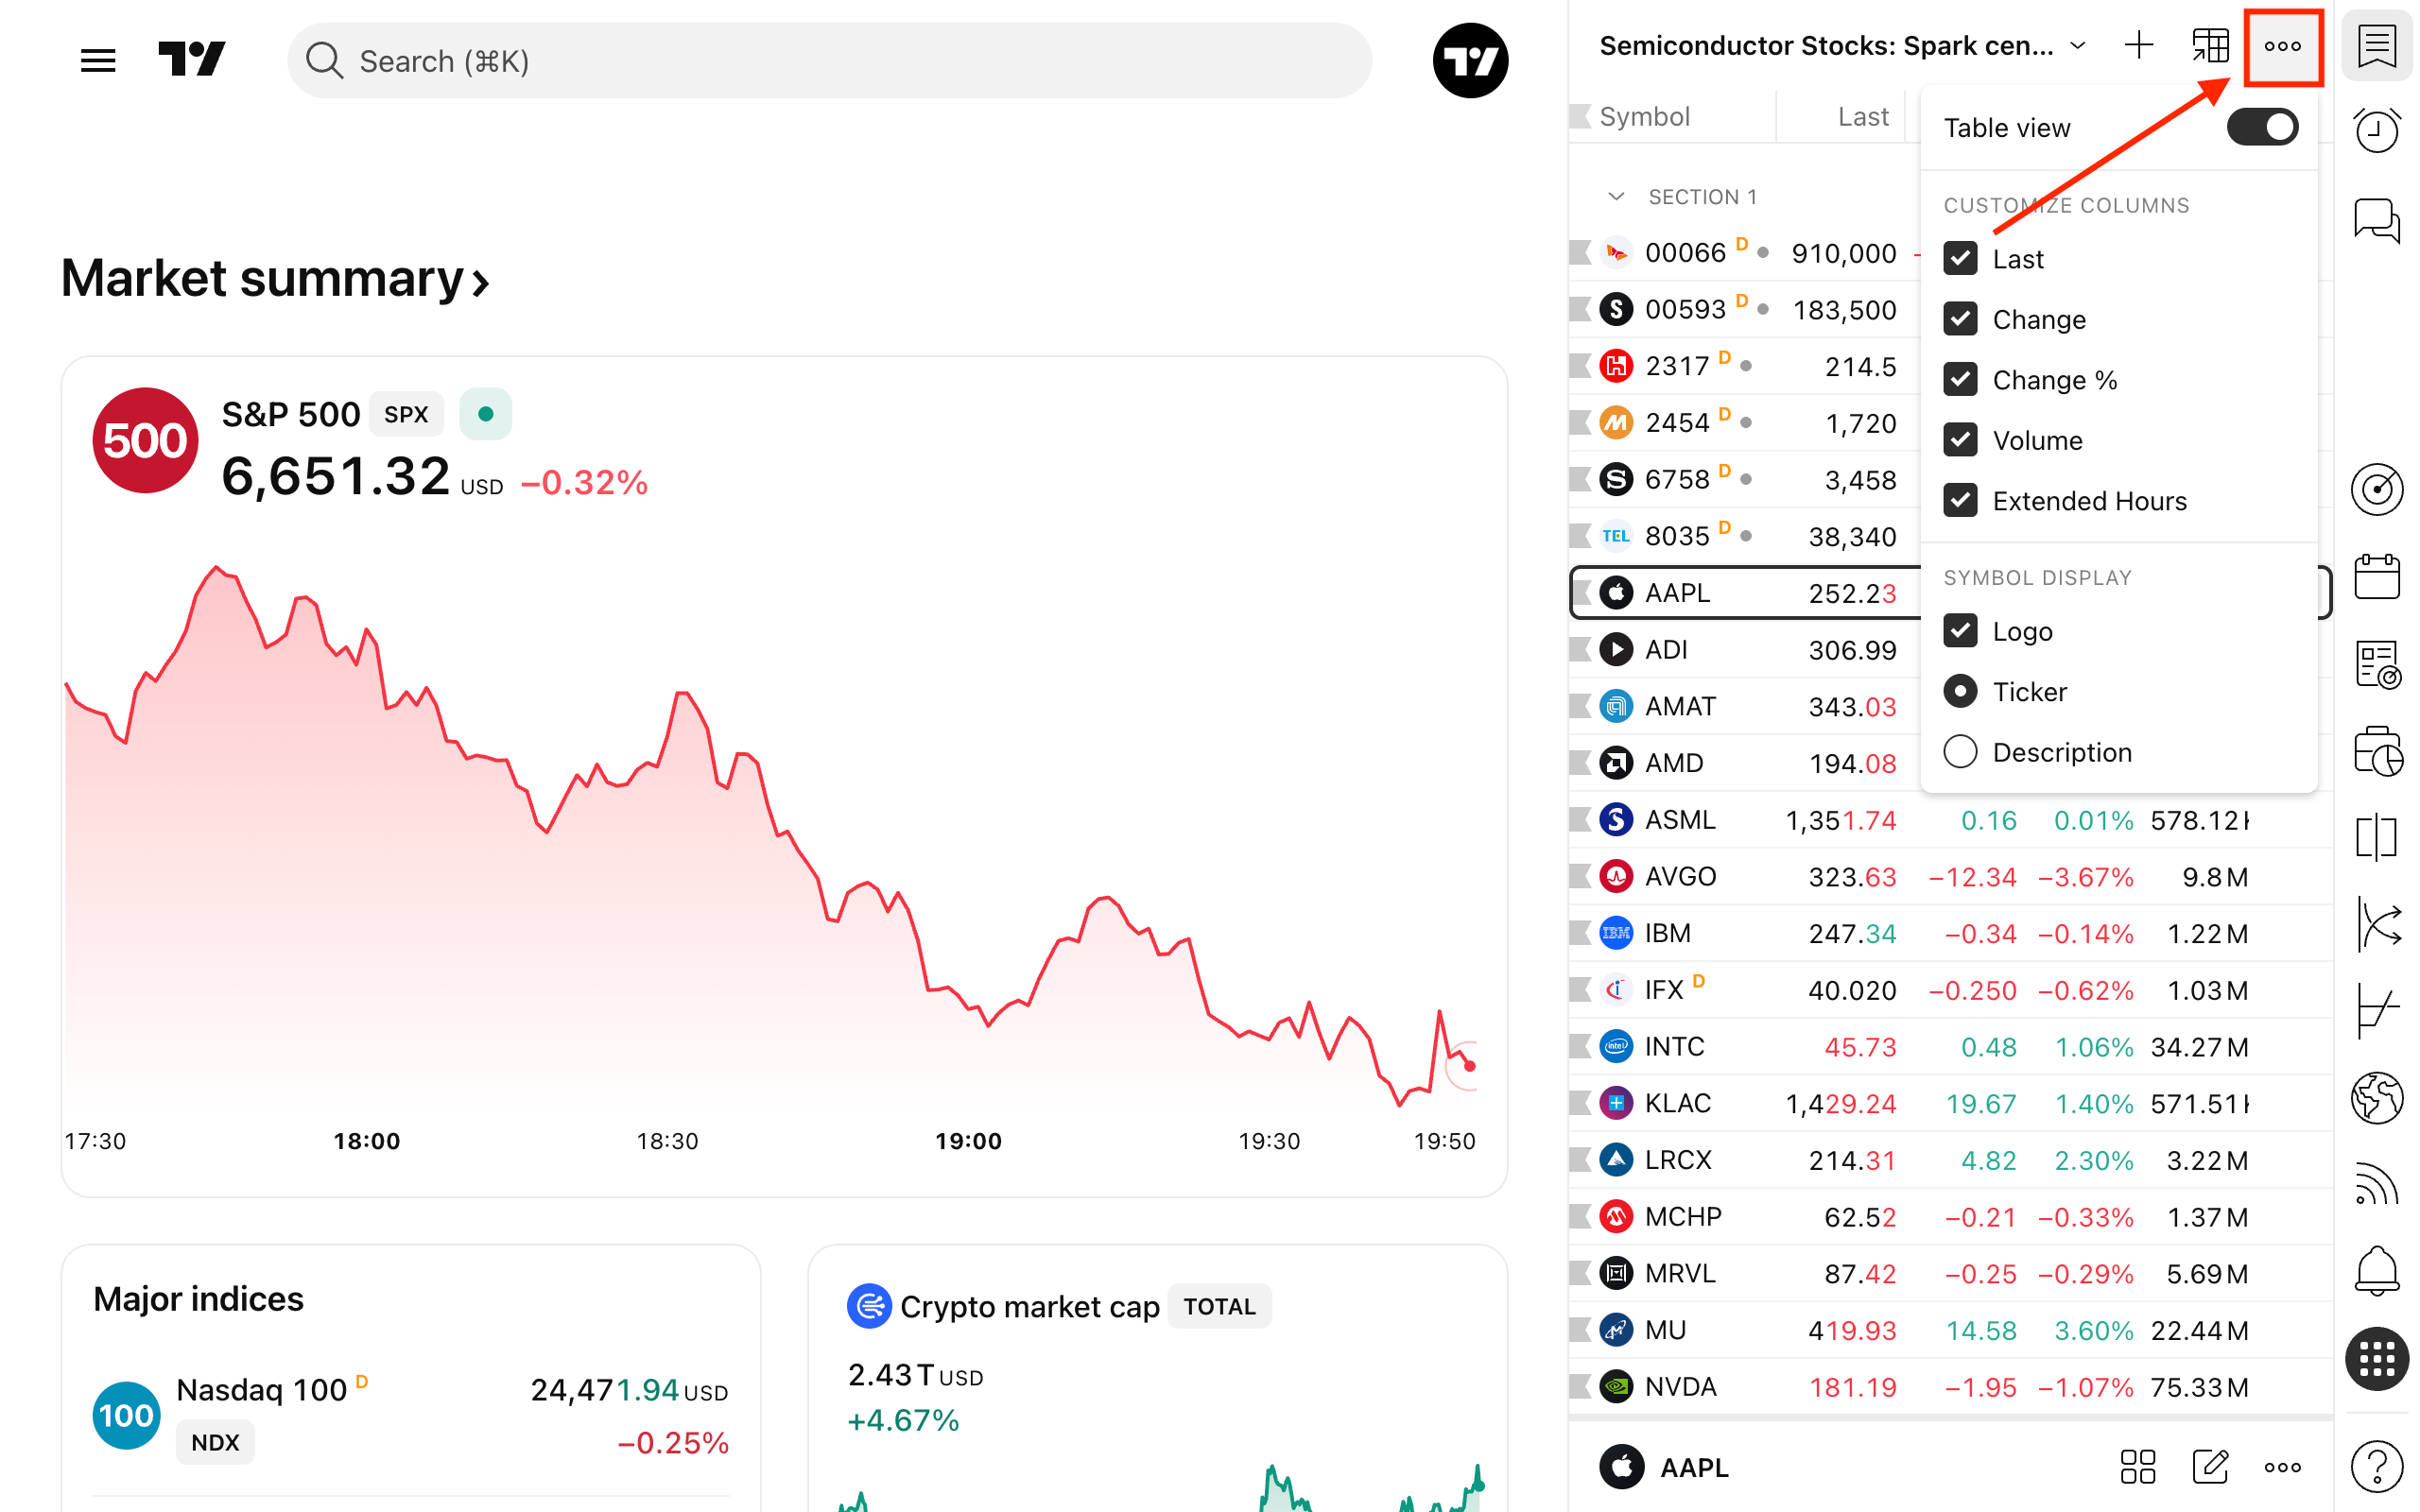
Watchlists display key market metrics at a glance:
- Last price.
- Price change.
- Percent price change.
- Volume.
- Price change during extended hours.
To sort your symbols by any of these data points, simply click the metric's name at the top of the column.
To add or remove a metric, click the three-dot menu in the upper-right corner. In this same menu, you can also manage symbol elements (toggling the logo, ticker, and description) and choose whether to display the list as a data table or standard rows.
Watchlist settings
Clicking the watchlist's name opens a dropdown menu with several customization options:
- Add a watchlist alert: Set up condition-based notifications for the whole list.
- Make a copy: Duplicate your current watchlist.
- Rename: Change the watchlist's name.
- Add a section: Create dividers to group symbols.
- Clear the list: Remove all current symbols.
- Create a new one: Start a fresh watchlist from scratch.
- Import: Upload a watchlist via a
.txtfile (using the exchange prefix and comma-separated values). - Favorites and hotlists: Access your starred watchlists or open a dialog to explore predefined market hotlists.
Symbol details
Clicking any symbol in your watchlist opens the Symbol details section right below the list. The contents of this section dynamically change depending on the instrument type.
For example, for stocks, you will see:
- A quick market summary
- Flash news
- Key fundamental and technical stats
- Information on related bonds
- ETFs holding the stock
- Options data
- Seasonals
- Company profile
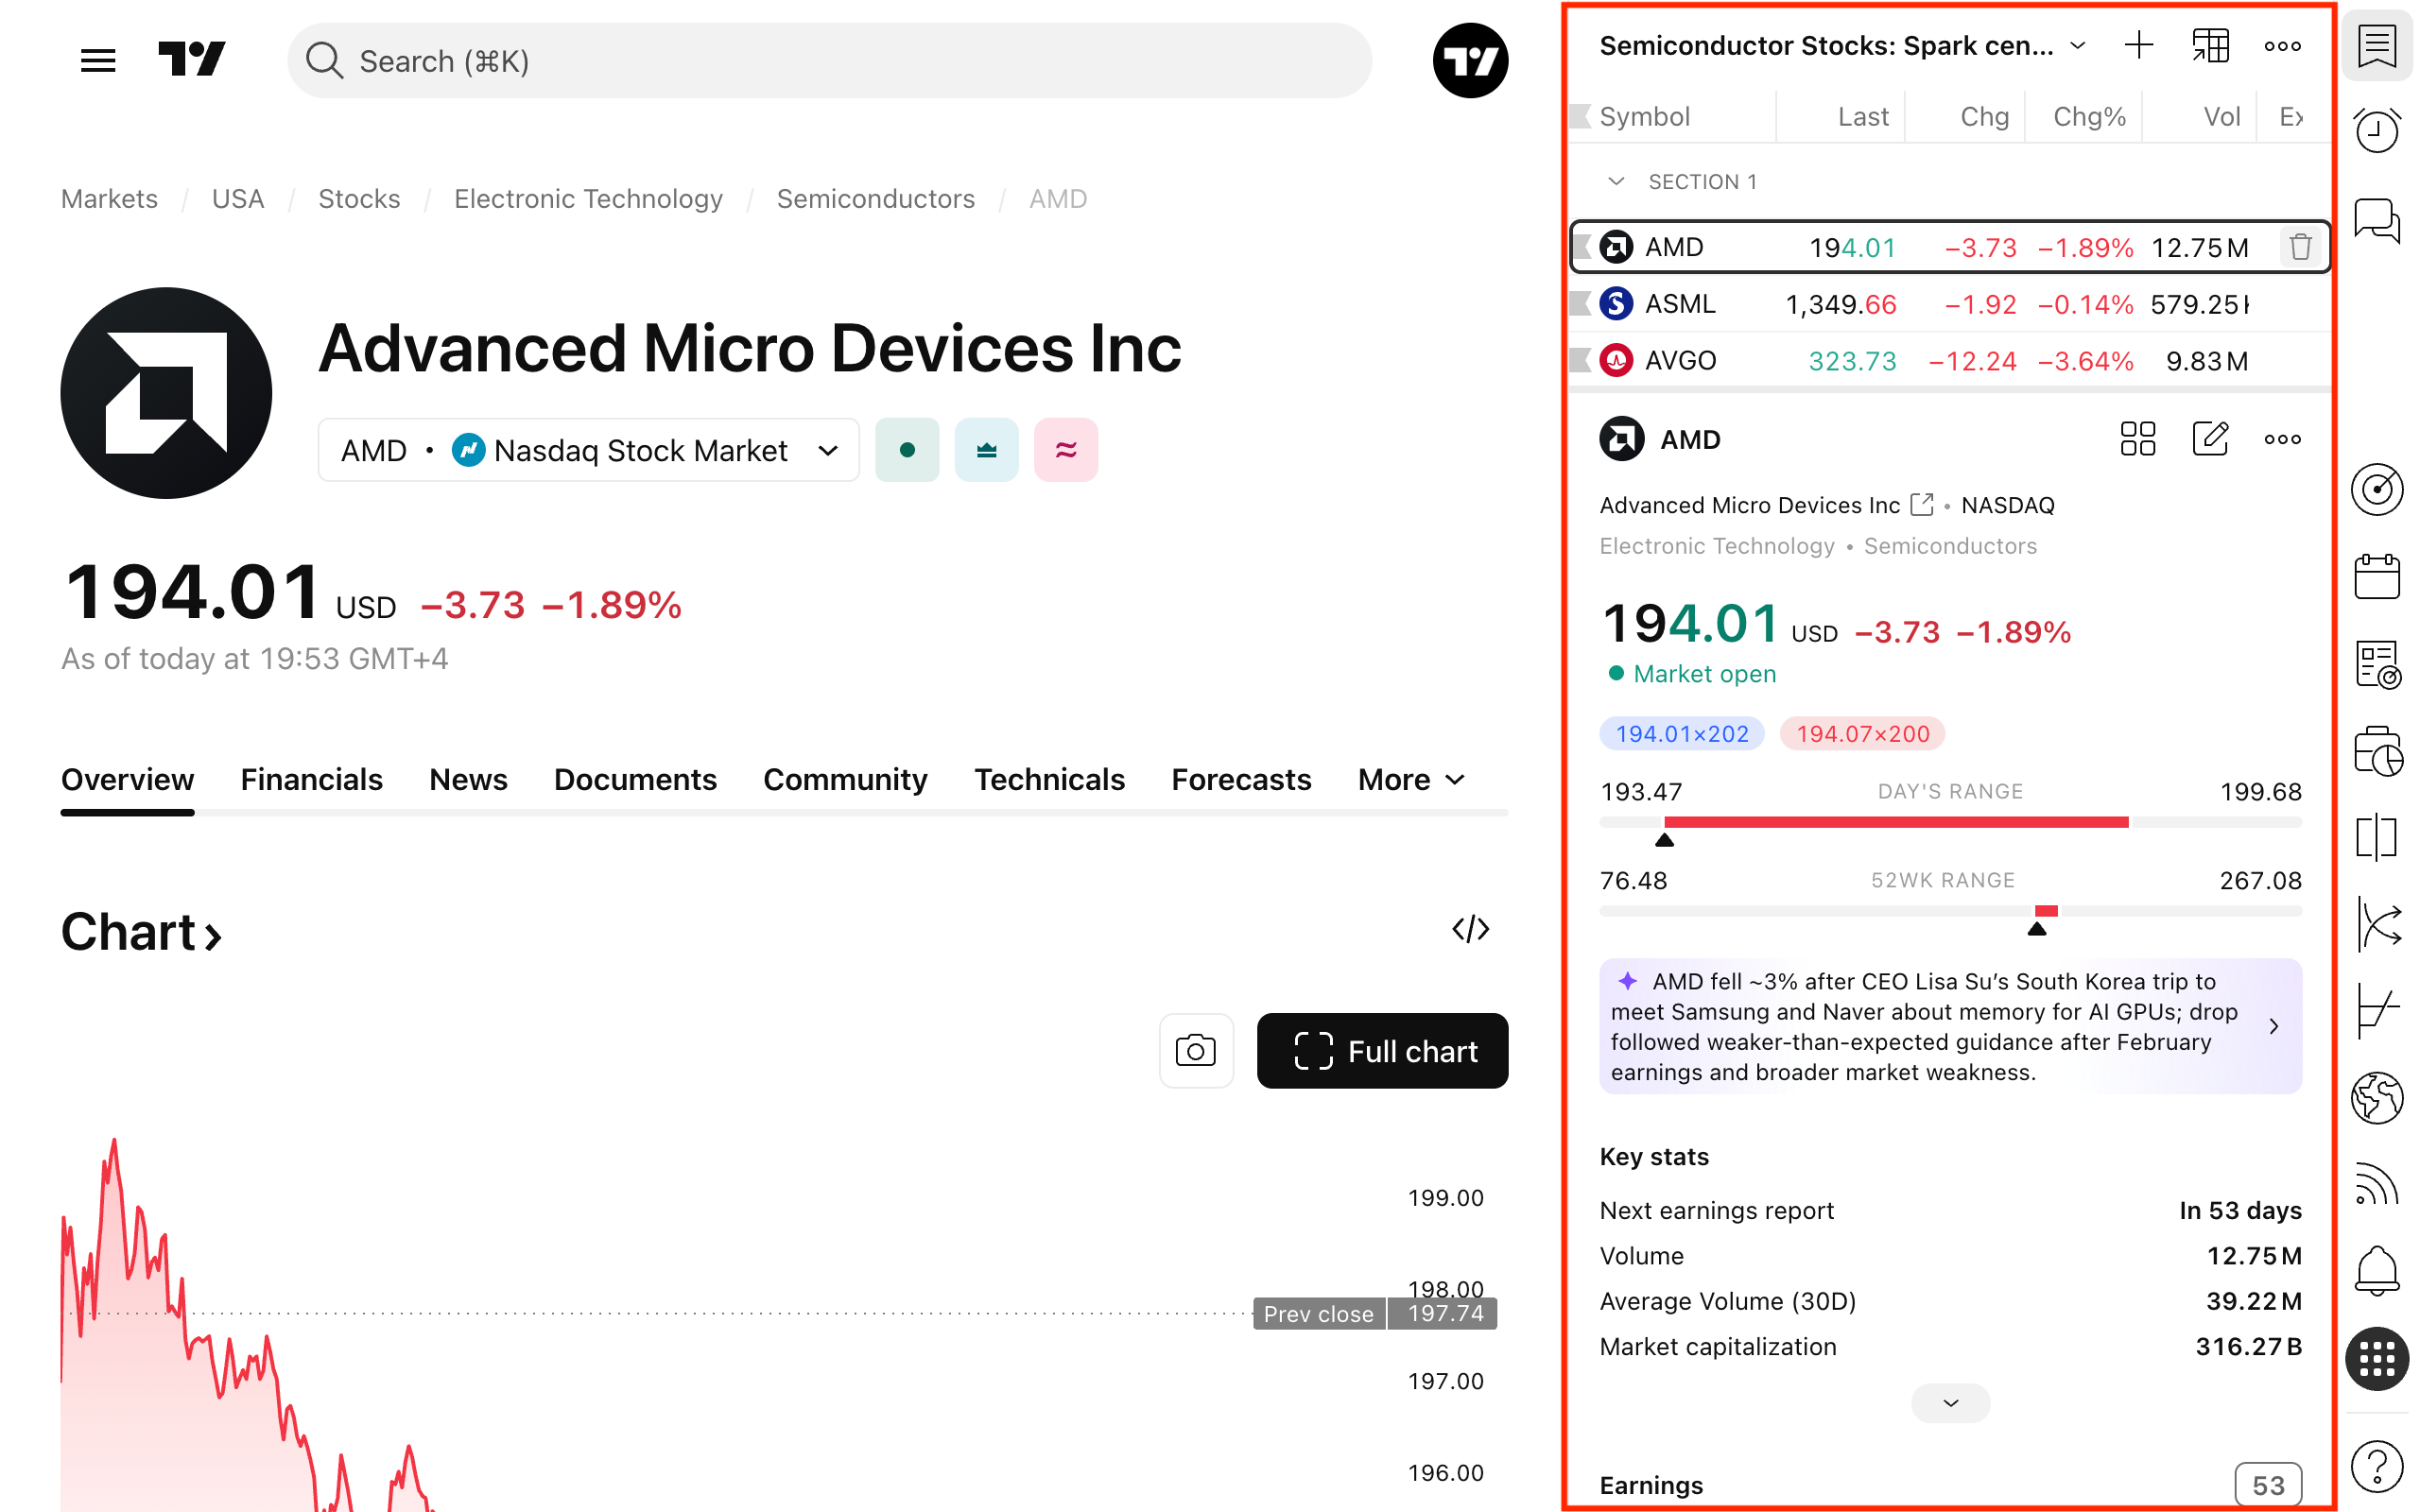
To expand these details into full-screen mode, click the button and choose the specific data you need. You can also add a private text note for the symbol, which you can access anytime later.
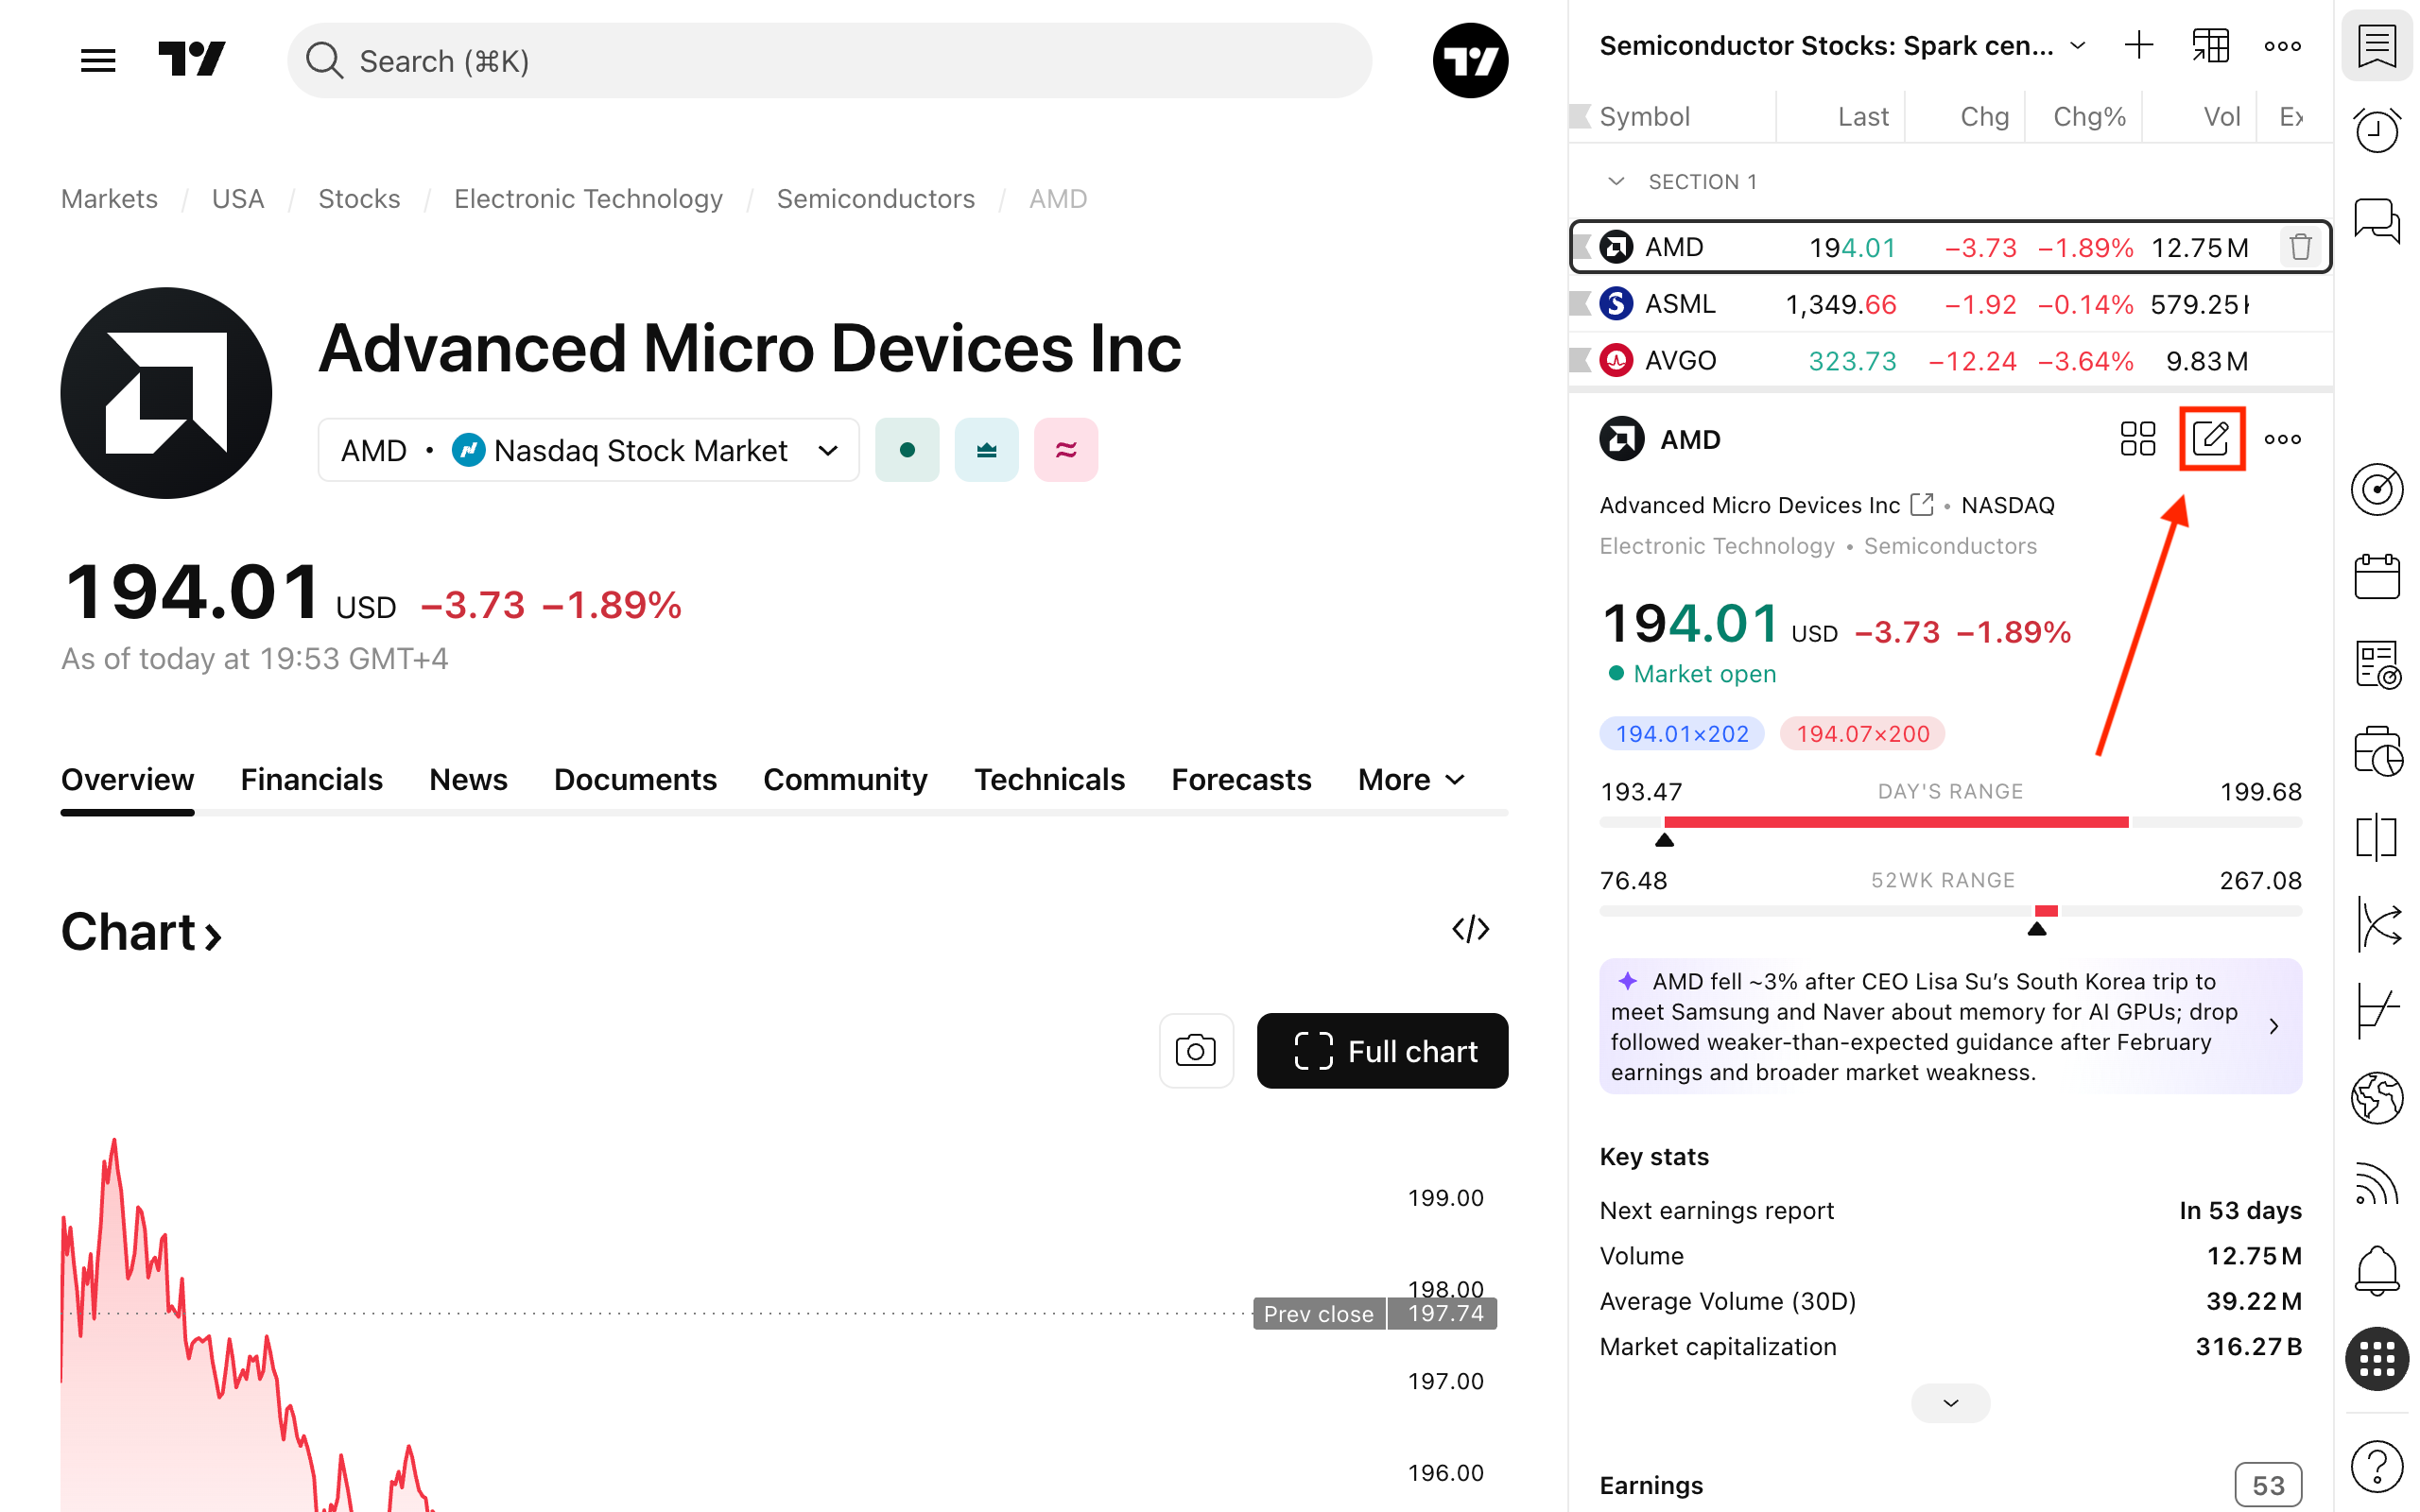
Advanced view
For deeper analysis, open the Advanced view, which grants access to four dedicated pages:
- Overview: Gives you general data on each symbol and a watchlist distribution across symbol types and sectors.
- Earnings: Contains upcoming reports from the Earnings Calendar.
- Dividends: Contains payout information from the Dividend Calendar.
- News: Aggregates the latest news for all symbols currently in your watchlist.
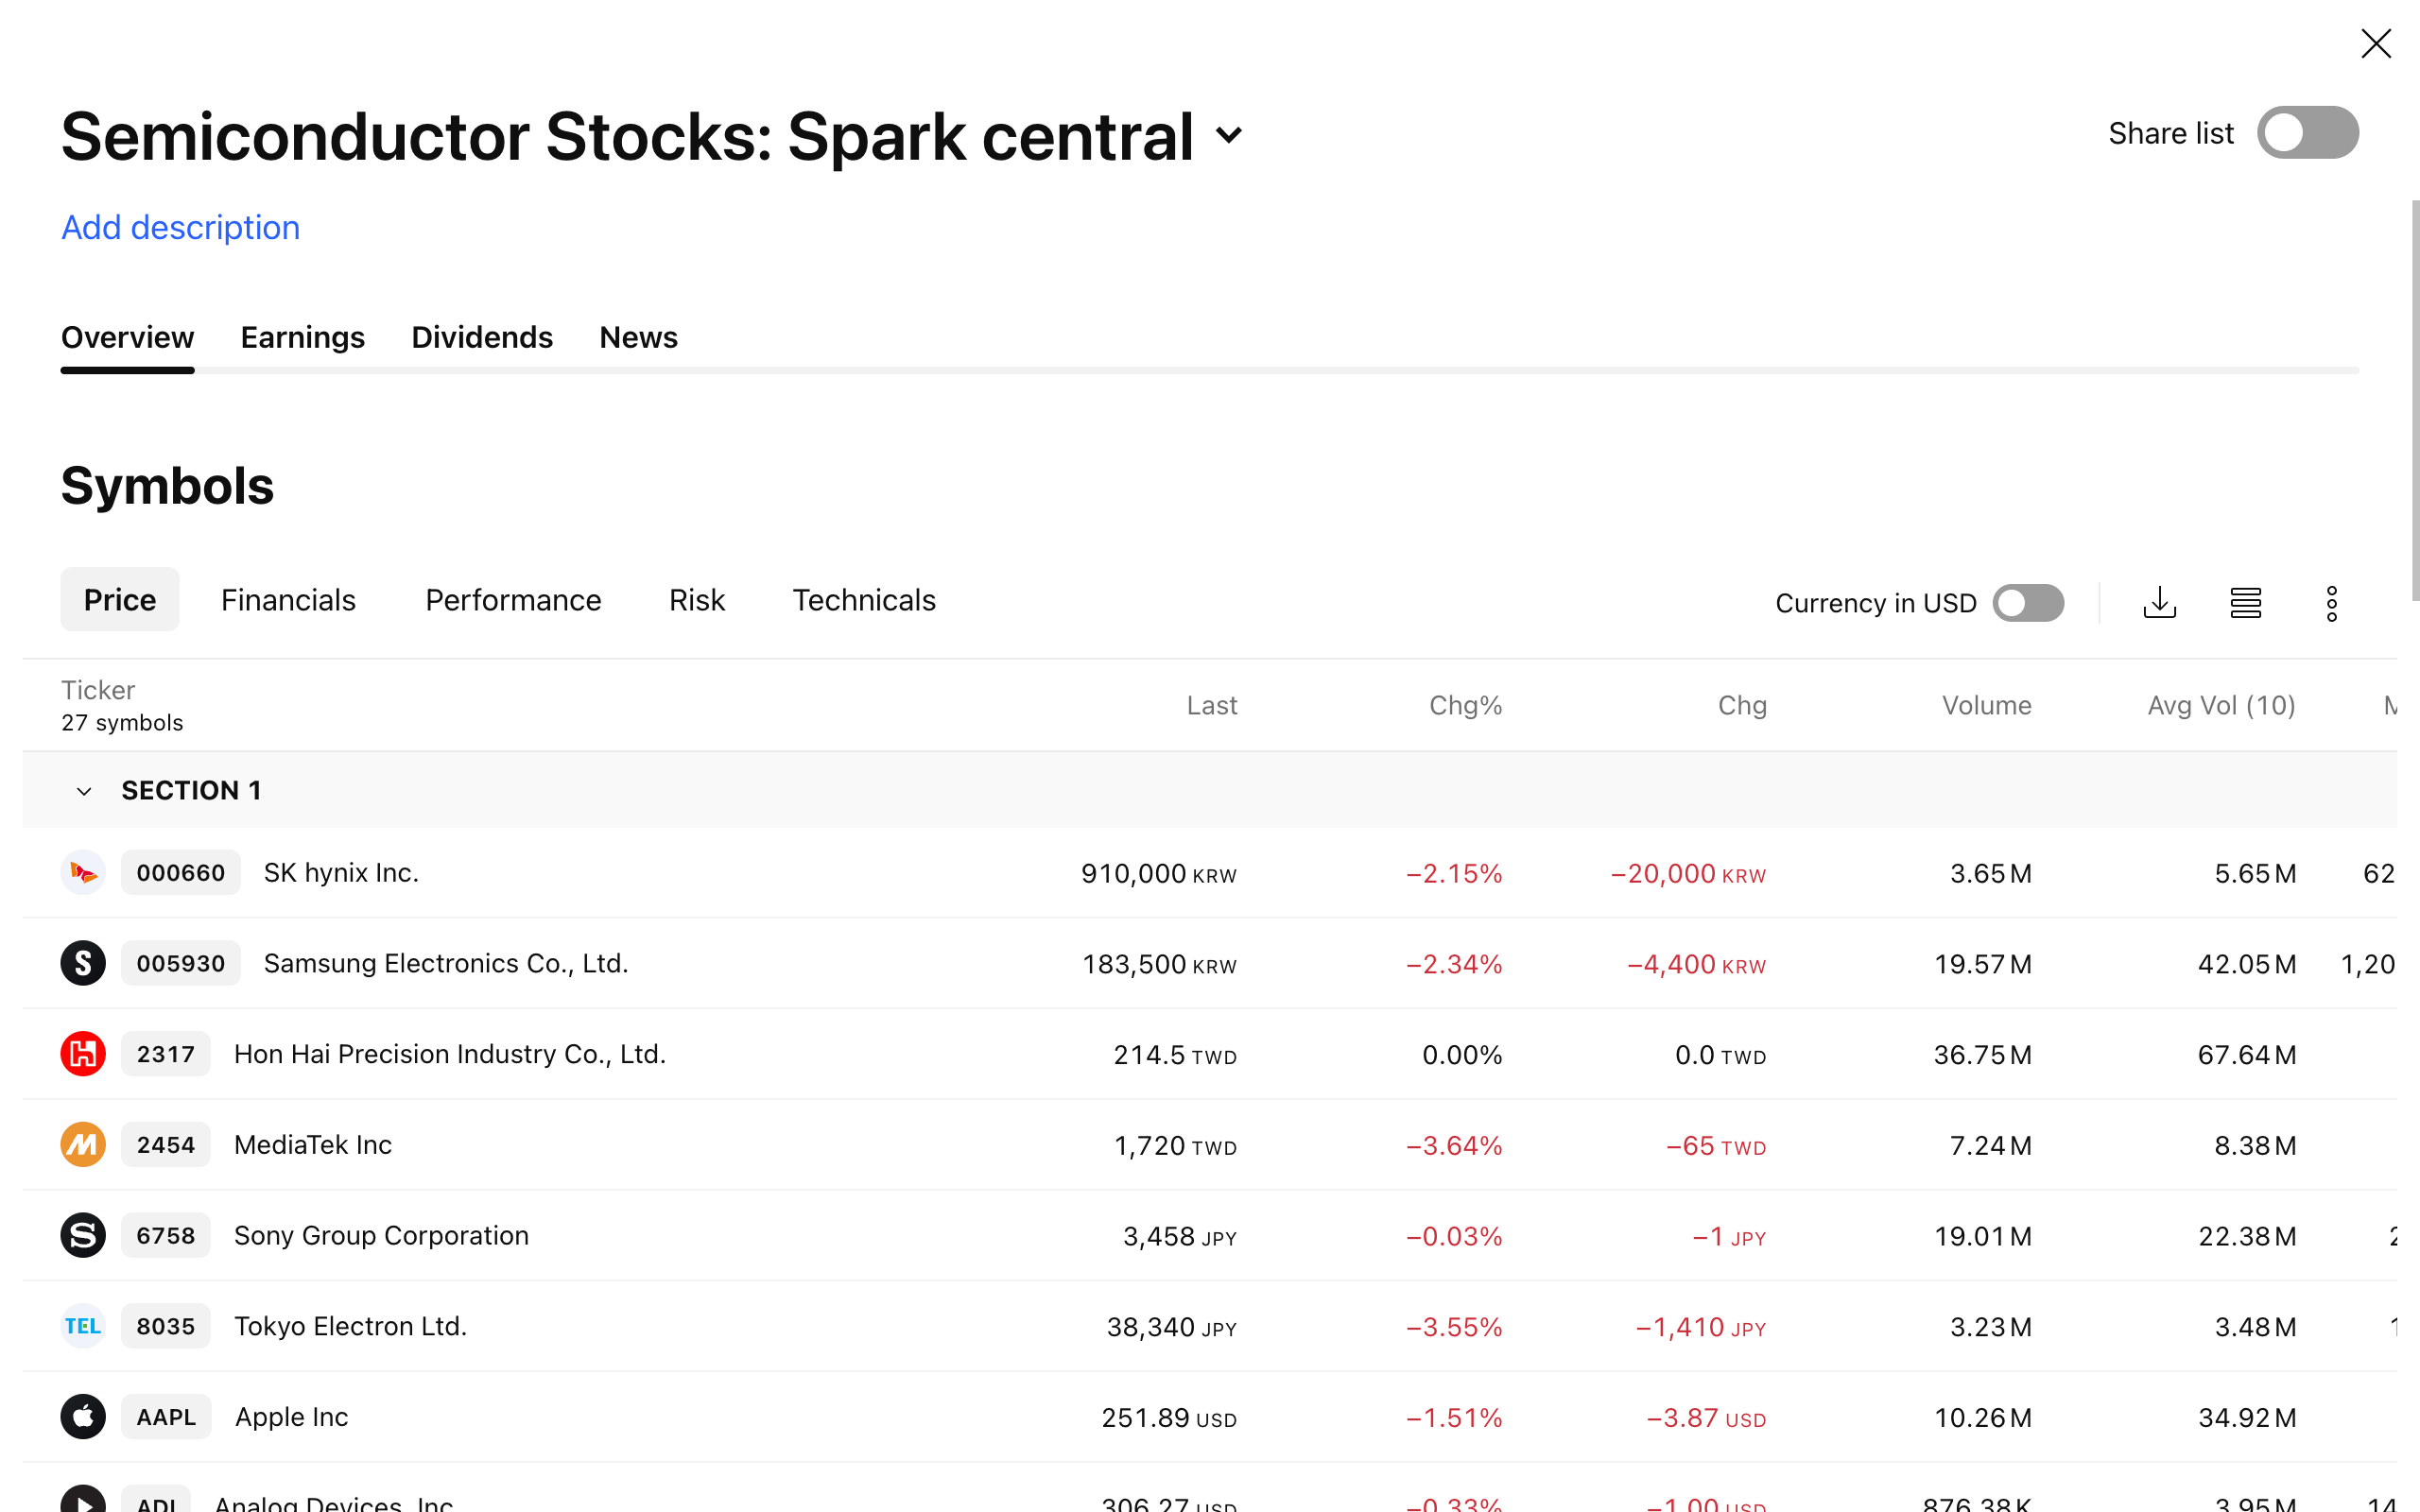
In the Overview tab, you can view core metrics categorized by:
- Financials: Metrics such as EPS, P/E ratio, and others.
- Performance: Symbol performance expressed as percentages over various timeframes.
- Risk: Volatility and Beta metrics.
- Technicals: Key technical analysis stats.
Advanced view features:
- Currency toggle: In the upper-right corner, you can toggle Currency in USD to easily compare prices in multi-currency lists.
- Summary values: To get the bigger picture, you can view summary rows at the bottom of your data, showing the minimum, maximum, average, and median values for your list.
- Grouping: You can group your advanced watchlist view by Custom section, Currency, Symbol type, Sector, or Exchange.
Watchlists in a nutshell
TradingView watchlists help you keep your most important assets in one place so you can monitor and analyze them efficiently. You can add symbols, organize them into custom sections, sort them by key metrics, and tailor the layout to perfectly match your workflow. Watchlists also provide rapid access to symbol details, including news, fundamentals, technical data, and personal notes.
In the Advanced view, you can explore broader insights across your entire list, tracking performance, earnings, dividends, and sector distribution all from a single screen.
Also read: