Fibonacci Confluence Toolkit [LuxAlgo]The Fibonacci Confluence Toolkit is a technical analysis tool designed to help traders identify potential price reversal zones by combining key market signals and patterns. It highlights areas of interest where significant price action or reactions are anticipated, automatically applies Fibonacci retracement levels to outline potential pullback zones, and detects engulfing candle patterns.
Its unique strength lies in its reliance solely on price patterns, eliminating the need for user-defined inputs, ensuring a robust and objective analysis of market dynamics.
🔶 USAGE
The script begins by detecting CHoCH (Change of Character) points—key indicators of shifts in market direction. This script integrates the principles of pure price action as applied in Pure-Price-Action-Structures , where further details on the detection process can be found.
The detected CHoCH points serve as the foundation for defining an Area of Interest (AOI), a zone where significant price action or reactions are anticipated.
As new swing highs or lows emerge within the AOI, the tool automatically applies Fibonacci retracement levels to outline potential retracement zones. This setup enables traders to identify areas where price pullbacks may occur, offering actionable insights into potential entries or reversals.
Additionally, the toolkit highlights engulfing candle patterns within these zones, further refining entry points and enhancing confluence for better-informed trading decisions based on real-time trend dynamics and price behavior.
🔶 SETTINGS
🔹 Market Patterns
Bullish Structures: Enable or disable all bullish components of the indicator.
Bearish Structures: Enable or disable all bearish components of the indicator.
Highlight Area of Interest: Toggle the option to highlight the Areas of Interest (enabled or disabled).
CHoCH Line: Choose the line style for the CHoCH (Solid, Dashed, or Dotted).
Width: Adjust the width of the CHoCH line.
🔹 Retracement Levels
Choose which Fibonacci retracement levels to display (e.g., 0, 0.236, 0.382, etc.).
🔹 Swing Levels & Engulfing Patterns
Swing Levels: Select how swing levels are marked (symbols like ◉, △▽, or H/L).
Engulfing Candle Patterns: Choose which engulfing candle patterns to detect (All, Structure-Based, or Disabled).
🔶 RELATED SCRIPTS
Pure-Price-Action-Structures.
Indicators and strategies

Linear Regression Channel [TradingFinder] Existing Trend Line🔵 Introduction
The Linear Regression Channel indicator is one of the technical analysis tool, widely used to identify support, resistance, and analyze upward and downward trends.
The Linear Regression Channel comprises five main components : the midline, representing the linear regression line, and the support and resistance lines, which are calculated based on the distance from the midline using either standard deviation or ATR.
This indicator leverages linear regression to forecast price changes based on historical data and encapsulates price movements within a price channel.
The upper and lower lines of the channel, which define resistance and support levels, assist traders in pinpointing entry and exit points, ultimately aiding better trading decisions.
When prices approach these channel lines, the likelihood of interaction with support or resistance levels increases, and breaking through these lines may signal a price reversal or continuation.
Due to its precision in identifying price trends, analyzing trend reversals, and determining key price levels, the Linear Regression Channel indicator is widely regarded as a reliable tool across financial markets such as Forex, stocks, and cryptocurrencies.
🔵 How to Use
🟣 Identifying Entry Signals
One of the primary uses of this indicator is recognizing buy signals. The lower channel line acts as a support level, and when the price nears this line, the likelihood of an upward reversal increases.
In an uptrend : When the price approaches the lower channel line and signs of upward reversal (e.g., reversal candlesticks or high trading volume) are observed, it is considered a buy signal.
In a downtrend : If the price breaks the lower channel line and subsequently re-enters the channel, it may signal a trend change, offering a buying opportunity.
🟣 Identifying Exit Signals
The Linear Regression Channel is also used to identify sell signals. The upper channel line generally acts as a resistance level, and when the price approaches this line, the likelihood of a price decrease increases.
In an uptrend : Approaching the upper channel line and observing weakness in the uptrend (e.g., declining volume or reversal patterns) indicates a sell signal.
In a downtrend : When the price reaches the upper channel line and reverses downward, this is considered a signal to exit trades.
🟣 Analyzing Channel Breakouts
The Linear Regression Channel allows traders to identify price breakouts as strong signals of potential trend changes.
Breaking the upper channel line : Indicates buyer strength and the likelihood of a continued uptrend, often accompanied by increased trading volume.
Breaking the lower channel line : Suggests seller dominance and the possibility of a continued downtrend, providing a strong sell signal.
🟣 Mean Reversion Analysis
A key concept in using the Linear Regression Channel is the tendency for prices to revert to the midline of the channel, which acts as a dynamic moving average, reflecting the price's equilibrium over time.
In uptrends : Significant deviations from the midline increase the likelihood of a price retracement toward the midline.
In downtrends : When prices deviate considerably from the midline, a return toward the midline can be used to identify potential reversal points.
🔵 Settings
🟣 Time Frame
The time frame setting enables users to view higher time frame data on a lower time frame chart. This feature is especially useful for traders employing multi-time frame analysis.
🟣 Regression Type
Standard : Utilizes classical linear regression to draw the midline and channel lines.
Advanced : Produces similar results to the standard method but may provide slightly different alignment on the chart.
🟣 Scaling Type
Standard Deviation : Suitable for markets with stable volatility.
ATR (Average True Range) : Ideal for markets with higher volatility.
🟣 Scaling Coefficients
Larger coefficients create broader channels for broader trend analysis.
Smaller coefficients produce tighter channels for precision analysis.
🟣 Channel Extension
None : No extension.
Left: Extends lines to the left to analyze historical trends.
Right : Extends lines to the right for future predictions.
Both : Extends lines in both directions.
🔵 Conclusion
The Linear Regression Channel indicator is a versatile and powerful tool in technical analysis, providing traders with support, resistance, and midline insights to better understand price behavior. Its advanced settings, including time frame selection, regression type, scaling options, and customizable coefficients, allow for tailored and precise analysis.
One of its standout advantages is its ability to support multi-time frame analysis, enabling traders to view higher time frame data within a lower time frame context. The option to use scaling methods like ATR or standard deviation further enhances its adaptability to markets with varying volatility.
Designed to identify entry and exit signals, analyze mean reversion, and assess channel breakouts, this indicator is suitable for a wide range of markets, including Forex, stocks, and cryptocurrencies. By incorporating this tool into your trading strategy, you can make more informed decisions and improve the accuracy of your market predictions.

Adaptive Price Zone Oscillator [QuantAlgo]Adaptive Price Zone Oscillator 🎯📊
The Adaptive Price Zone (APZ) Oscillator by QuantAlgo is an advanced technical indicator designed to identify market trends and reversals through adaptive price zones based on volatility-adjusted bands. This sophisticated system combines typical price analysis with dynamic volatility measurements to help traders and investors identify trend direction, potential reversals, and market volatility conditions. By evaluating both price action and volatility together, this tool enables users to make informed trading decisions while adapting to changing market conditions.
💫 Dynamic Zone Architecture
The APZ Oscillator provides a unique framework for assessing market trends through a blend of smoothed typical prices and volatility-based calculations. Unlike traditional oscillators that use fixed parameters, this system incorporates dynamic volatility measurements to adjust sensitivity automatically, helping users determine whether price movements are significant relative to current market conditions. By combining smoothed price trends with adaptive volatility zones, it evaluates both directional movement and market volatility, while the smoothing parameters ensure stable yet responsive signals. This adaptive approach allows users to identify trending conditions while remaining aware of volatility expansions and contractions, enhancing both trend-following and mean-reversion strategies.
📊 Indicator Components & Mechanics
The APZ Oscillator is composed of several technical components that create a dynamic trending system:
Typical Price: Utilizes HLC3 (High, Low, Close average) as a balanced price representation
Volatility Measurement: Computes exponential moving average of price changes to determine dynamic zones
Smoothed Calculations: Applies additional smoothing to reduce noise while maintaining responsiveness
Trend Detection: Evaluates price position relative to adaptive zones to determine market direction
📈 Key Indicators and Features
The APZ Oscillator utilizes typical price with customizable length and threshold parameters to adapt to different trading styles. Volatility calculations are applied to determine zone boundaries, providing context-aware levels for trend identification. The trend detection component evaluates price action relative to the adaptive zones, helping validate trends and identify potential reversals.
The indicator also incorporates multi-layered visualization with:
Color-coded trend representation (bullish/bearish)
Clear trend state indicators (+1/-1)
Mean reversion signals with distinct markers
Gradient fills for better visual clarity
Programmable alerts for trend changes
⚡️ Practical Applications and Examples
✅ Add the Indicator : Add the indicator to your TradingView chart by clicking on the star icon to add it to your favorites ⭐️
👀 Monitor Trend State : Watch the oscillator's position relative to the zero line to identify trend direction and potential reversals. The step-line visualization with diamonds makes trend changes clearly visible.
🎯 Track Signals : Pay attention to the mean reversion markers that appear above and below the price chart:
→ Upward triangles (⤻) signal potential bullish reversals
→ X crosses (↷) indicate potential bearish reversals
🔔 Set Alerts : Configure alerts for trend changes in both bullish and bearish directions, ensuring you can act on significant technical developments promptly.
🌟 Summary and Tips
The Adaptive Price Zone Oscillator by QuantAlgo is a versatile technical tool, designed to support both trend following and mean reversion strategies across different market environments. By combining smoothed typical price analysis with dynamic volatility-based zones, it helps traders and investors identify significant trend changes while measuring market volatility, providing reliable technical signals. The tool's adaptability through customizable length, threshold, and smoothing parameters makes it suitable for various trading timeframes and styles, allowing users to capture opportunities while maintaining awareness of changing market conditions.
Key parameters to optimize for your trading style:
APZ Length: Adjust for more or less sensitivity to price changes
Threshold: Fine-tune the volatility multiplier for wider or narrower zones
Smoothing: Balance noise reduction with signal responsiveness

Swing High/Low Pivots Strategy [LV]The Swing High/Low Pivots Strategy was developed as a counter-momentum trading tool.
The strategy is suitable for any market and its default input values are set to fit BTC 15min.
Check tooltips in the settings menu for more details about user inputs.
Trades Entry based on the detection of swing highs and lows for short and long entries respectively, validated by:
Limit orders placed after each new pivot level confirmation
Moving averages trend filter (if enabled)
No active trade
Trades Exit when the price reaches take-profit or stop-loss level as defined in the settings menu. A double entry/second take-profit level can be enabled for partial exits, with dynamic stop-loss adjustment for the remaining position.
Swing High/Low Pivot Detection
Employs ta.pivothigh and ta.pivotlow to detect higher highs (HH), lower highs (LH), higher lows (HL), and lower lows (LL).
Trend Filter
Integrates a moving average filter to validate trade entries based on the current trend observed at Pivot. Supports multiple moving average types, including EMA, SMA, WMA, HMA, VWMA, VWAP, and more.
Alerts
Configurable alert messages are suitable for API use.
Visuals
Moving average
Pivot markers
Limit lines
Stop-loss
Take-profit
Any feedback, comments, or suggestions for improvement are always welcome.
Hope you enjoy ;)

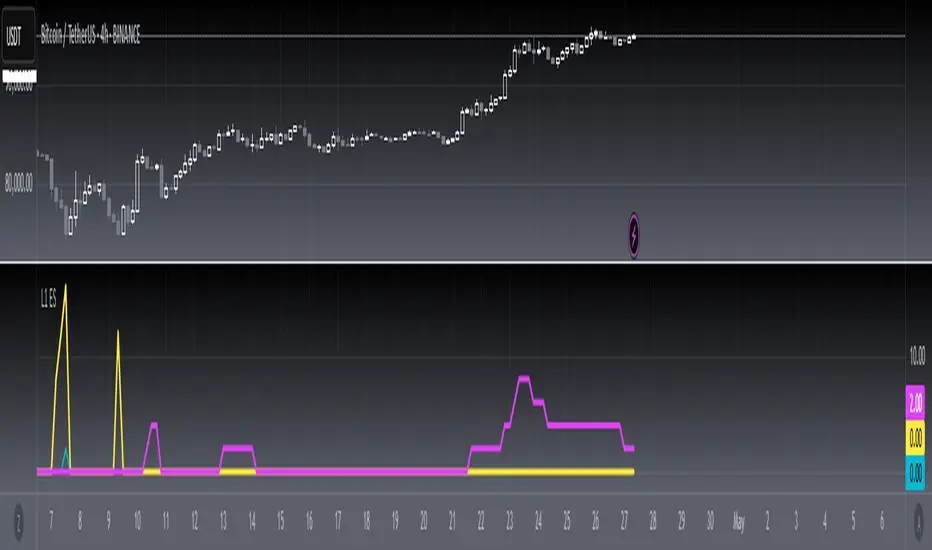
[blackcat] L1 Extreme Shadows█ OVERVIEW
The Pine Script provided is an indicator designed to detect market volatility and extreme shadow conditions. It calculates various conditions based on simple moving averages (SMAs) and plots the results to help traders identify potential market extremes. The primary function of the script is to provide visual cues for extreme market conditions without generating explicit trading signals.
█ LOGICAL FRAMEWORK
Structure:
1 — Input Parameters:
• No user-defined input parameters are present in this script.
2 — Calculations:
• Calculate Extreme Shadow: Checks if the differences between certain SMAs and prices exceed predefined thresholds.
• Calculate Buy Extreme Shadow: Extends the logic by incorporating additional SMAs to identify stronger buy signals.
• Calculate Massive Bullish Sell: Detects massive bullish sell conditions using longer-term SMAs.
3 — Plotting:
• The script plots the calculated conditions using distinct colors to differentiate between various types of extreme shadows.
Data Flow:
• The close price is passed through each custom function.
• Each function computes its respective conditions based on specified SMAs and thresholds.
• The computed values are then summed and returned.
• Finally, the aggregated values are plotted on the chart using the plot function.
█ CUSTOM FUNCTIONS
1 — calculate_extreme_shadow(close)
• Purpose: Identify extreme shadow conditions based on 8-period and 14-period SMAs.
• Functionality: Computes the difference between the 8-period SMA and the close price, and the difference between the 14-period SMA and the 4-period SMA, relative to the 6-period SMA. Returns 2 if both conditions exceed 0.04; otherwise, returns 0.
• Parameters: close (price series)
• Return Value: Integer (0 or 2)
2 — calculate_buy_extreme_shadow(close)
• Purpose: Identify more robust buy signals by evaluating multiple SMAs.
• Functionality: Considers the 8-period SMA along with additional SMAs (21, 42, 63, 84, 105) and combines multiple conditions to provide a comprehensive buy signal.
• Parameters: close (price series)
• Return Value: Integer (sum of conditions, ranging from 0 to 14)
3 — calculate_massive_bullish_sell(close)
• Purpose: Detect massive bullish sell conditions using longer-term SMAs.
• Functionality: Evaluates conditions based on the 8-period SMA and longer-term SMAs (88, 44, 22, 11, 5), returning a sum of conditions meeting specified thresholds.
• Parameters: close (price series)
• Return Value: Integer (sum of conditions, ranging from 0 to 10)
█ KEY POINTS AND TECHNIQUES
• Advanced Pine Script Features:
• Multiple Nested Conditions: Uses nested conditions to assess complex market scenarios.
• Combination of Conditions: Combines multiple conditions to provide a more reliable signal.
• Optimization Techniques:
• Thresholds: Employs specific thresholds (0.04 and 0.03) to filter out noise and highlight significant market movements.
• SMA Comparisons: Compares multiple SMAs to identify trends and extreme conditions.
• Unique Approaches:
• Combining Multiple Time Frames: Incorporates multiple time frames to offer a holistic view of the market.
• Visual Distinction: Utilizes different colors and line widths to clearly differentiate between various extreme shadow conditions.
█ EXTENDED KNOWLEDGE AND APPLICATIONS
• Potential Modifications:
• User-Defined Thresholds: Allow users to customize thresholds to align with personal trading strategies.
• Additional Indicators: Integrate other technical indicators like RSI or MACD to improve the detection of extreme market conditions.
• Entry and Exit Signals: Enhance the script to generate clear buy and sell signals based on identified extreme shadow conditions.
• Application Scenarios:
• Volatility Analysis: Analyze market volatility and pinpoint times of extreme price action.
• Trend Following: Pair with trend-following strategies to capitalize on significant market moves.
• Risk Management: Adjust position sizes or stop-loss levels based on detected extreme conditions.
• Related Pine Script Concepts:
• Custom Functions: Demonstrates how to create reusable functions for simplified and organized code.
• Plotting Techniques: Shows effective ways to visualize data using color and styling options.
• Multiple Time Frame Analysis: Highlights the benefits of analyzing multiple time frames for a broader market understanding.
Prediction Based on Linreg & Atr
We created this algorithm with the goal of predicting future prices 📊, specifically where the value of any asset will go in the next 20 periods ⏳. It uses linear regression based on past prices, calculating a slope and an intercept to forecast future behavior 🔮. This prediction is then adjusted according to market volatility, measured by the ATR 📉, and the direction of trend signals, which are based on the MACD and moving averages 📈.
How Does the Linreg & ATR Prediction Work?
1. Trend Calculation and Signals:
o Technical Indicators: We use short- and long-term exponential moving averages (EMA), RSI, MACD, and Bollinger Bands 📊 to assess market direction and sentiment (not visually presented in the script).
o Calculation Functions: These include functions to calculate slope, average, intercept, standard deviation, and Pearson's R, which are crucial for regression analysis 📉.
2. Predicting Future Prices:
o Linear Regression: The algorithm calculates the slope, average, and intercept of past prices to create a regression channel 📈, helping to predict the range of future prices 🔮.
o Standard Deviation and Pearson's R: These metrics determine the strength of the regression 🔍.
3. Adjusting the Prediction:
o The predicted value is adjusted by considering market volatility (ATR 📉) and the direction of trend signals 🔮, ensuring that the prediction is aligned with the current market environment 🌍.
4. Visualization:
o Prediction Lines and Bands: The algorithm plots lines that display the predicted future price along with a prediction range (upper and lower bounds) 📉📈.
5. EMA Cross Signals:
o EMA Conditions and Total Score: A bullish crossover signal is generated when the total score is positive and the short EMA crosses above the long EMA 📈. A bearish crossover signal is generated when the total score is negative and the short EMA crosses below the long EMA 📉.
6. Additional Considerations:
o Multi-Timeframe Regression Channel: The script calculates regression channels for different timeframes (5m, 15m, 30m, 4h) ⏳, helping determine the overall market direction 📊 (not visually presented).
Confidence Interpretation:
• High Confidence (close to 100%): Indicates strong alignment between timeframes with a clear trend (bullish or bearish) 🔥.
• Low Confidence (close to 0%): Shows disagreement or weak signals between timeframes ⚠️.
Confidence complements the interpretation of the prediction range and expected direction 🔮, aiding in decision-making for market entry or exit 🚀.
Español
Creamos este algoritmo con el objetivo de predecir los precios futuros 📊, específicamente hacia dónde irá el valor de cualquier activo en los próximos 20 períodos ⏳. Utiliza regresión lineal basada en los precios pasados, calculando una pendiente y una intersección para prever el comportamiento futuro 🔮. Esta predicción se ajusta según la volatilidad del mercado, medida por el ATR 📉, y la dirección de las señales de tendencia, que se basan en el MACD y las medias móviles 📈.
¿Cómo Funciona la Predicción con Linreg & ATR?
Cálculo de Tendencias y Señales:
Indicadores Técnicos: Usamos medias móviles exponenciales (EMA) a corto y largo plazo, RSI, MACD y Bandas de Bollinger 📊 para evaluar la dirección y el sentimiento del mercado (no presentados visualmente en el script).
Funciones de Cálculo: Incluye funciones para calcular pendiente, media, intersección, desviación estándar y el coeficiente de correlación de Pearson, esenciales para el análisis de regresión 📉.
Predicción de Precios Futuros:
Regresión Lineal: El algoritmo calcula la pendiente, la media y la intersección de los precios pasados para crear un canal de regresión 📈, ayudando a predecir el rango de precios futuros 🔮.
Desviación Estándar y Pearson's R: Estas métricas determinan la fuerza de la regresión 🔍.
Ajuste de la Predicción:
El valor predicho se ajusta considerando la volatilidad del mercado (ATR 📉) y la dirección de las señales de tendencia 🔮, asegurando que la predicción esté alineada con el entorno actual del mercado 🌍.
Visualización:
Líneas y Bandas de Predicción: El algoritmo traza líneas que muestran el precio futuro predicho, junto con un rango de predicción (límites superior e inferior) 📉📈.
Señales de Cruce de EMAs:
Condiciones de EMAs y Puntaje Total: Se genera una señal de cruce alcista cuando el puntaje total es positivo y la EMA corta cruza por encima de la EMA larga 📈. Se genera una señal de cruce bajista cuando el puntaje total es negativo y la EMA corta cruza por debajo de la EMA larga 📉.
Consideraciones Adicionales:
Canal de Regresión Multi-Timeframe: El script calcula canales de regresión para diferentes marcos de tiempo (5m, 15m, 30m, 4h) ⏳, ayudando a determinar la dirección general del mercado 📊 (no presentado visualmente).
Interpretación de la Confianza:
Alta Confianza (cerca del 100%): Indica una fuerte alineación entre los marcos temporales con una tendencia clara (alcista o bajista) 🔥.
Baja Confianza (cerca del 0%): Muestra desacuerdo o señales débiles entre los marcos temporales ⚠️.
La confianza complementa la interpretación del rango de predicción y la dirección esperada 🔮, ayudando en las decisiones de entrada o salida en el mercado 🚀.

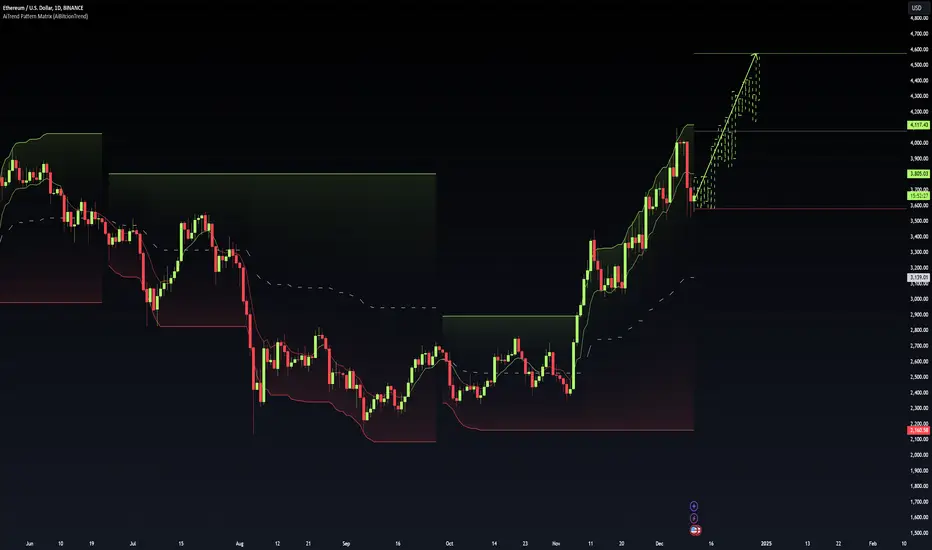
AiTrend Pattern Matrix for kNN Forecasting (AiBitcoinTrend)The AiTrend Pattern Matrix for kNN Forecasting (AiBitcoinTrend) is a cutting-edge indicator that combines advanced mathematical modeling, AI-driven analytics, and segment-based pattern recognition to forecast price movements with precision. This tool is designed to provide traders with deep insights into market dynamics by leveraging multivariate pattern detection and sophisticated predictive algorithms.
👽 Core Features
Segment-Based Pattern Recognition
At its heart, the indicator divides price data into discrete segments, capturing key elements like candle bodies, high-low ranges, and wicks. These segments are normalized using ATR-based volatility adjustments to ensure robustness across varying market conditions.
AI-Powered k-Nearest Neighbors (kNN) Prediction
The predictive engine uses the kNN algorithm to identify the closest historical patterns in a multivariate dictionary. By calculating the distance between current and historical segments, the algorithm determines the most likely outcomes, weighting predictions based on either proximity (distance) or averages.
Dynamic Dictionary of Historical Patterns
The indicator maintains a rolling dictionary of historical patterns, storing multivariate data for:
Candle body ranges, High-low ranges, Wick highs and lows.
This dynamic approach ensures the model adapts continuously to evolving market conditions.
Volatility-Normalized Forecasting
Using ATR bands, the indicator normalizes patterns, reducing noise and enhancing the reliability of predictions in high-volatility environments.
AI-Driven Trend Detection
The indicator not only predicts price levels but also identifies market regimes by comparing current conditions to historically significant highs, lows, and midpoints. This allows for clear visualizations of trend shifts and momentum changes.
👽 Deep Dive into the Core Mathematics
👾 Segment-Based Multivariate Pattern Analysis
The indicator analyzes price data by dividing each bar into distinct segments, isolating key components such as:
Body Ranges: Differences between the open and close prices.
High-Low Ranges: Capturing the full volatility of a bar.
Wick Extremes: Quantifying deviations beyond the body, both above and below.
Each segment contributes uniquely to the predictive model, ensuring a rich, multidimensional understanding of price action. These segments are stored in a rolling dictionary of patterns, enabling the indicator to reference historical behavior dynamically.
👾 Volatility Normalization Using ATR
To ensure robustness across varying market conditions, the indicator normalizes patterns using Average True Range (ATR). This process scales each component to account for the prevailing market volatility, allowing the algorithm to compare patterns on a level playing field regardless of differing price scales or fluctuations.
👾 k-Nearest Neighbors (kNN) Algorithm
The AI core employs the kNN algorithm, a machine-learning technique that evaluates the similarity between the current pattern and a library of historical patterns.
Euclidean Distance Calculation:
The indicator computes the multivariate distance across four distinct dimensions: body range, high-low range, wick low, and wick high. This ensures a comprehensive and precise comparison between patterns.
Weighting Schemes: The contribution of each pattern to the forecast is either weighted by its proximity (distance) or averaged, based on user settings.
👾 Prediction Horizon and Refinement
The indicator forecasts future price movements (Y_hat) by predicting logarithmic changes in the price and projecting them forward using exponential scaling. This forecast is smoothed using a user-defined EMA filter to reduce noise and enhance actionable clarity.
👽 AI-Driven Pattern Recognition
Dynamic Dictionary of Patterns: The indicator maintains a rolling dictionary of N multivariate patterns, continuously updated to reflect the latest market data. This ensures it adapts seamlessly to changing market conditions.
Nearest Neighbor Matching: At each bar, the algorithm identifies the most similar historical pattern. The prediction is based on the aggregated outcomes of the closest neighbors, providing confidence levels and directional bias.
Multivariate Synthesis: By combining multiple dimensions of price action into a unified prediction, the indicator achieves a level of depth and accuracy unattainable by single-variable models.
Visual Outputs
Forecast Line (Y_hat_line):
A smoothed projection of the expected price trend, based on the weighted contribution of similar historical patterns.
Trend Regime Bands:
Dynamic high, low, and midlines highlight the current market regime, providing actionable insights into momentum and range.
Historical Pattern Matching:
The nearest historical pattern is displayed, allowing traders to visualize similarities
👽 Applications
Trend Identification:
Detect and follow emerging trends early using dynamic trend regime analysis.
Reversal Signals:
Anticipate market reversals with high-confidence predictions based on historically similar scenarios.
Range and Momentum Trading:
Leverage multivariate analysis to understand price ranges and momentum, making it suitable for both breakout and mean-reversion strategies.
Disclaimer: This information is for entertainment purposes only and does not constitute financial advice. Please consult with a qualified financial advisor before making any investment decisions.
Enigma Endgame with Fibonacci FilterThe Enigma Endgame indicator combines advanced trade filtering with customizable session-based logic, providing high-precision buy and sell signals. This version incorporates a dynamic Fibonacci retracement filter, ensuring signals are aligned with key retracement levels for higher accuracy.
Key Features
1. Kill Zone Logic:
- Focuses on high-activity periods (London and US sessions).
- Fully customizable time settings for each session.
2. Fibonacci Filter:
- Calculates key Fibonacci retracement levels dynamically, including High, Low, and 50%.
- Filters buy signals to trigger only below the 50% Fibonacci level.
- Filters sell signals to trigger only at or above the 50% Fibonacci level.
3. Buy and Sell Logic:
- Detects bullish and bearish candlestick patterns.
- Uses lookback periods to confirm signal validity against recent highs/lows.
4. Customizable Plots:
- Toggle Fibonacci High, Low, and 50% levels directly from the Style tab (default: off).
- Historical buy and sell signals are displayed clearly with up/down labels.
5. Alerts
- Real-time alerts for both buy and sell signals to keep you informed.
How to Use
1. Configure your preferred London and US session times in the input settings.
2. Adjust the lookback period to fine-tune signal sensitivity.
3. Use the Fibonacci filter to enhance the accuracy of signals by aligning them with critical retracement levels.
4. Enable/disable Fibonacci plots as needed via the Style tab.
Ideal For
- Traders looking for session-based opportunities.
- Those who prefer combining Fibonacci retracement analysis with market timing.
- Users who value clean, high-quality signals with enhanced filtering.

Sameer Open Interest IndicatorThe script is a copy of Original Open interest indicator but resolved few bugs so that it start working again. It shows Open interest for the option symbol you have selected . This is experimental script and one should always go to authenticated source for data and decision making . This script is only useful for educational purpose and author is not liable for any moral or legal consequences . Any type of loss or harm by use of this indicator is sole responsibility of user and not that of author or trading view . Please use with caution. The script can change and terms can be updated anytime . The script can be deleted and stopped from using anytime.

Algorithmic Signal AnalyzerMeet Algorithmic Signal Analyzer (ASA) v1: A revolutionary tool that ushers in a new era of clarity and precision for both short-term and long-term market analysis, elevating your strategies to the next level.
ASA is an advanced TradingView indicator designed to filter out noise and enhance signal detection using mathematical models. By processing price movements within defined standard deviation ranges, ASA produces a smoothed analysis based on a Weighted Moving Average (WMA). The Volatility Filter ensures that only relevant price data is retained, removing outliers and improving analytical accuracy.
While ASA provides significant analytical advantages, it’s essential to understand its capabilities in both short-term and long-term use cases. For short-term trading, ASA excels at capturing swift opportunities by highlighting immediate trend changes. Conversely, in long-term trading, it reveals the overall direction of market trends, enabling traders to align their strategies with prevailing conditions.
Despite these benefits, traders must remember that ASA is not designed for precise trade execution systems where accuracy in timing and price levels is critical. Its focus is on analysis rather than order management. The distinction is crucial: ASA helps interpret price action effectively but may not account for real-time market factors such as slippage or execution delays.
Features and Functionality
ASA integrates multiple tools to enhance its analytical capabilities:
Customizable Moving Averages: SMA, EMA, and WMA options allow users to tailor the indicator to their trading style.
Signal Detection: Identifies bullish and bearish trends using the Relative Exponential Moving Average (REMA) and marks potential buy/sell opportunities.
Visual Aids: Color-coded trend lines (green for upward, red for downward) simplify interpretation.
Alert System: Notifications for trend swings and reversals enable timely decision-making.
Notes on Usage
ASA’s effectiveness depends on the context in which it is applied. Traders should carefully consider the trade-offs between analysis and execution.
Results may vary depending on market conditions and chart types. Backtesting with ASA on standard charts provides more reliable insights compared to non-standard chart types.
Short-term use focuses on rapid trend recognition, while long-term application emphasizes understanding broader market movements.
Takeaways
ASA is not a tool for precise trade execution but a powerful aid for interpreting price trends.
For short-term trading, ASA identifies quick opportunities, while for long-term strategies, it highlights trend directions.
Understanding ASA’s limitations and strengths is key to maximizing its utility.
ASA is a robust solution for traders seeking to filter noise, enhance analytical clarity, and align their strategies with market movements, whether for short bursts of activity or sustained trading goals.

Fractal_Alligator_Zone_Alerts by Pirooz_Trader (JustUncleL )This script is the same code developed by JustUncleL, named Fractal and Alligator Alerts ().
The only modification I made to this script is the application of zone-based color coding to the candle bodies, following Bill Williams' teachings. The color of the candle bodies changes based on the values of two oscillators, Awesome and Accelerator, as follows:
1. If the current bar of both AC and AO is greater than their respective previous bars, the candle color will be green (green zone).
2. If the current bar of both AC and AO is smaller than their respective previous bars, the candle color will be red (red zone).
3. If the current bar of AC and AO differs (one is increasing, the other is decreasing), the candle color will be gray.
Note 1: The border color of the candles represents their actual color (without applying the above conditions).
Note 2: You can disable or modify this candle color coding in the indicator settings.
For more information on trading based on specific zones, I recommend referring to Chapter 7 (Trading In The Zones) of this trader's book, New Trading Dimensions - How To Profit From Chaos In Stocks, Bonds, And Commodities.

AUTO GRID HORIZONTAL LINES (what you're looking 4)ESPAÑOL
Este indicador crea líneas horizontales basadas en los niveles de High y Low de un rango de días seleccionado, dividiendo la distancia entre ellas en partes iguales. Es ideal para visualizar zonas de soporte y resistencia de manera rápida y clara en cualquier marco temporal. Puedes ajustar el número de líneas y la distancia entre ellas según lo necesites. ¡Es perfecto para identificar niveles clave de precios de forma sencilla y efectiva!
----------------------------------------------------------------------------------------------------------------------ENGLISH
This indicator draws horizontal lines based on the High and Low levels of a selected range of days, evenly dividing the space between them. It’s great for quickly and clearly visualizing support and resistance zones on any timeframe. You can adjust the number of lines and the distance between them as needed. Perfect for identifying key price levels in a simple and effective way!

Zero-Lag MA CandlesThe Zero-Lag MA Candles indicator combines the efficiency of a Zero-Lag Moving Average (ZLMA) with dynamic candlestick coloring to provide a clear visual representation of market trends. By leveraging a dual EMA-based calculation, the ZLMA achieves reduced lag, enhancing its responsiveness to price changes. The indicator plots candles on the chart with colors determined by the trend direction of the ZLMA over a user-defined lookback period. Blue candles signify an uptrend, while yellow candles indicate a downtrend, offering traders an intuitive way to identify market sentiment.
This indicator is particularly useful for trend-following strategies, as the crossover and crossunder between the ZLMA and the standard EMA highlight potential reversal points or trend continuation zones. With customizable inputs for ZLMA length, trend lookback period, and color schemes, it caters to diverse trading preferences. Its ability to plot directly on the chart ensures seamless integration with other analysis tools, making it a valuable addition to a trader's toolkit.
Happy trading...
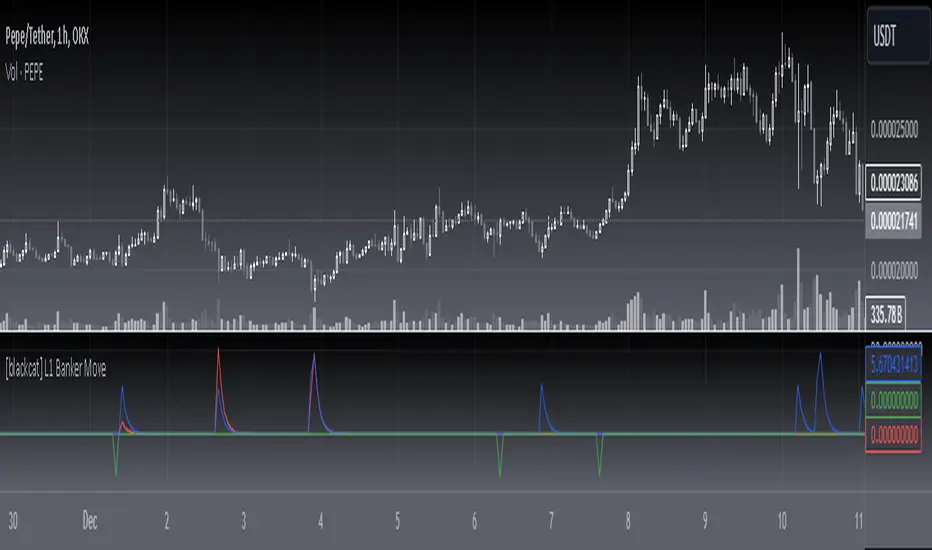
[blackcat] L1 Banker Move█ OVERVIEW
The Pine Script is an indicator designed to analyze market signals for institutional and short-term investors. It calculates and plots three main signals: Institutional Signal, Institutional Build, and Short-Term Investor Signal. The script uses a combination of price, volume, and moving average data to generate these signals, which can help traders identify potential buying or selling opportunities.
█ LOGICAL FRAMEWORK
The script is structured into several main sections:
1 — Input Parameters
The script does not explicitly define any input parameters, relying on default values for calculations.
2 — Custom Functions
• reference_value(values, length) : Retrieves the first non-NA value from a specified number of past values.
• calculate_institutional_and_short_term_signals(low, close, open, volume) : Calculates the institutional and short-term investor signals based on price, volume, and moving average data.
3 — Calculations
• Price and Volume Metrics: The script calculates various smoothed price changes, lowest and highest values over different periods, and volume-weighted prices.
• Moving Averages: It computes simple moving averages (SMA) and exponential moving averages (EMA) for different periods.
• RSI Calculation: The script calculates a custom RSI for different periods.
• Signal Generation: It generates the institutional and short-term investor signals based on the calculated metrics.
4 — Plotting
The script plots the three main signals on the chart using the plot function.
The flow of data and logic is as follows:
• The reference_value function is used to find reference values for calculations.
• The calculate_institutional_and_short_term_signals function performs the core calculations and returns the institutional and short-term investor signals.
• The main script calls this function and plots the results.
█ CUSTOM FUNCTIONS
1 — reference_value(values, length)
• Purpose : Retrieves the first non-NA value from a specified number of past values.
• Parameters :
• values: An array of values.
• length: The number of past values to consider.
• Return Value : The first non-NA value found or na if no valid value is found.
• Functionality : Iterates through the specified number of past values and returns the first non-NA value.
2 — calculate_institutional_and_short_term_signals(low, close, open, volume)
• Purpose : Calculates the institutional and short-term investor signals based on price, volume, and moving average data.
• Parameters :
• low: Low price series.
• close: Close price series.
• open: Open price series.
• volume: Volume series.
• Return Values :
• institutional_signal: The institutional signal.
• institutional_build: The institutional build signal.
• short_term_investor_signal: The short-term investor signal.
• Functionality :
• Computes various price and volume metrics.
• Calculates moving averages and volume-weighted prices.
• Generates the institutional and short-term investor signals based on these metrics.
█ KEY POINTS AND TECHNIQUES
1 — Advanced Pine Script Features
• Custom Functions: The script defines and uses custom functions to encapsulate complex logic.
• Conditional Statements: Extensive use of iff and if statements to control the flow of calculations.
• Looping Constructs: The for loop in reference_value function to iterate through past values.
• Exponential Moving Averages (EMA): Used to smooth out price and signal changes.
• Volume-Weighted Price (VWP): Calculated to factor in volume in price analysis.
• Custom RSI Calculation: A custom RSI formula is used, which differs from the standard RSI calculation.
2 — Optimization Techniques
• Efficient Data Handling: The reference_value function efficiently finds the first non-NA value without unnecessary computations.
• Smoothed Signals: Using EMAs to smooth out noisy signals for better trend identification.
3 — Unique Approaches
• Combination of Metrics: The script combines multiple metrics (price, volume, moving averages, and custom RSI) to generate comprehensive signals.
• Institutional Build Signal: A unique approach to detect institutional activity by comparing current price levels with historical lows and smoothed price changes.
█ EXTENDED KNOWLEDGE AND APPLICATIONS
1 — Potential Modifications
• Input Parameters: Add input parameters to allow users to customize the lengths and thresholds used in the calculations.
• Strategy Version: Convert the indicator into a strategy by adding buy/sell signals based on the generated signals.
• Additional Indicators: Integrate other technical indicators (e.g., MACD, Bollinger Bands) to enhance the signal generation process.
2 — Similar Trading Scenarios
• Institutional Activity Analysis: Use similar techniques to analyze institutional activity in other markets or assets.
• Volume Analysis: Apply the volume-weighted price and volume analysis to identify significant price movements.
• Multi-Timeframe Analysis: Extend the script to analyze signals across multiple timeframes for a more robust trading strategy.
3 — Related Pine Script Concepts
• Pine Script Functions: Understanding how to define and use custom functions effectively.
• Conditional Logic: Mastering the use of iff and if statements for complex logic.
• Looping Constructs: Familiarity with for loops for iterating through data.
• Moving Averages: Knowledge of different types of moving averages and their applications.
• Volume Analysis: Techniques for incorporating volume data into price analysis.
InspireHER Dynamic EMA RR Positioning IndicatorDynamic EMA and RR Positioning Indicator
This indicator is designed to provide traders with highly customizable buy and sell signals based on EMA (Exponential Moving Average) crossovers and Risk-to-Reward (RR) ratios. It works on any timeframe and allows users to toggle price data and additional position boxes for visualizing trade setups. Additionally, traders can choose between displaying dots or labeled signals for buy/sell indicators, making this tool versatile and user-friendly for different preferences and strategies.
What Makes This Indicator Unique
Customizable Parameters: The script offers extensive options for tailoring the indicator to your preferred trading style and strategy:
EMA: Configurable through settings (default is a 21-period EMA).
Risk-to-Reward Ratio (RR): Adjustable to meet your desired RR levels (default is 1:2.5).
Lookback Period: Visualizes buy/sell signals over the last six months.
Position Boxes for Trade Visualization: The indicator can "draw" position boxes on the chart, showing potential entry points, stop-loss (SL), and take-profit (TP) levels based on the selected RR. These visual aids simplify decision-making and help evaluate trade opportunities directly on the chart.
Price Data Toggle: Traders can choose to view or hide price data related to trade signals, including TP, SL, and RR values. By default, this is turned off to maintain a clean chart but can be activated when needed.
Flexible Signal Display Options:
Dots Mode: Displays buy signals as green dots and sell signals as red dots on the chart.
Label Mode: Displays buy signals as labels with the word "Buy" in green and sell signals as labels with the word "Sell" in red.
This toggle allows traders to customize how signals are displayed for a more personalized trading experience.
Simple Signal View: A toggle option provides a cleaner chart by enabling or disabling additional visual elements like circles or labels.
How It Works
Buy Signal: Triggered when the price crosses the EMA and closes above it.
Entry: Top of the candle.
Stop-Loss: Bottom of the candle.
Take-Profit: Calculated based on the selected RR.
Sell Signal: Triggered when the price crosses the EMA and closes below it.
Entry: Bottom of the candle.
Stop-Loss: Top of the candle.
Take-Profit: Calculated based on the selected RR.
Default Settings
EMA: 21-period.
Risk-to-Reward Ratio: 1:2.5.
Price Data: Off (can be toggled on in settings).
Position Boxes: Off (can be toggled on in settings).
Signal Display: Labels mode with "Buy" (green) and "Sell" (red) enabled by default; can be toggled to Dots mode.
Timeframe: Any timeframe supported.
How to Use
Add the Indicator to Your Chart: Once applied, the EMA line and buy/sell signals will appear by default.
Customize Settings: Navigate to the indicator's settings to adjust EMA, RR, or enable/disable Price Data, Position Boxes, or switch between Dots and Label modes.
Trade with Confidence: Use the visual aids and signals to assess trade opportunities based on your strategy and timeframe.
This indicator combines the reliability of EMA-based signals with the flexibility of configurable RR, visual trade setups, and multiple signal display options, making it a powerful tool for all types of traders. Happy Trading!!

Loacally Weighted MA (LWMA) Direction HistogramThe Locally Weighted Moving Average (LWMA) Direction Histogram indicator is designed to provide traders with a visual representation of the price momentum and trend direction. This Pine Script, written in version 6, calculates an LWMA by assigning higher weights to recent data points, emphasizing the most current market movements. The script incorporates user-defined input parameters, such as the LWMA length and a direction lookback period, making it flexible to adapt to various trading strategies and preferences.
The histogram visually represents the difference between the current LWMA and a previous LWMA value (based on the lookback period). Positive values are colored blue, indicating upward momentum, while negative values are yellow, signaling downward movement. Additionally, the script colors candlesticks according to the histogram's value, enhancing clarity for users analyzing market trends. The LWMA line itself is plotted on the chart but hidden by default, enabling traders to toggle its visibility as needed. This blend of histogram and candlestick visualization offers a comprehensive tool for identifying shifts in momentum and potential trading opportunities.

MS + ZigZag [TradingFinder] CHoCH/BOS - MSS/MSB+7_EMAThis is edited from Market structure Zigzag TradingFinder by Add more 7 EMAs to chart.
You can edit or change EMAs value or any.

VuTu HalfTrend + Tma indicator Indicator chỉ là 1 công cụ hỗ trợ giống như là thêm 1 chiếc bút chì trong hộp màu của bạn. Hãy tự do sáng tạo và kết hợp để phù hợp nhất cho bản thân và tối ưu chiến lược của mình.ggwp
This indicator is a cool combo of the half-trend methodology and TMA Centered Bands. The main idea is to help spot where the market is trending and where it might be reversing by using a mix of moving averages and the highest and lowest price data values.

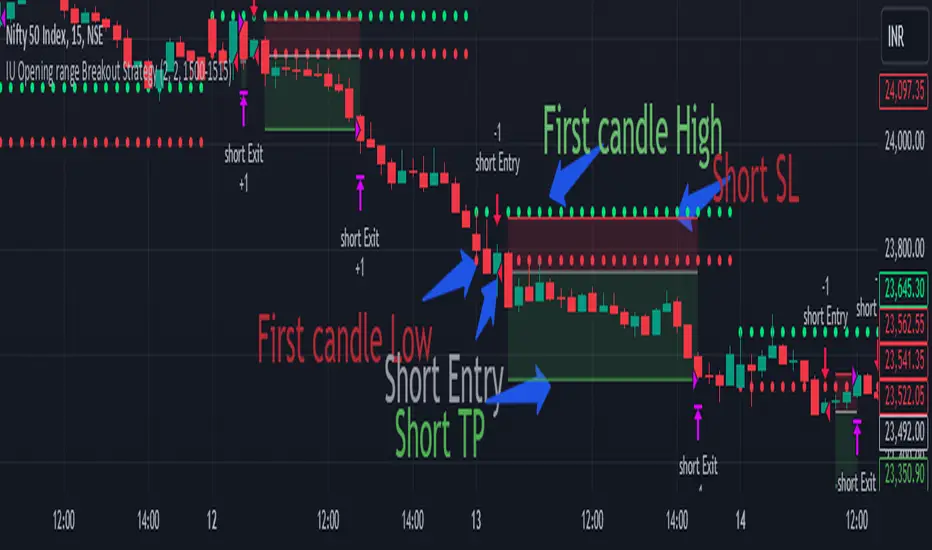
IU Opening range Breakout StrategyIU Opening Range Breakout Strategy
This Pine Script strategy is designed to capitalize on the breakout of the opening range, which is a popular trading approach. The strategy identifies the high and low prices of the opening session and takes trades based on price crossing these levels, with built-in risk management and trade limits for intraday trading.
Key Features:
1. Risk Management:
- Risk-to-Reward Ratio (RTR):
Set a customizable risk-to-reward ratio to calculate target prices based on stop-loss levels.
Default: 2:1
- Max Trades in a Day:
Specify the maximum number of trades allowed per day to avoid overtrading.
Default: 2 trades in a day.
- End-of-Day Close:
Automatically closes all open positions at a user-defined session end time to ensure no overnight exposure.
Default: 3:15 PM
2. Opening Range Identification
- Opening Range High and Low:
The script detects the high and low of the first trading session using Pine Script's session functions.
These levels are plotted as visual guides on the chart:
- High: Lime-colored circles.
- Low: Red-colored circles.
3. Trade Entry Logic
- Long Entry:
A long trade is triggered when the price closes above the opening range high.
- Entry condition: Crossover of the price above the opening range high.
-Short Entry:
A short trade is triggered when the price closes below the opening range low.
- Entry condition: Crossunder of the price below the opening range low.
Both entries are conditional on the absence of an existing position.
4. Stop Loss and Take Profit
- Long Position:
- Stop Loss: Previous candle's low.
- Take Profit: Calculated based on the RTR.
- **Short Position:**
- **Stop Loss:** Previous candle's high.
- **Take Profit:** Calculated based on the RTR.
The strategy plots these levels for visual reference:
- Stop Loss: Red dashed lines.
- Take Profit: Green dashed lines.
5. Visual Enhancements
-Trade Level Highlighting:
The script dynamically shades the areas between the entry price and SL/TP levels:
- Red shading for the stop-loss region.
- Green shading for the take-profit region.
- Entry Price Line:
A silver-colored line marks the average entry price for active trades.
How to Use:
1.Input Configuration:
Adjust the Risk-to-Reward ratio, max trades per day, and session end time to suit your trading preferences.
2.Visual Cues:
Use the opening range high/low lines and shading to identify potential breakout opportunities.
3.Execution:
The strategy will automatically enter and exit trades based on the conditions. Review the plotted SL and TP levels to monitor the risk-reward setup.
Important Notes:
- This strategy is designed for intraday trading and works best in markets with high volatility during the opening session.
- Backtest the strategy on your preferred market and timeframe to ensure compatibility.
- Proper risk management and position sizing are essential when using this strategy in live markets.
Stochastic RSI (Stokastik RSI) 0-100 ALARMİngilizce
This script calculates and visualizes the Stochastic RSI indicator on a chart, commonly used for identifying overbought or oversold conditions.
Inputs: Users can adjust RSI length, smoothing values (K and D), and the source of the RSI (e.g., closing price).
Plots: The %K and %D lines are displayed, alongside horizontal bands (0, 20, 50, 80, 100) for easier visualization of important levels.
Alerts: Alerts are triggered when %K crosses specific levels (20, 50, 80), or when it hits extreme zones (0 or 100).
Türkçe
Bu kod, bir grafikte Stokastik RSI göstergesini hesaplar ve görselleştirir. Genellikle aşırı alım veya aşırı satım koşullarını tespit etmek için kullanılır.
Girdiler: Kullanıcılar, RSI uzunluğunu, yumuşatma değerlerini (K ve D) ve RSI kaynağını (ör. kapanış fiyatı) ayarlayabilir.
Çizimler: %K ve %D çizgileri, önemli seviyelerin (0, 20, 50, 80, 100) kolayca görülebilmesi için yatay bantlarla birlikte gösterilir.
Alarmlar: %K belirli seviyeleri geçtiğinde (20, 50, 80) veya ekstrem bölgelerde (0 veya 100) olduğunda alarmlar tetiklenir.

Key LevelsKey Levels Indicator
In the world of trading, manually identifying and plotting key levels for every close can be a tedious and error-prone task. This indicator stands out by automatically detecting and plotting only those levels where a significant shift in market sentiment has occurred. Unlike traditional indicators that plot lines for every open or close, this tool focuses on levels where liquidity has changed hands, indicating a potential shift in momentum.
How It Works:
- The indicator identifies Higher Timeframe (HTF) reversals, plotting levels only when a bearish candle is followed by a bullish one, or vice versa.
- Weekly levels are represented by dashed lines, while monthly levels are solid, providing clear visual differentiation.
- Levels are drawn at the open price of the reversal candle, starting precisely at the beginning of the new HTF bar.
Why It's Different:
- Focuses on genuine shifts in market sentiment rather than arbitrary price points.
- Automatically manages the number of visible levels to prevent chart clutter.
- Ideal for range traders and mean reversion strategies, offering insights into potential support and resistance zones where market participants have shown a change in behavior.
Usage Note:
While this indicator provides valuable insights, it should not be used in isolation. Always consider the broader market context and combine it with other analysis techniques for optimal results.
Settings:
- Toggle weekly/monthly levels
- Adjust the number of visible levels (1-20)
- Customize level colors

High/Mid/Low of the Previous Month, Week and Day + MAIntroducing the Ultimate Price Action Indicator
Take your trading to the next level with this feature-packed indicators. Designed to provide key price insights, this tool offers:
- Monthly, Weekly, and Daily Levels : Displays the High, Midpoint, and Low of the previous month, week, and day.
- Logarithmic Price Lines : Option to plot price levels logarithmically for enhanced accuracy.
- Customizable Labels : Display labels on price lines for better clarity. (This feature is optional.)
- Dual Moving Averages : Add two customizable Moving Averages (Simple, Exponential, or Weighted) directly on the price chart. (This feature is optional.)
This code combines features from the Moving Average Exponential and Daily Weekly Monthly Highs & Lows (sbtnc) indicators, with custom modifications to implement unique personal ideas.
Perfect for traders who want to combine precision with simplicity. Whether you're analyzing historical levels or integrating moving averages into your strategy, this indicator provides everything you need for informed decision-making.
To prevent change chart scale, right click on Price Scale and enable "Scale price chart only"

Kernel Regression Envelope with SMI OscillatorThis script combines kernel regression, envelope calculations, and the Stochastic Momentum Index (SMI) to generate trading signals. It uses a Nadaraya-Watson estimator with a Rational Quadratic kernel to model price trends, constructs an envelope around the estimated trend using Average True Range (ATR), and utilizes the SMI to identify potential overbought/oversold conditions for entry and exit points.
Strategy Logic:
Kernel Regression:
The script employs the Nadaraya-Watson estimator, a non-parametric regression technique, to estimate the underlying trend of the price.
It utilizes the Rational Quadratic kernel function, which allows for flexible weighting of past data points based on their distance in time.
The h parameter controls the lookback window (number of bars used for estimation), alpha determines the relative weighting of time frames, and x_0 sets the starting bar for regression.
Envelope Calculation:
An envelope is created around the estimated trend (yhat_close) to define potential support and resistance levels.
The envelope's boundaries are calculated using a multiple of the ATR, which measures market volatility.
nearFactor and farFactor control the width of the envelope, creating near and far boundaries.
Smoothing:
The script includes an option to smooth the SMA output using various moving average types (SMA, EMA, SMMA, WMA, VWMA).
This smoothing helps to filter out noise and provide a clearer trend signal.
Stochastic Momentum Index (SMI):
The SMI is used as a momentum oscillator to identify potential overbought and oversold conditions.
It measures the distance of the current close relative to the midpoint of the high-low range over a specified period.
Crossovers between the SMI and its EMA signal potential trend reversals.
Entry and Exit Conditions:
Long Entry: A long position is entered when the smoothing line is below the lower far boundary of the envelope, the SMI crosses above its EMA, and the SMI is below -50 (indicating oversold conditions).
Short Entry: A short position is entered when the smoothing line is above the upper far boundary of the envelope, the SMI crosses below its EMA, and the SMI is above 50 (indicating overbought conditions).
Long Exit: A long position is closed when the price crosses above the upper far boundary.
Short Exit: A short position is closed when the price crosses below the lower far boundary.
Stop Loss: A stop loss is set at a user-defined number of ticks below the entry price for long positions and above the entry price for short positions.
Customization:
The script offers extensive customization options, including:
Kernel parameters (lookback window, relative weighting, starting bar)
Envelope parameters (ATR length, near/far factors)
Smoothing method and length
SMI parameters (lengths for %K, %D, and EMA)
Timeframe for SMI calculation
Colors for plots and fills
Stop loss level
Disclaimer:
This script is for educational purposes and should not be considered financial advice. Backtesting and thorough analysis are recommended before using this strategy in live trading. The effectiveness of the strategy may vary depending on market conditions and the chosen parameters.
