Looking Very Strong For Longterm Investment 📊 Bannari Amman Sugars
✅ The stock has recently broken out above a massive 18-year-old resistance trendline, a highly significant technical event. This breakout from such a long-term resistance level indicates a major shift in sentiment and could lead to substantial upside as the stock enters a ne
Explore the community

Cigniti Technologies Ltd - Breakout Setup, Move is ON...#CIGNITITEC trading above Resistance of 1487
Next Resistance is at 1820
Support is at 1319
Here are previous charts:
Chart is self explanatory. Levels of breakout, possible up-moves (where stock may find resistances) and support (close below which, setup will be invalidated) are clearly de


SBI: Basement Bound? The Bank’s Bargain Hunt Continues!🐻 SBI: Basement Bound? The Bank’s Bargain Hunt Continues! 🛒
SBI is currently trading at 773, but it’s eyeing the escalator down, with potential stops at 744, 714, 692, and if we really squint, 592! It’s as if SBI’s on a mission to explore every floor in the discount department. 📉
With a series of l


Tight Range Breakout | MFSLFor Education Purpose only!!!!
**MFSL stock is already up by 3%, but it’s holding up well in this falling market. I'm charting this stock just for my own perspective and clarity, though I may not be 100% accurate.**
FIIs are playing their old trick:
1️⃣ Push prices down 📉
2️⃣ Buy cheap stocks 💰

AFFORDABLE - Cup and Handle - Breakout - DailyThe chart you provided shows a **Cup and Handle** pattern in the stock **Affordable Robotic & Automation Ltd (BSE)**, which is a bullish continuation pattern typically suggesting the potential for a significant upward breakout once confirmed.
### Key Insights:
1. **Cup and Handle Formation**:
-

INDIAGO PAINT ready to touch IPO price 1 as 11 risk reward ratioINDIGO PAINT has give long 2 and half year consolidation break out.
Stock as has been down trend its listed on Feb 2021
Stock has give rounding bottom pattern breakout and multiple pattern at lower time frame.
*POSTIONAL TRADE*
Buy INDIGO PAINTS
At 1650 50% quantities, 50% between 1600-1625
Stop

See all editors' picks ideas
5 Important Lessons to Learn From the MarketsYou Can Never Outsmart the Market
Detailed analysis 🧐and strategies are not enough to survive in the market. There are several other economic or geo-political factors that may influence the movement of the market. If market is flying higher due to positive factors, there is no point in going rever

Combining Fundamental & technical Analysis to pick great stocksHello,
One of the most often asked question is how I conduct my market research and today I will be trying to answer the question in a simple way. Below is my process flow
1: Screening Potential Stocks
Purpose: Narrow down the list of stocks to focus on those that meet specific criteria.
Method

Understanding the Cup and Handle Formation in Technical AnalysisThe Cup and Handle pattern is one of the most well-known and reliable chart patterns used by traders to predict bullish continuations. Understanding this formation can give you a valuable edge in identifying potential breakout stocks.
What is the Cup and Handle Pattern?
The Cup and Handle is a b

A simple guide to coming up with an investment OpportunityHello,
1. Understand the Business
Before committing your money to any investment, the first and most crucial step is to thoroughly understand the company you’re considering. Below are some of the things you carefully need to look at.
Business Model: Start by breaking down the company’s business mo

What is Opening Range Breakout (ORB)Hello mates today i want to share an Educational post about Opening range breakout a very common and old strategy used by many traders and it's still pretty effective. I hope you will read the complete post and like my publication too friends.
So let's understand about Opening Range Breakout below-

DIVISLAB and ONGC showing high rise in Future OIDIVISLAB
The price has been consolidating in a narrow range for more than a year.
Recently, the price successfully surpassed its resistance level.
Since the breakout, the price has maintained above the breakout point and is steadily increasing.
The current RSI is above 60, suggesting strong

Trading Vs InvestingTrading and investing are two distinct approaches to engaging with financial markets, each with its own strategies, goals, and risk profiles. Here’s a comparison to help differentiate between the two:
Trading
Definition:
Trading involves the frequent buying and selling of financial instruments, suc

Linear Vs Logarithmic Chart. Which one to use ?NSE:ADANIENT
Hello, Traders! 👋
I hope you’re all having a fantastic weekend! 🌟 Whether you’re sipping coffee, analyzing charts, or just enjoying some downtime, let’s make it even more productive. 📈💡
In today’s educational post, we’ll explore a concept that might have slipped under your radar or

⭐️⭐️Leading V/S Lagging Indicators⭐️⭐️What is a leading indicator?
A leading indicator in trading is a tool or metric used to predict future price movements in financial markets. These indicators provide signals about potential price changes before the new trend or reversal occurs, allowing traders to make informed decisions ahead of ti

SPARC - BO FAIL, IMPORTANT RISK MANAGEMENT LESSONHello Community,
today i will talk about the importance of risk management in stock market, why its important to respect risk in stock market with proper stoploss method you should have as per your risk apetite with example. We have talked much about the BO stocks which had made good money for us b

See all editors' picks ideas


You can take a long trade in HDFC BankCompany:- HDFC Bank Ltd.
Sector:- Banking
M Cap:- 10.99T
Technical:- On the hourly and daily chart smart money formed semetric triangle chart pattern and breakout it with heavy volume, I thik this stock is bottoming out and ready for the next leg rally. One more thing Nifty private banking and nift


See all editors' picks ideas
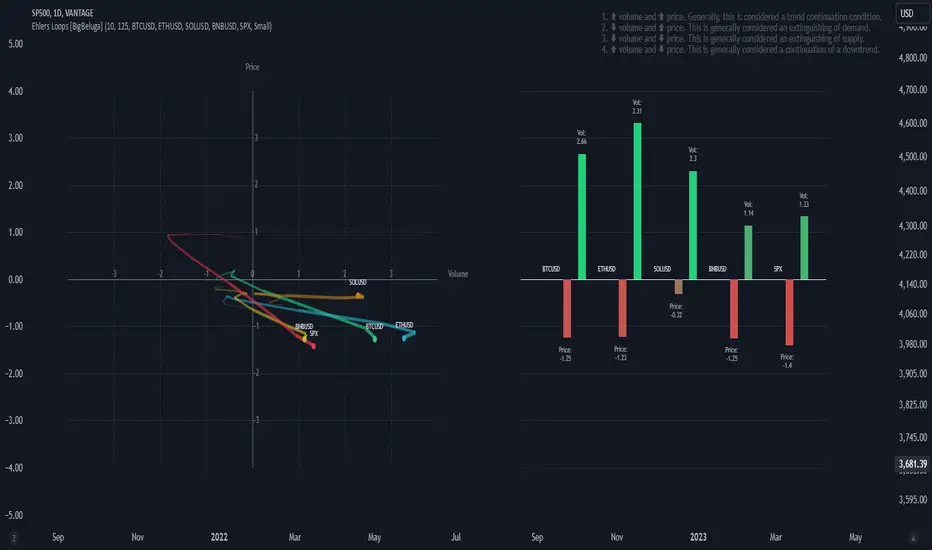
Ehlers Loops [BigBeluga]The Ehlers Loops indicator is based on the concepts developed by John F. Ehlers, which provide a visual representation of the relationship between price and volume dynamics. This tool helps traders predict future market movements by observing how price and volume data interact within four distinct
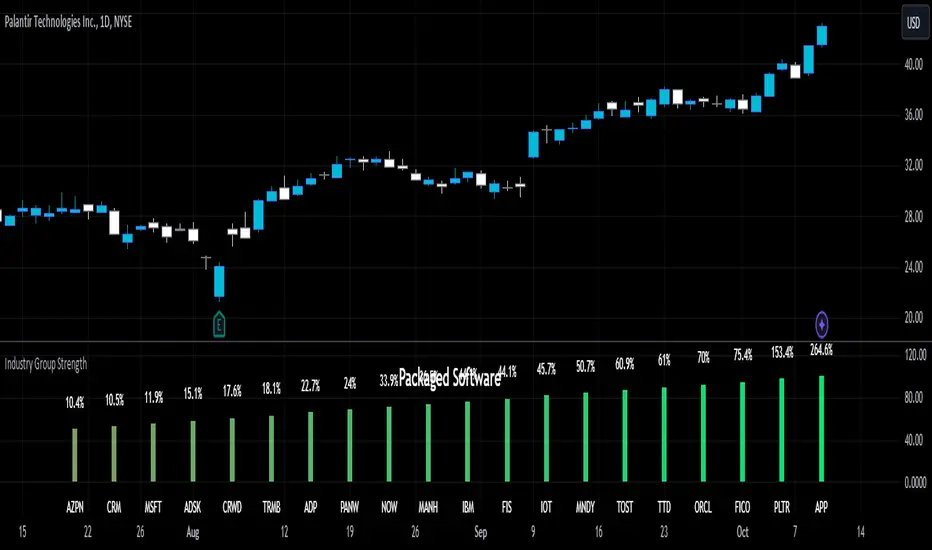
Industry Group StrengthThe Industry Group Strength indicator is designed to help traders identify the best-performing stocks within specific industry groups. The movement of individual stocks is often closely tied to the overall performance of their industry. By focusing on industry groups, this indicator allows you to
Periodic Linear Regressions [LuxAlgo]The Periodic Linear Regressions (PLR) indicator calculates linear regressions periodically (similar to the VWAP indicator) based on a user-set period (anchor).
This allows for estimating underlying trends in the price, as well as providing potential supports/resistances.
🔶 USAGE
The Period

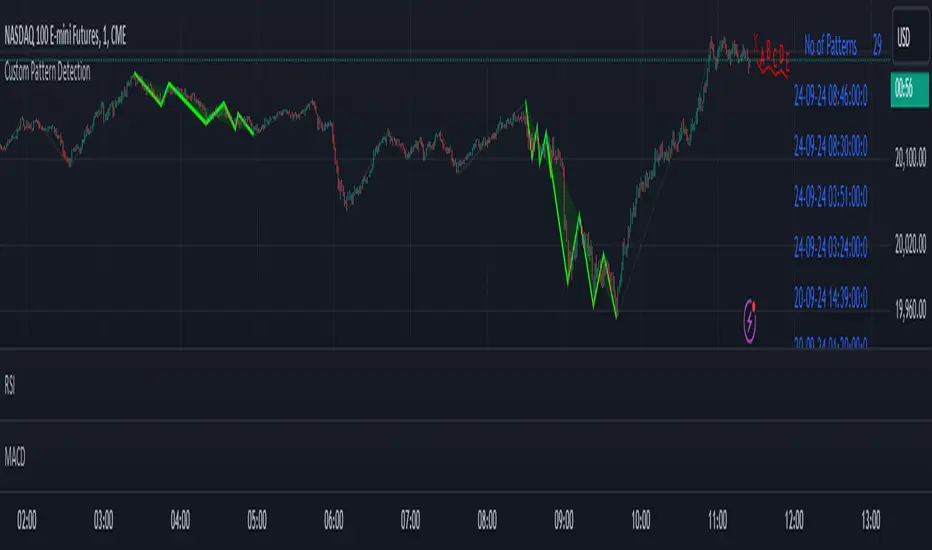
Custom Pattern DetectionOverview
Chart Patterns is a major tool for many traders. Pattern formation at specific location on the chart is used for investment/trading decisions.
This indicator is designed in a way to allow investors/traders to define patterns of their choice based on certain input parameters and then detec
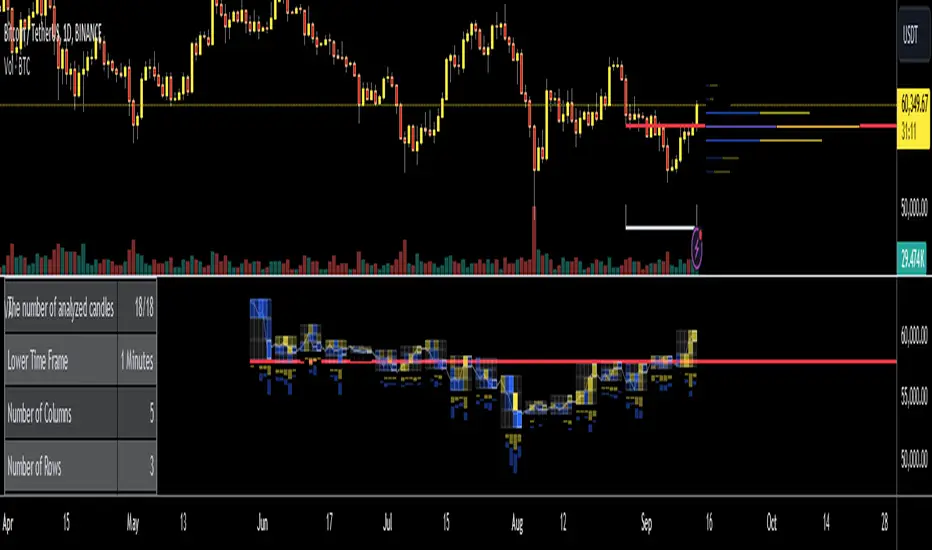
Volume Analysis - Heatmap and Volume ProfileHello All!
I have a new toy for you! Volume Analysis - Heatmap and Volume Profile . Honestly I started to work to develop Volume Heatmap then I decided to improve it and add more features such Volume profile, volume, difference in Buy/Sell volumes etc. I tried to put my abilities into this script
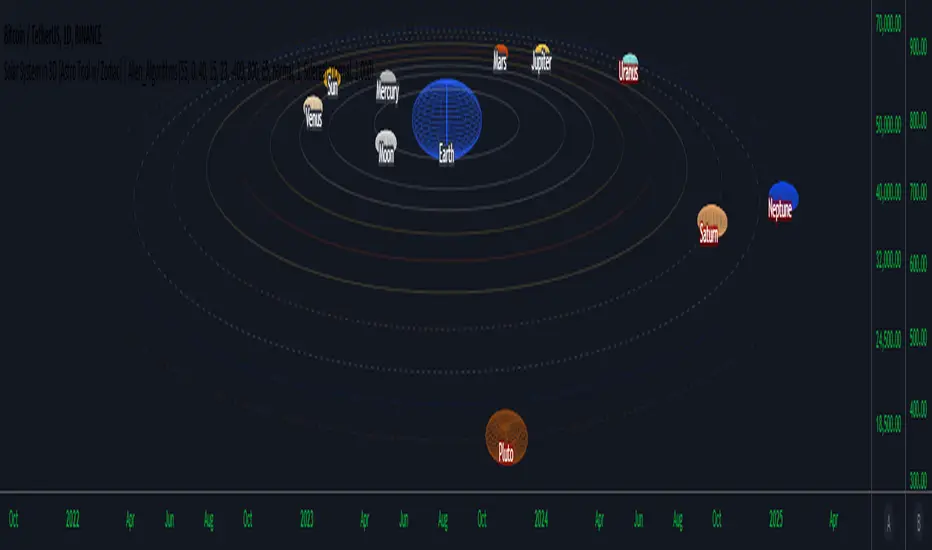
Solar System in 3D [Astro Tool w/ Zodiac]Hello Traders and Developers,
I am excited to announce my latest Open Source indicator. At the core, this is a demonstration of PineScript’s capabilities in Rendering 3D Animations, while at the same time being a practical tool for Financial Astrologists.
This 3D Engine dynamically renders all th
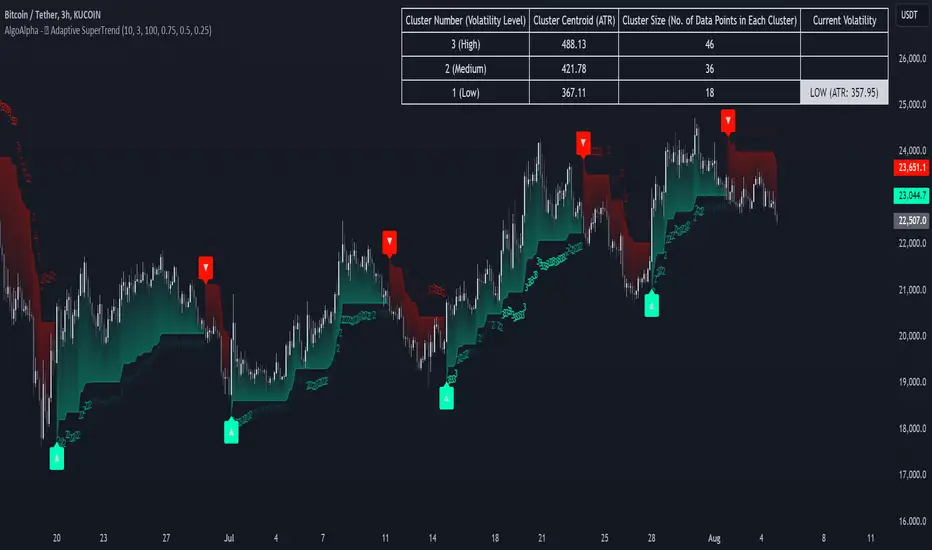
Machine Learning Adaptive SuperTrend [AlgoAlpha]📈🤖 Machine Learning Adaptive SuperTrend - Take Your Trading to the Next Level! 🚀✨
Introducing the Machine Learning Adaptive SuperTrend , an advanced trading indicator designed to adapt to market volatility dynamically using machine learning techniques. This indicator employs k-means clustering
D-Shape Breakout Signals [LuxAlgo]The D-Shape Breakout Signals indicator uses a unique and novel technique to provide support/resistance curves, a trailing stop loss line, and visual breakout signals from semi-circular shapes.
🔶 USAGE
D-shape is a new concept where the distance between two Swing points is used to creat

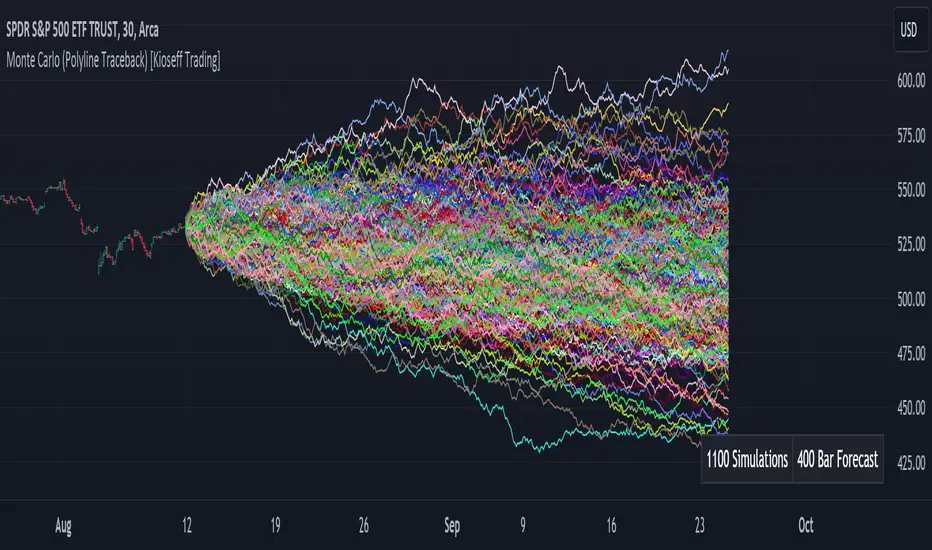
Monte Carlo (Polyline Traceback) [Kioseff Trading]Hello!
This script "Monte Carlo (Polyline Traceback) " performs a Monte Carlo simulation using polylines!
By using polylines, and tracing back the initial simulation to its origin point, we can better replicate the ideal output of a Monte Carlo simulation!
Such as:
The image above shows the
See all editors' picks scripts