MFSL - WolfeWave is activeCMP: 1115
The visible target is sub 900 levels.. lets see if the market acts as per the WW set up on this.
I have recently published a similar IDEA on HAL
Next report date
—
Report period
—
EPS estimate
—
Revenue estimate
—
10.05 INR
3.40 B INR
393.00 B INR
255.94 M
About MAX FINANCIAL SERV LTD
Sector
Industry
Headquarters
Noida
Website
Founded
1988
ISIN
INE180A01020
FIGI
BBG000CW83C7
Max Financial Services Ltd. operates as a holding company. The firm engages in the provision of advisory services. It operates through the following segments: Business Investments, Life Insurance and others. The Business Investments segment deals with treasury investments. The Life Insurance segment offers private life insurance products and services. The company was founded by Analjit Singh on February 24, 1988 and is headquartered in Noida, India.

VIEW ON MFSLBreakout on the stock
But buy only above 1240
Target 1300
Stop loss 1210
I am just representing my views
For educational purpose only.

MFSL Short Term TradeThe stock has been in an overall uptrend since five months
It has also shown higher highs and higher lows since then
Currently, a rising wedge pattern breakout is visible on the chart
On the breakout, a rise is visible in the volume and atr
Thus, there is a short term trade
tgt 1354, sl 1220

MFSL Major Breakout with Volume Surging NSE:MFSL Breaking Out Major Levels with Big Volume Surge on Hourly TF.
Trade Plan:
Entry: On Retracement Near 20 EMA or Breakout of Swing High 1300.
Stop Loss: Entry Candle Low.
No Trade: if Below 1200.
🙋♀️🙋♂️If you have any questions about this stock, feel free to reach out to me.
📍📌T

Tight Range Breakout | MFSLFor Education Purpose only!!!!
**MFSL stock is already up by 3%, but it’s holding up well in this falling market. I'm charting this stock just for my own perspective and clarity, though I may not be 100% accurate.**
FIIs are playing their old trick:
1️⃣ Push prices down 📉
2️⃣ Buy cheap stocks 💰

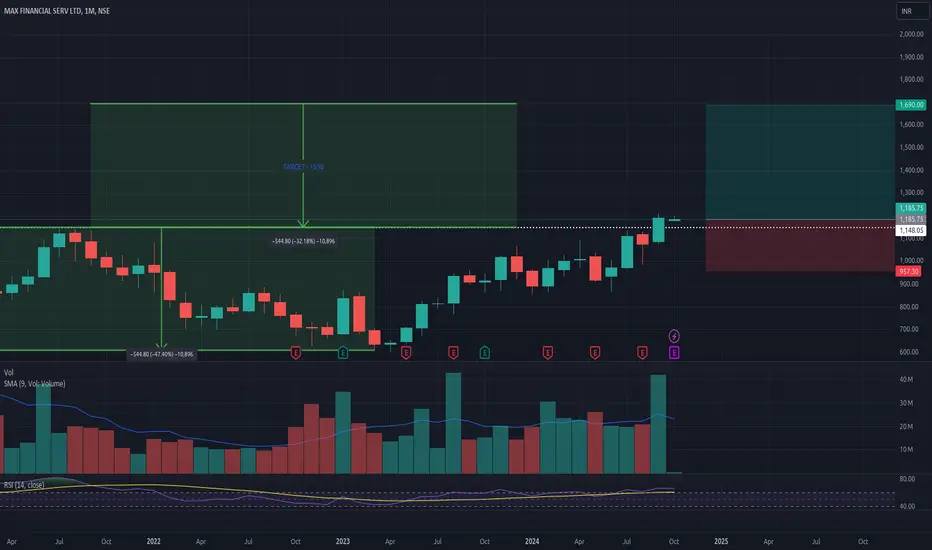
MFSL: Multi-Year Breakout: Monthly Timeframe: Oct 24MFSL: Multi-Year Breakout: Monthly Timeframe: Oct 24
Stock broke the high it made in Jul'21 in Sep'24. A multi-year breakout on a monthly time frame
RSI is just above 60 - Indicating good buy demand
Breakout in Sep happened with above average trade volume (9 SMA)
Entry and y'day 01-Oct clo
MFSL looking good on a monthly timeframeMFSL has given a breakout at 1150 on a weekly timeframe. Upside potential: 30-40%. Stop loss: 1120. This is not a buy/sell recommendation. Research carefully and invest at your own risk

MFSLENTRY TARGET SL Mention in the chart.
ALWAYS TAKE TRADE WITH CONFIRMATION
Note : Trading in any financial market is very risky. I post ideas for educational purpose only. It is not financial advice. Do not hold us responsible for any potential loss you may incur. Please consult your financial advise

MFSL Cmp 1159 Cup Pattern BO with VolumesMFSL Cmp 1159 dated 21-9-2024
(Weekly Chart) Positional
1. Cup Pattern BO @ 1150 (done)
2. Volumes
Buy above 1170 dips till 1100 target 1200-1250-1300-1350-1400-1450-1500 SL 1040
Pattern target 1700 SL 1000
It is just a view, please trade at your own risk.

MFSL - IS IT READY FOR BREAKOUT ?
MFSL reached the same price level of Aug 2021 ( WEEKLY chart )
So is this stock ready for a breakout within next 1 week ?
Lets analyze the stock in VCP perspective
The Volatility Contraction Pattern (VCP) is a technical chart pattern often used in share trading to identify stock

See all ideas
An aggregate view of professional's ratings.
Displays a symbol's price movements over previous years to identify recurring trends.
Frequently Asked Questions
The current price of MFSL is 1,144.90 INR — it has decreased by −1.75% in the past 24 hours. Watch MAX FINANCIAL SERV LTD stock price performance more closely on the chart.
Depending on the exchange, the stock ticker may vary. For instance, on NSE exchange MAX FINANCIAL SERV LTD stocks are traded under the ticker MFSL.
MFSL stock has risen by 0.03% compared to the previous week, the month change is a −6.06% fall, over the last year MAX FINANCIAL SERV LTD has showed a 9.99% increase.
We've gathered analysts' opinions on MAX FINANCIAL SERV LTD future price: according to them, MFSL price has a max estimate of 1,660.00 INR and a min estimate of 1,240.00 INR. Watch MFSL chart and read a more detailed MAX FINANCIAL SERV LTD stock forecast: see what analysts think of MAX FINANCIAL SERV LTD and suggest that you do with its stocks.
MFSL reached its all-time high on Oct 25, 2024 with the price of 1,306.45 INR, and its all-time low was 80.00 INR and was reached on Oct 24, 2008. View more price dynamics on MFSL chart.
See other stocks reaching their highest and lowest prices.
See other stocks reaching their highest and lowest prices.
MFSL stock is 2.89% volatile and has beta coefficient of 0.09. Track MAX FINANCIAL SERV LTD stock price on the chart and check out the list of the most volatile stocks — is MAX FINANCIAL SERV LTD there?
Today MAX FINANCIAL SERV LTD has the market capitalization of 401.94 B, it has increased by 4.24% over the last week.
Yes, you can track MAX FINANCIAL SERV LTD financials in yearly and quarterly reports right on TradingView.
MAX FINANCIAL SERV LTD is going to release the next earnings report on Feb 11, 2025. Keep track of upcoming events with our Earnings Calendar.
MFSL earnings for the last quarter are 3.42 INR per share, whereas the estimation was 3.46 INR resulting in a −1.14% surprise. The estimated earnings for the next quarter are 3.29 INR per share. See more details about MAX FINANCIAL SERV LTD earnings.
MAX FINANCIAL SERV LTD revenue for the last quarter amounts to 77.39 B INR, despite the estimated figure of 86.85 B INR. In the next quarter, revenue is expected to reach 84.70 B INR.
MFSL net income for the last quarter is 1.13 B INR, while the quarter before that showed 1.27 B INR of net income which accounts for −11.57% change. Track more MAX FINANCIAL SERV LTD financial stats to get the full picture.
No, MFSL doesn't pay any dividends to its shareholders. But don't worry, we've prepared a list of high-dividend stocks for you.
As of Dec 11, 2024, the company has 23.14 K employees. See our rating of the largest employees — is MAX FINANCIAL SERV LTD on this list?
EBITDA measures a company's operating performance, its growth signifies an improvement in the efficiency of a company. MAX FINANCIAL SERV LTD EBITDA is 7.04 B INR, and current EBITDA margin is 2.02%. See more stats in MAX FINANCIAL SERV LTD financial statements.
Like other stocks, MFSL shares are traded on stock exchanges, e.g. Nasdaq, Nyse, Euronext, and the easiest way to buy them is through an online stock broker. To do this, you need to open an account and follow a broker's procedures, then start trading. You can trade MAX FINANCIAL SERV LTD stock right from TradingView charts — choose your broker and connect to your account.
Investing in stocks requires a comprehensive research: you should carefully study all the available data, e.g. company's financials, related news, and its technical analysis. So MAX FINANCIAL SERV LTD technincal analysis shows the sell today, and its 1 week rating is buy. Since market conditions are prone to changes, it's worth looking a bit further into the future — according to the 1 month rating MAX FINANCIAL SERV LTD stock shows the buy signal. See more of MAX FINANCIAL SERV LTD technicals for a more comprehensive analysis.
If you're still not sure, try looking for inspiration in our curated watchlists.
If you're still not sure, try looking for inspiration in our curated watchlists.