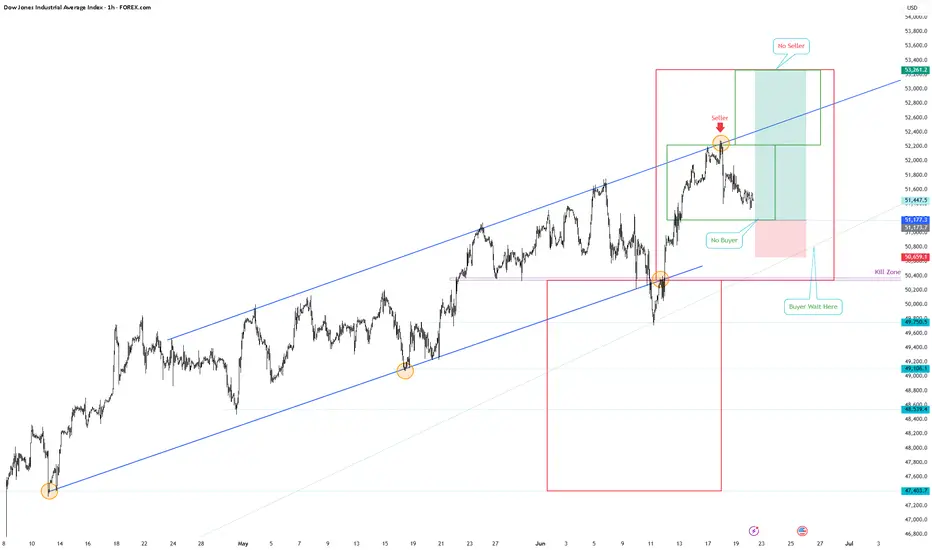
US30 Strategy: Channel Accumulation & Short Squeeze
1. Market Context
On the 1H chart of image, US30 is trading within a dominant ascending channel. After reclaiming the lower boundary from the pink "Kill Zone" (50,400), the price surged to the upper trendline resistance at 52,200 (marked "Seller") before entering a healthy corrective phase.
2. Se

The best trades require research, then commitment.
Get started for free$0 forever, no credit card needed
See our space storyWith astronaut Scott "Kidd" Poteet
Space mission
Where the world does markets
Join 100 million traders and investors taking the future into their own hands.
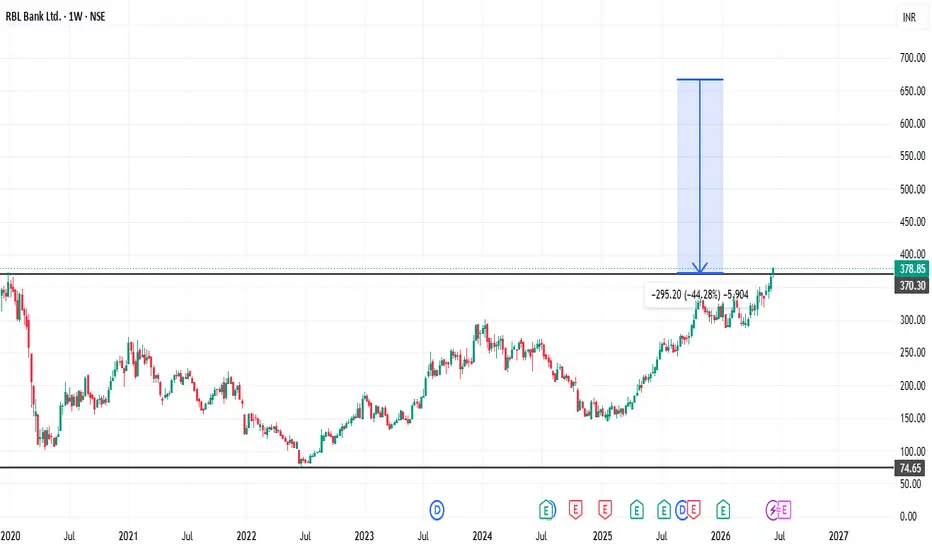
RBL Bank – Weekly Chart Breakout Setup📈 Subject: RBL Bank – Weekly Chart Breakout Setup 🚀
🟢 Strong Bullish Structure Emerging!
RBL Bank is trading near ₹378.85, gaining +3.55% on the weekly timeframe. 💪
Price is approaching a major resistance zone around ₹380–₹400, signaling a potential breakout. 🎯
A successful breakout above this zon
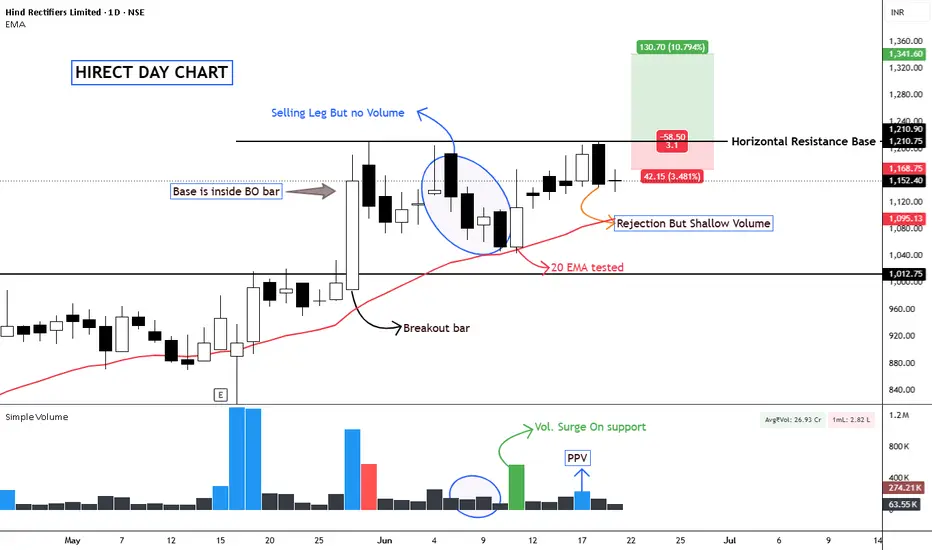
HIRECT – Holding Strong |Demand Building Near ResistanceNSE:HIRECT
After a powerful breakout from the ₹1010–1020 base, HIRECT has entered a healthy consolidation phase rather than a deep correction. The stock is currently building a new base just below the key resistance zone around ₹1210.
What makes this setup interesting is the quality of the pullba
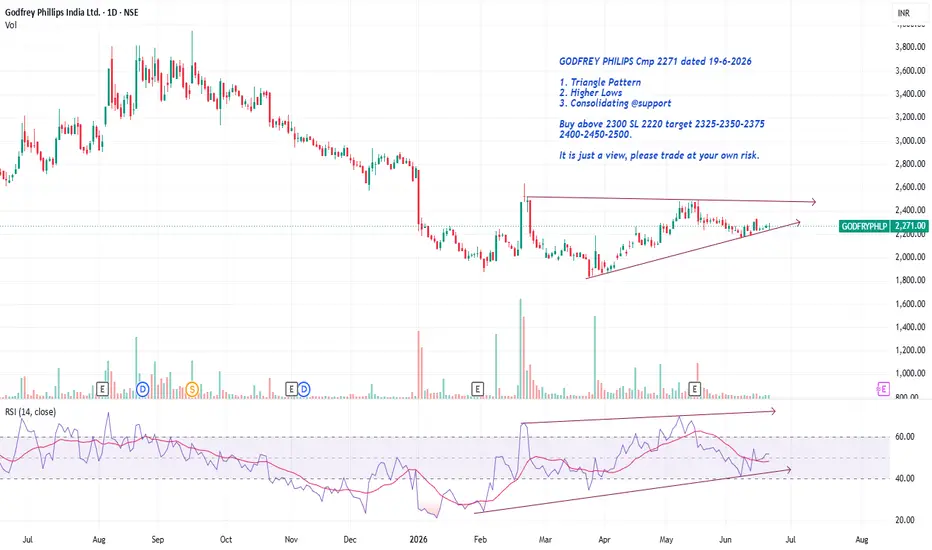
GODFREY PHILIPS Cmp 2271 dated 19-6-2026 Higher LowsGODFREY PHILIPS Cmp 2271 dated 19-6-2026
1. Triangle Pattern
2. Higher Lows
3. Consolidating @support
Buy above 2300 SL 2220 target 2325-2350-2375
2400-2450-2500.
It is just a view, please trade at your own risk.
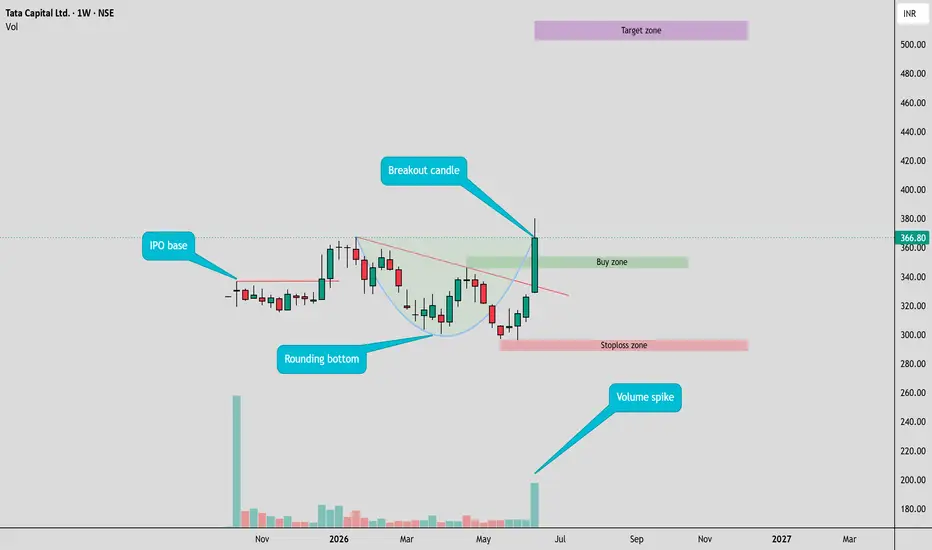
Swing Trade Setup - TATACAP - June 2026TATACAP Swing Trade Setup
IPO base breakout followed by a healthy consolidation phase.
Price formed a rounding bottom and broke above the descending trendline with strong volume participation.
The setup becomes attractive if price retests and holds the breakout area.
📍 Entry: On successful retest
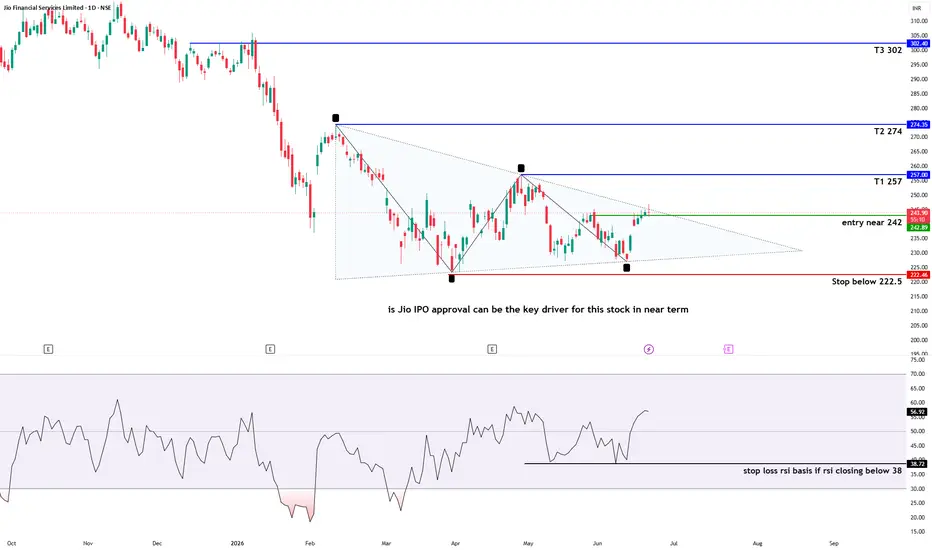
Jio Financial – Symmetrical Triangle Breakout SetupJIOFIN appears to be forming a constructive base after a prolonged correction from the higher levels. Price action over the last few months has developed into a symmetrical triangle consolidation, indicating compression of volatility and a potential expansion move ahead.
Technical Structure
The sto
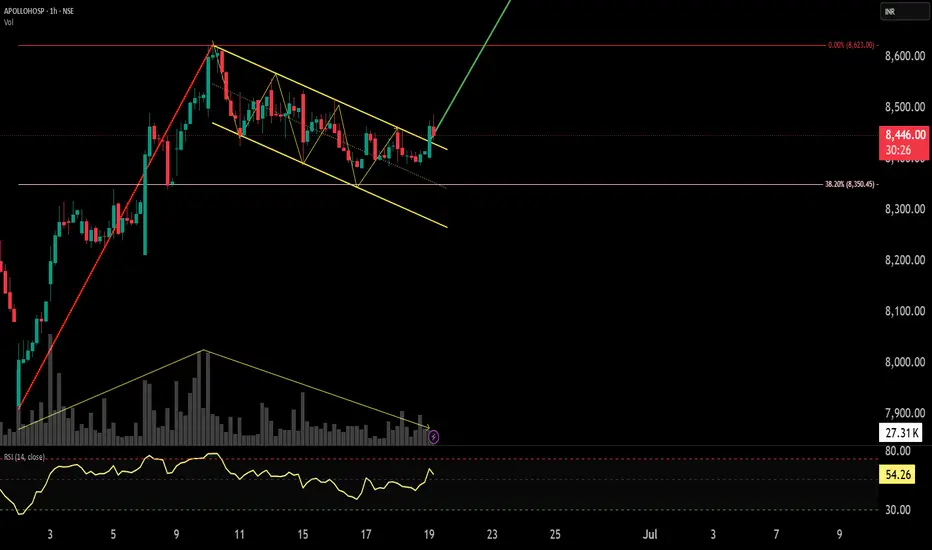
Apollo Hospitals – Bullish Flag with PoleApollo Hospitals has successfully completed a Bullish Flag pattern, a classical continuation setup that usually forms after a strong impulsive rally.
The stock witnessed a sharp upside move forming the flag pole, followed by a controlled downward consolidation within a falling channel. The recent p
Classic Reversal Patterns: Inverted Head & Shoulder📈 Classic Reversal Patterns: Inverted Head & Shoulder
In technical analysis, an uptrend reflects higher highs and higher lows, showing sustained buyer strength. Recognizing continuation or reversal signals within this structure is vital for traders.
One of the most reliable reversal patterns is the
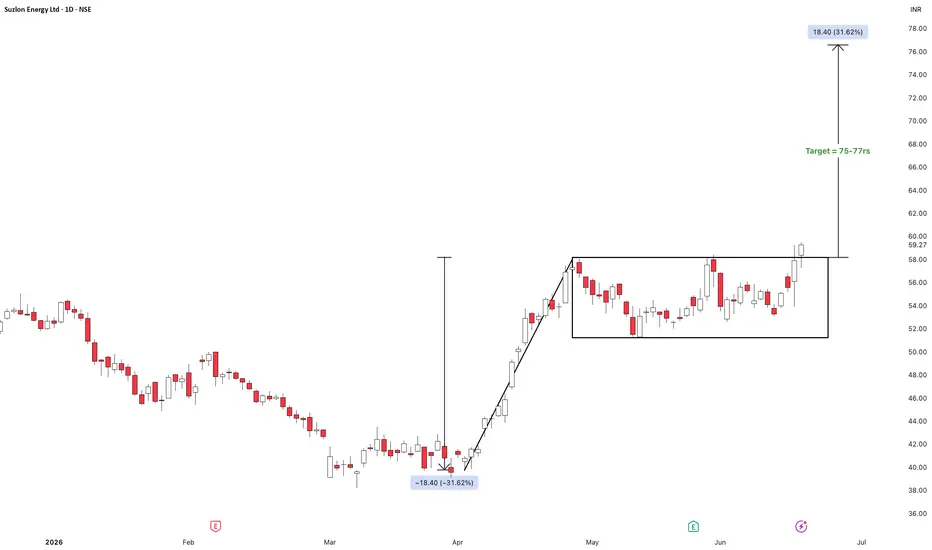
SUZLON ENERGY – Range Breakout in Progress📊 SUZLON ENERGY – Breakout Setup (Daily Timeframe)
Range Breakout in Progress
After a sharp recovery from the ₹40 zone, Suzlon consolidated for nearly two months between ₹52–58, allowing the previous rally to cool off and stronger hands to accumulate.
The stock is now attempting a breakout above
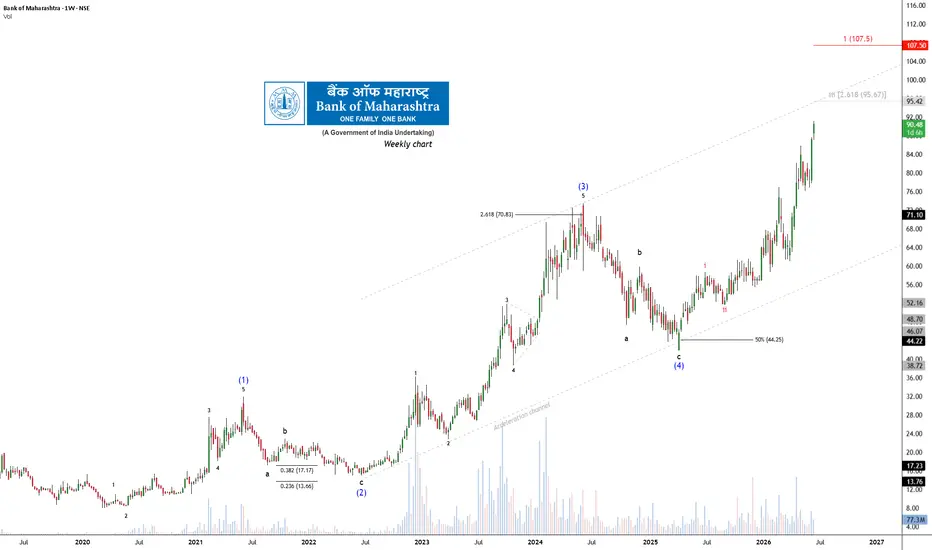
Bank of Maharashtra Shares Stay Strong: ₹107.5 Emerges as Key TPLong-term bullish structure remains intact
Bank of Maharashtra is trading in a long-term bullish trend.
Wave (3) ended near ₹71 after reaching the 2.618 Fibonacci extension of Wave (1).
Wave (4) completed an ABC correction and found support near ₹44 .
The stock is currently progressing
See all editors' picks ideas
Session Edge Profiler | Flux ChartsGENERAL OVERVIEW:
The Session Edge Profiler is a statistical dashboard indicator that profiles up to five configurable trading sessions (Asia, London, NY AM, NY Lunch, NY PM by default) across the available completed trading days loaded on the chart. The indicator records each session's range, volu
Pine Script® indicator

Supertrend Parameter Sensitivity 3D [LuxAlgo]The Supertrend Parameter Sensitivity 3D indicator is a powerful optimization tool that executes 100 simultaneous Supertrend backtests bar-by-bar to visualize how different ATR Lengths and Multipliers impact performance across various metrics.
By projecting this data onto a 3D surface and a heatm
Pine Script® indicator

ExprLibExprLib is a library for parsing and evaluating string expressions. It allows scripts to expose configurable logic by letting users define custom conditions and calculations based on available data.
█ KEY FEATURES
• Rich expression support:
• Built-in constants (e.g., `10`, `2.5`, `5e-2`,
Pine Script® library

Chart Patterns Screener [Trendoscope]🎲 Overview
Chart Patterns Screener is an advanced Pine Script designed to automatically detect and display classical chart patterns on TradingView. It is a specialized, fine-tuned version of the popular Auto Chart Patterns indicator, optimized specifically for use with the Pine Screener.
🎲 H
Pine Script® indicator

Machine Learning RSI | AI Classification & Ranking (Zeiierman)█ Overview
The Machine Learning RSI | AI Classification & Ranking (Zeiierman) is an adaptive RSI intelligence system that combines momentum analysis, historical analog recognition, machine learning classification, confidence scoring, and dynamic trend management into a single framework.
Rather
Pine Script® indicator

Polynomial/Linear Regression Volume Profile [BigBeluga]Polynomial/Linear Regression Volume Profile is a state-of-the-art charting framework that blends advanced statistical modeling with localized volume distribution analysis. By evolving past traditional, static horizontal volume profiles, this indicator dynamically curves the volume profile matrix a
Pine Script® indicator

Whale Liquidity and Absorption Profile [AlgoAlpha]🟠 OVERVIEW
The Whale Liquidity and Absorption Profile maps intrabar buying, selling, delta, and absorption activity into stacked horizontal profiles. It samples lower timeframe volume data inside each chart candle, then groups that activity into price bins to show where aggressive participation and
Pine Script® indicator

Fractional EMA Kalman Filter [D7]Fractional EMA Kalman Filter
1. Description
Fractional EMA Kalman Filter is an experimental smoothing and state-estimation tool that combines a Kalman filter framework with a fractional EMA input. The objective is to create a filter that remains subdued during ranging conditions while retaini
Pine Script® indicator

Neural Weight Oscillator (Zeiierman)█ Overview
The Neural Weight Oscillator (Zeiierman) is an adaptive multi-factor oscillator that combines structured decision-making with dynamic market learning.
The script analyzes three core market behaviors: Trend, Mean Reversion, and Momentum. Instead of treating these components equally, t
Pine Script® indicator

NeuraLib: A Native AI and Deep Learning RuntimeNeuraLib is a tensor-based, auto-differentiating Machine Learning runtime built natively for Pine Script™.
It brings real Deep Learning mechanisms that power modern Artificial Intelligence systems into TradingView. Instead of relying on fixed formulas, static regressions, or rigid structures, Neur
Pine Script® library

See all indicators and strategies
Community trends
Patel Eng Ltd (1D) - Gap Resistance Breakout Attempt.On the daily timeframe, NSE:PATELENG Patel Engineering is showing strong recovery momentum after a prolonged downtrend. Price has reclaimed the 200 HMA and is now approaching a major gap-resistance zone near ₹33–₹34. The stock is attempting to fill the historical gap while RSI has moved into bulli

Ajanta Pharma Ltd – Bullish Breakout Near Resistance ZoneThe stock is showing renewed buying momentum after a healthy consolidation phase, with price moving towards a key breakout area.
🔎 Technical Observations:
* Strong recovery from recent lows
* Higher highs and higher lows formation
* Bullish candle near resistance zone
* Momentum indicators turning

From 6000 Days of Consolidation to a 1000 Day Base Above ItThe Long Sideways Build
Marked by the pink line, this stock spent roughly 5815 days moving sideways. Volume during this stretch stayed normal, nothing dramatic, nothing that screamed accumulation or distribution. Just a long, grinding range. But within that range, a subtle detail stood out: every t

BUY TODAY SELL TOMORROW for 5%DON’T HAVE TIME TO MANAGE YOUR TRADES?
- Take BTST trades at 3:25 pm every day
- Try to exit by taking 4-7% profit of each trade
- SL can also be maintained as closing below the low of the breakout candle
Now, why do I prefer BTST over swing trades? The primary reason is that I have observed that

SWING TRADE Pick for 23rd JUNE - PFCSWING TRADE Pick for 23rd JUNE - PFC
PFC has corrected from earlier highs & now taking support at earlier Resistance levels.
LTP - 441
Target - 488+
SL - 420
timeframe - 30 days
Risk Reward Ratio - 1:2
Happy Investing.

DCIL - Cup and Handle Signals StrengthDredging Corporation of India appears to be forming a large Cup and Handle pattern on the daily chart, with price now approaching the key neckline resistance near 1245 . The recent pullback toward 1036 has developed as the handle portion of the pattern, and the strong recovery from that region

CHAMBLFERT — Structural Reversal Confirmed via Order FlowNSE:CHAMBLFERT
Chambal Fertilisers & Chemicals Ltd. has printed a high-conviction structural reversal pattern at its multi-month structural floor. After establishing strong solid horizontal support at the ₹410.30 level, the asset went through a systematic, multi-month volatility contraction proc

KRISHNADEF: Weekly Macro Triangle Breakout1. The Macro Perspective: The Structural Breakout
I am taking a LONG bias on Krishna Defence and Allied Industries Limited (KRISHNADEF) on the macro weekly (1W) timeframe. Zooming out to view the wider macro structure, we can see the stock has been respecting a massive ascending support trendline o

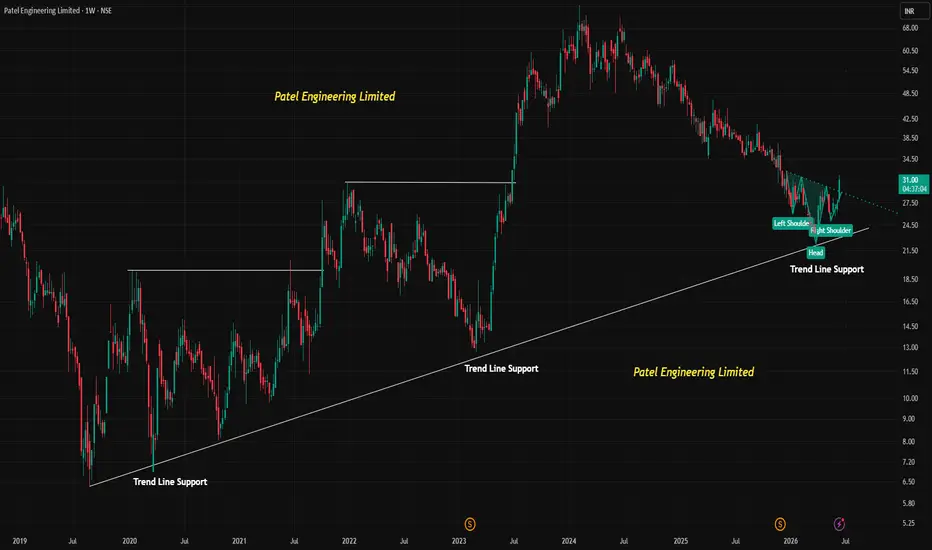
Swing Trade - Patel EnggPatel Engineering (PATELENG) - Swing Trade Idea
Patel Engineering is showing signs of a potential trend reversal after a prolonged downtrend. The stock has formed a bullish structure near support and is attempting a breakout from a contracting pattern.
Trade Setup
📌 CMP: ₹32
🛑 Stop Loss: ₹30.

SANSTAR - Volume Backed Bullish ExpansionSanstar has delivered a decisive breakout from a well-structured consolidation phase, supported by strong buying interest and healthy volume participation. The move reinforces the prevailing bullish trend and suggests the potential for further upward momentum in the near term.
The stock continues t

See all stocks ideas
Jul 9
ANANDRATHIAnand Rathi Wealth Ltd.
Actual
—
Estimate
—
Jul 9
TATAELXSITata Elxsi Limited
Actual
—
Estimate
32.75
INR
Jul 9
GTPLGTPL Hathway Ltd
Actual
—
Estimate
—
Jul 9
TCSTata Consultancy Services Limited
Actual
—
Estimate
37.20
INR
Jul 10
IREDAIndian Renewable Energy Development Agency Ltd.
Actual
—
Estimate
—
Jul 10
JUSTDIALJust Dial Ltd.
Actual
—
Estimate
—
Jul 13
HCLTECHHCL Technologies Limited
Actual
—
Estimate
16.63
INR
Jul 13
DMARTAvenue Supermarts Ltd.
Actual
—
Estimate
13.24
INR
See more events
Community trends
ETHUSD: Two Potential Buying Scenarios to WatchEthereum is approaching a key decision area, and I'm watching two potential buying opportunities.
Scenario 1:
If ETH holds above 1,755, buyers could remain in control, with 1,775 as the first upside target. A sustained move above this level could extend the rally toward 1,790.
Scenario 2:
If price

BTC big move happening nowBTC @ 64000 is now in perfect buy mode.
Reason -
1) 1D extreme MACD and Fisher Bottom but 1W no MACD negative crossover. It is Bullish.
2} 1D Price pattern is Higher Low.
Price Higher Low on 1D Price Chart pattern is important to observe. Because now price refuse to go down any further.
These tw

BTCUSDT Bounce Faces Heavy Supply Near $65KBitcoin has bounced back toward $63.5K, but the recovery still looks vulnerable. After the sharp fall from above $74K to the $59K–60K zone, the current move appears more like a resistance retest than a confirmed bullish reversal.
ETF inflows helped the earlier rebound, but crypto sentiment is still

BTCUSD 30M Bearish Retest SetupThis is my Bitcoin 30-minute analysis, and the overall structure is starting to shift toward the downside.
One thing that immediately caught my attention is that the market is gradually compressing and losing bullish momentum. Instead of creating strong continuation moves, price is beginning to for

Bitcoin As illustrated in the provided chart, the Bitcoin price continues to exhibit a sharp downward trend. 📉 The daily chart reveals an inverted cup and handle pattern. Furthermore, an analysis of the Fibonacci levels indicates that the current volume is insufficient to support a price increase. 📊
The cu

Will BTC go down more?After hitting the 60K mark, BTC formed a short-term bottom. After prolonged sideways consolidation at the lows, it rebounded back above 65K. However, market momentum on the upside is extremely weak, and the overall downtrend has not yet concluded.
For trading, we should keep trading short in line wi

Short on BTCBTC has been rejecting at levels of 64000 from a very long time , with a stop loss of 64400 BTC can be shorted for new lows below 59000

BITCOIN | RECOVERY STRUCTURE REMAINS INTACT | 21-JUN-2026Bitcoin continues to operate within a broader recovery structure despite recent weakness from the resistance zone.
The primary structural development remains the successful base formation established during 2022, which provided the foundation for the subsequent advance toward the 110,000–130,000 re

# BTC/USD (Bitcoin vs U.S. Dollar) – 45-Minute Chart### Market Structure Overview
On the 45-minute timeframe, BTC/USD is showing signs of a developing bullish recovery after establishing a significant swing low near the 62,300–62,500 support region. Following the sharp decline seen earlier in the week, buyers have gradually regained control, produci

BTCUSDT | Liquidity Sweep + Multi-Timeframe MSS Bearish SetupThe trade idea is based on a classic Smart Money Concepts narrative:
✅ 1H Supply Zone
✅ Buy-Side Liquidity Sweep
✅ 15M Bearish MSS
✅ 5M Entry Confirmation
✅ Premium Pricing
✅ Favorable Risk-to-Reward
As long as price remains below the sweep high, the expectation is for a move toward the next pool

See all crypto ideas
Silver Breakdown Puts the $60 Level Back in FocusSilver has lost a major support zone and the overall structure remains firmly bearish. The recent drop below $65 suggests that sellers are still controlling the market, while any short-term bounce may simply be a retest of broken support.
The macro environment is also challenging. A stronger US Dol

XAG/USD 15min triangle pattern.XAG/USD 15min triangle pattern. if liquidity sweep upper side on upper side silver go down

Gold Is Bouncing, But Sellers Are Still Waiting AboveGold is starting the week inside a very interesting structure.
Price is no longer falling in one straight line, but the bigger pressure is still coming from the upper side of the chart.
The question this week is simple:
Is gold building a real recovery, or only bouncing into another sell zone?
T

XAUUSD: Final Elliott Wave 5 ActiveGold is currently moving inside what appears to be the final Elliott wave 5 structure after the recent rejection from the liquidity imbalance zone. From Kelly’s view, the market is still showing downside pressure, but this may be the last bearish leg before a larger corrective recovery begins.
The

XAUUSD – Gold Recovers Slightly, But Bearish Channel Still XAUUSD – Gold Recovers Slightly, But Bearish Channel Still Controls Price
Gold is showing a small recovery at the beginning of the new week after the recent three-day decline. However, on the H1 chart, price is still moving inside a clear descending channel and remains below the SMA 200, which mean

BRIAN XAUUSD – GOLD STARTS THE WEEK UNDER BEARISH PRESSURE
Gold may try to stabilise at the start of the new week, but the broader tone still remains heavy. Last week’s repeated failure to break above the 200 EMA, which has now turned into resistance, keeps the short-term bias defensive.
From a macro view, gold is struggling to benefit from safe-haven de

Bharti Airtel Holds Strong TrendHighlights
* Bharti Airtel continues to maintain a strong technical structure, supported by consistent buying interest and positive investor sentiment.
* The stock is trading above key moving averages, indicating that the broader uptrend remains intact.
* Momentum indicators suggest sustained streng

XAUUSD: Fed Hawks & War De-escalation Trigger 4HR Structure🧵 The Macro Shift: Connecting Yesterday's Relief to Today's Trend
In yesterday’s analysis, we mapped out a brief bullish relief rally for XAUUSD, which was heavily supported by a sharp plunge in crude oil prices. As energy costs temporarily fell, immediate market pressure eased, allowing gold to ca

GOLD: Deep Dive Into the $4,230 Supply ZoneBased on today’s market structure, XAUUSD is displaying a classic bearish continuation pattern after a brief corrective technical rebound.
The market recently corrected heavily from its all-time highs (near 5,500) down to the 4,020 psychological support area. Over the last 24 hours, easing geopol

XAGUSD Strategy: Shaking Out Buyers & Trapping Breakout Sellers
1. Market Context
On the 4H chart of image, Silver is trading under a long-term descending trendline. After a temporary relief rally, the price is facing strong rejection at the local resistance zone near 71.263 (marked "A Few Seller").
2. Psychology & Price Trap Analysis
• Chasing Away Buyers (

See all futures ideas
EURUSD — Corrective Bounce Before Deeper Bearish Continuation
Fundamental Analysis
EURUSD remains under pressure as price continues to trade below the main EMA structure. Traders are still watching USD momentum, Fed expectations, and upcoming macro data.
For now, the recovery looks corrective, not a confirmed bullish reversal. If price fails at the value se

AUDUSD Short trade set up1. Set up - Resistance reversal
2. EMA - Rejection
3. Price trading at resistance

USDCAD Trend Remains Strong as USD OutperformsUSDCAD continues to trend higher with very little evidence of weakness. Instead of sharp corrections, the pair keeps finding buyers on dips, suggesting that market participants still favour the US Dollar.
The macro backdrop supports this view. Stronger US economic releases, higher US yields, and we

21/06/2026 GBP/USD AnalysisFOREXCOM:GBPUSD
GBP/USD could use the bearish Daily FVG as support and continue lower to sweep the sell-side liquidity resting below.
However, I don't want price to trade deeply into the Daily Breakaway Gap. If GBP/USD does retrace into that gap, ideally it should only reach the lower 50% of the

NZDUSD 1H - Reversal Plan: Trapping the Late Sellers1. Market Sentiment & Price Trap
Following up on our June 18th plan, the market has perfectly executed a psychological trap. The aggressive breakdown below 0.57500 triggered the "Buyer Lose" phase, forcing early longs to liquidate their positions. As price pushed into the 0.57100 zone, retail trader

GBPJPY Bullish scenario resumedthe pair is not like gold which but kind of similar. GBPJPY resuming to its daily trend with the following points
Bullish points.
4H RSI divergence
Bullish closing after retracing to Daily Trendline.
Hourly Divergence.
Bearish points.
FVG at 4H right at the gold spot.
Buy Entry CMP at swi

MARKETOMORPH | USDINR | WEEK 25 | 21-JUN-2026MARKETOMORPH LANGUAGE TRANSITION
Beginning with Week 25, MarketOmorph adopts a standardized observation language across all monitored assets.
The framework now communicates market conditions through three primary observation layers:
Structure
→ The dominant structural condition.
Participation
→

EURUSD (H1) – Key Support Reaction & Recovery Scenario📊 EURUSD (H1) – Key Support Reaction & Recovery Scenario
🔍 Analysis:
• EURUSD experienced a strong bearish breakdown after failing multiple times at the main resistance zone, confirming heavy selling pressure from institutional sellers. 🔴📉
• The market rejected the upper resistance area several ti

Range Bound Market Structure Overview
This chart highlights a well-defined range-bound market structure where price continues to trade between a key support zone and a major resistance zone. Multiple reactions from both levels indicate that buyers and sellers remain in equilibrium, with neither side gaining a decisive advanta

See all forex ideas
Trade directly on Supercharts through our supported, fully-verified, and user-reviewed brokers.


