FTSE 100 Index
No trades
No trades
Compare with FTSE 100
Index info
ISIN
GB0001383545
FIGI
BBG000HS1CN6
Identifiers
ISIN GB0001383545
The UK Financial Times Stock Exchange 100 is an index of share prices of the largest 100 companies listed on the London Stock Exchange (LSE) by market capitalisation. The index was launched on January 3, 1984 at a base value of 1000, and the index level is calculated in real-time.
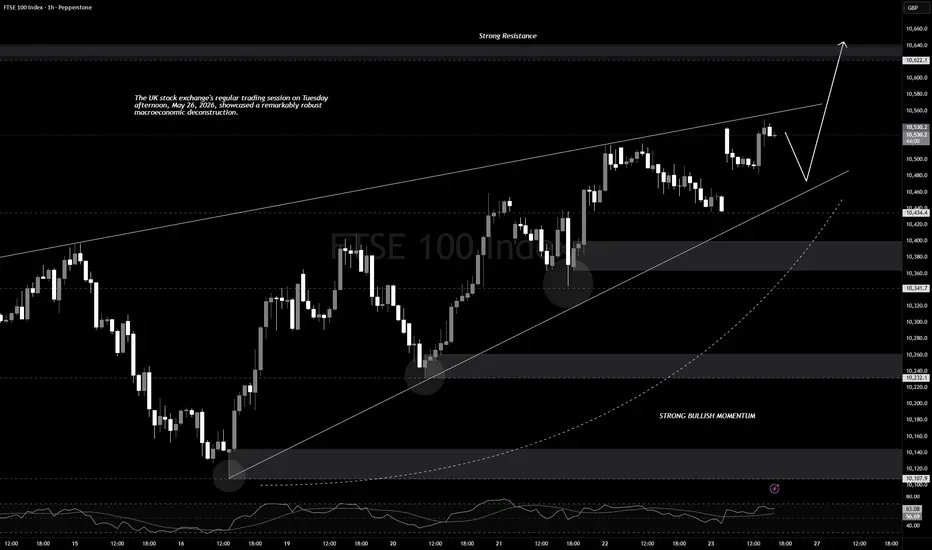
FTSE 100 Gains: A Blessing from Cyclical Index CompositionFTSE 100 Gains: A Blessing from Cyclical Index Composition PEPPERSTONE:UK100
The UK stock exchange's regular trading session on Tuesday afternoon, May 26, 2026, showcased a remarkably robust macroeconomic deconstruction.
While mainland European markets were extremely cautious (the STOXX 600 mov
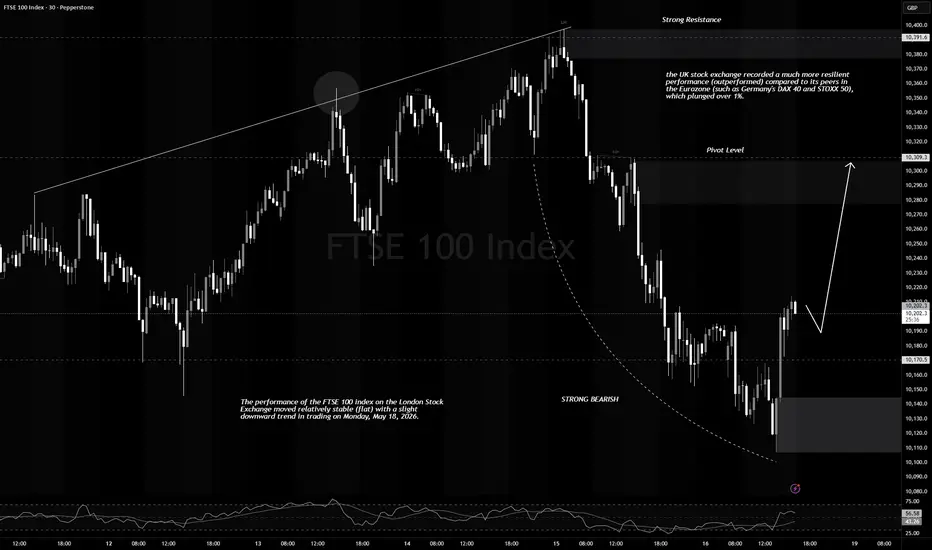
FTSE 100 Holds Up: Energy Defensiveness vs. Westminster PoliticaFTSE 100 Holds Up: Energy Defensiveness vs. Westminster Political Drama
The performance of the FTSE 100 index on the London Stock Exchange moved relatively stable (flat) with a slight downward trend in trading on Monday, May 18, 2026.
Nevertheless, the UK stock exchange outperformed its peers in t
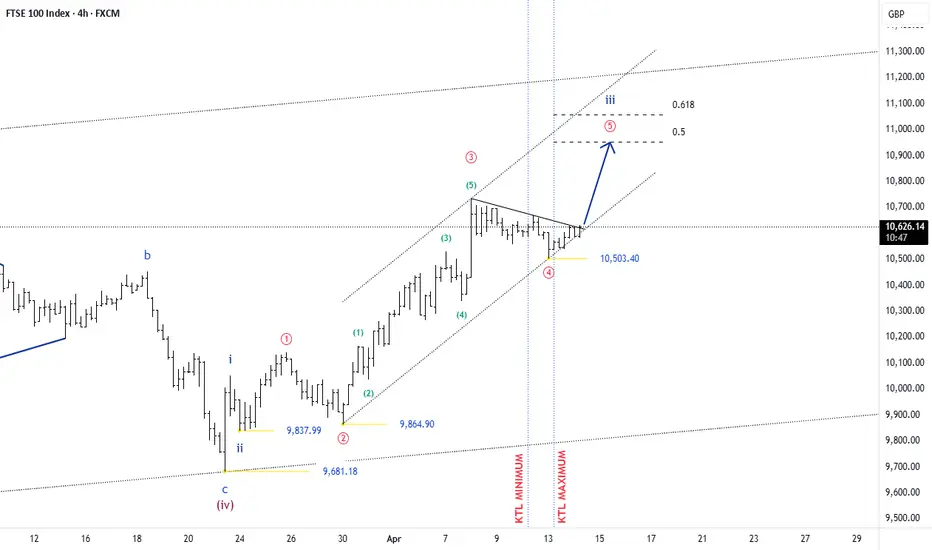
FTSE Index Suffers a Significant DeclineThe FTSE 100 index weakened again on Thursday, April 23, 2026, recording a fourth consecutive session of decline. Market sentiment in London remained weighed down by geopolitical uncertainty in the Middle East and mixed domestic economic data.
The diplomatic deadlock between the US and Iran and the
FTSE - UK stocks - European bearAfter completing five waves up and after a throw over above the upper trendline for the 5th wave we are finally witness a sharp trend reversal. In fact it is a free fall in five waves and we are in minor wave iii of that first move down. A five wave declie once complete will confirm the coming bear
UK100-Short Setup After Supply Zone RejectionPrice rallied sharply from the lows after a Buy signal, showing strong momentum into resistance.
After the rally, a Sell signal has emerged near local highs and beneath a defined structure zone.
Price has started to reject from the zone, with EMAs flattening out — hinting at short-term weakness.
See all ideas
Summarizing what the indicators are suggesting.
Oscillators
Neutral
Oscillators
Neutral
Summary
Neutral
Summary
Neutral
Summary
Neutral
Moving Averages
Neutral
Moving Averages
Neutral
Displays a symbol's value movements over previous years to identify recurring trends.
Frequently asked questions
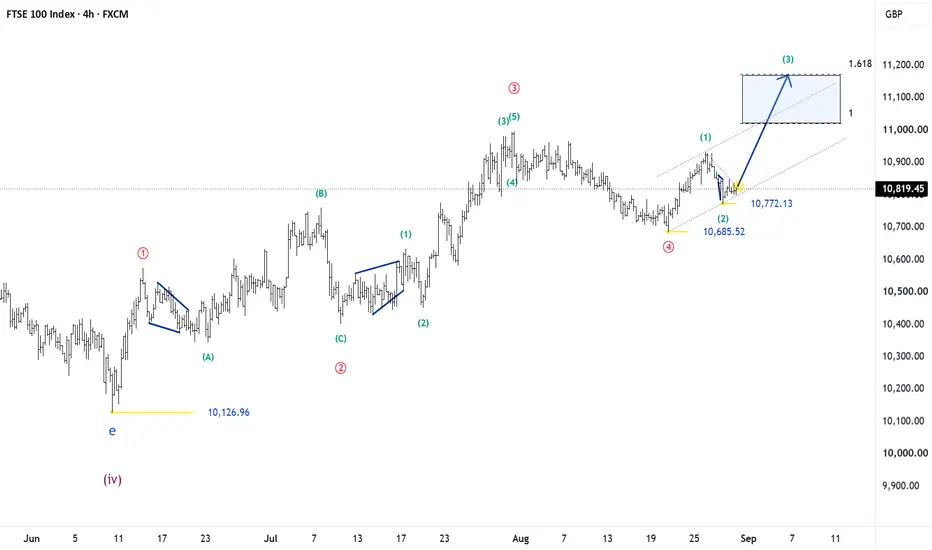
FTSE 100 Index reached its highest quote on Jul 31, 2026 — 10,989.45 POINT. See more data on the FTSE 100 Index chart.
The lowest ever quote of FTSE 100 Index is 1,717.70 POINT. It was reached on Sep 9, 1988. See more data on the FTSE 100 Index chart.
FTSE 100 Index value has decreased by −1.84% in the past week, since last month it has shown a −3.08% decrease, and over the year it's increased by 11.35%. Keep track of all changes on the FTSE 100 Index chart.
The champion of FTSE 100 Index is LSE:CCC — it's gained 97.09% over the year.
The weakest component of FTSE 100 Index is LSE:ENT — it's lost −51.35% over the year.
FTSE 100 Index is just a number that lets you track performance of the instruments comprising the index, so you can't invest in it directly. But you can buy FTSE 100 Index futures or funds or invest in its components.
The FTSE 100 Index is comprised of 98 instruments including LSE:HSBA, LSE:SHEL, LSE:AZN and others. See the full list of FTSE 100 Index components to find more opportunities.