Hindustan Unilever Ltd. (HUL) Stock Analysis### **Hindustan Unilever Ltd. (HUL) Stock Analysis**
---
#### **Fundamental Analysis:**
- **Company Overview:**
Hindustan Unilever Ltd. (HUL) is one of India’s largest consumer goods companies, operating in diverse sectors such as home care, personal care, foods, refreshments, and health & we
Next report date
—
Report period
—
EPS estimate
—
Revenue estimate
—
45.70 INR
102.77 B INR
617.25 B INR
886.60 M
About HINDUSTAN UNILEVER LTD.
Sector
Industry
CEO
Rohit Jawa
Website
Headquarters
Mumbai
Founded
1956
ISIN
INE030A01027
FIGI
BBG000CSMHN7
Hindustan Unilever Limited is engaged in fast-moving consumer goods business comprising home and personal care, foods and refreshments. The Company's segments are Soaps and Detergents, which includes soaps, detergent bars, detergent powders, detergent liquids and scourers; Personal Products, which includes products in categories of oral care, skin care (excluding soaps), hair care, deodorants, talcum powder, color cosmetics and salon services; Beverages, which includes tea and coffee; Packaged Foods, which includes branded staples (atta, salt and bread), culinary products (tomato-based products, fruit-based products and soups) and frozen desserts, and Others that includes exports, chemicals, water business and infant care products. The Others segment also includes export sale of marine and leather products. Its brands include Lux, Surf excel, Rin, Wheel, Fair & Lovely, Pond's, Vaseline, Lakme, Dove, Clinic Plus, Sunsilk, Axe, Brooke Bond, Bru, Knorr, Kissan, Kwality Wall's and Pureit.

HINDUSTAN UNILEVER ON DEMAND ZONE 24/02/2025Symbol : HINDUNI , Exchange : NSE India , Timeframe : Daily Today HINDUNI IN Demand zone
Bothe side Move be possible

what is pivot points and why it super useful ?**Pivot points** are key technical indicators used by traders to identify potential support and resistance levels in the market. They are widely used in various markets, such as stocks, forex, and futures, to help traders determine the overall market trend and make decisions about entry, exit, and s

hindustan unilive revised target for buy is 2020**Hindustan Unilever Limited (HUL)** is India’s largest **FMCG (Fast-Moving Consumer Goods)** company, producing a wide range of daily-use consumer products. It is a subsidiary of **Unilever**, a global consumer goods giant.
---
### **Key Facts About HUL:**
- **Founded:** 1933 (as Hindustan Va

Hindustan UnileverHello & welcome to this analysis
FMCG sector appears to be doing better then other sectors after a very long time with Hindustan Unilever having a large weightage in the sector
Strength signal -
Since 2008 it has never violated the Quarterly Ichimoku Base line nor the Monthly Ichimoku Cloud. Near

HUL- This elephant may danceHUL was trading in a channel shown in chart for last 3 months. It recently showed a breakout from this channel. Current pattern shows retest of the channel. If this is successful, we may see HUL scaling new heights.
Recent budget announcements are in a way beneficial for FMCG sector.
You can keep

HUL wait for Pull back and then EnterHUL has just completed the downward Impluse and complex correction (W-X-Y). Although today it showed the strength to move upward, however it looks like there is need for one pullback before the upward Journey.
Chart Speaks everything.
Disclaimer: I am not SEBI registered member, these Ideas me

Hindustan Unilever Hindustan Unilever are come to tredline suport Buy at market price for 2600 target

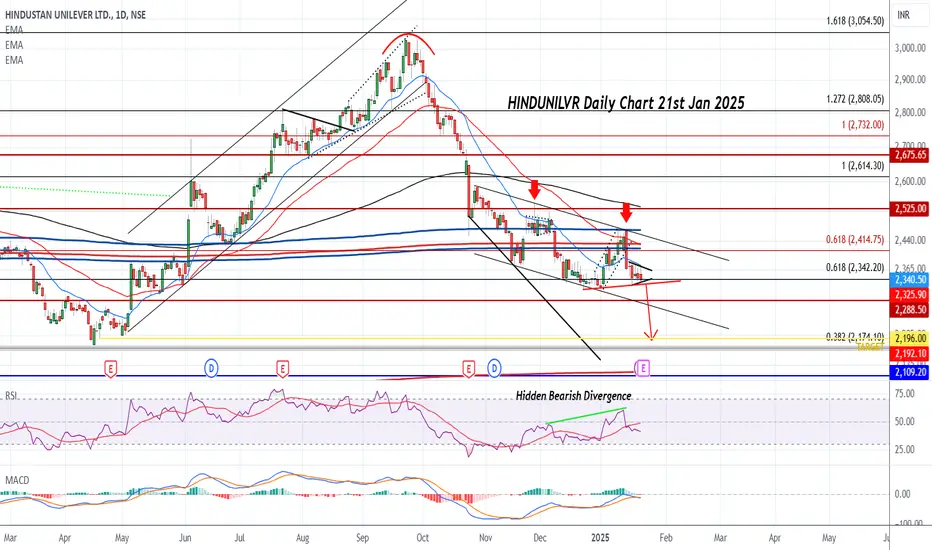
HINDUNILVR can DUMP on Earnings tomorrowAttached: Daily Chart as of 21st Jan 2025
Hidden Bearish RSI Divergence
MACD in Sell and below Zero line
Earnings tomorrow for HUL, if we go by Zomato Earnings which showed Slowdown and Weak Demand for Consumption then Earnings for HUL should also be similar
Price can Crash to Target 2200 and belo
HUL: Bullish Setup Near Order Block!Order Block at Support:
The price is trading within a marked order block zone (₹2,260–₹2,326), which historically acted as a strong demand area.
This zone aligns with the upward-sloping green trendline, reinforcing support strength.
Bullish Falling Wedge: (Similar to 3 Drive Pattern)

See all ideas
An aggregate view of professional's ratings.
Displays a symbol's price movements over previous years to identify recurring trends.
Curated watchlists where HINDUNILVR is featured.

Frequently Asked Questions
The current price of HINDUNILVR is 2,170.90 INR — it has decreased by −1.30% in the past 24 hours. Watch HINDUSTAN UNILEVER LTD. stock price performance more closely on the chart.
Depending on the exchange, the stock ticker may vary. For instance, on NSE exchange HINDUSTAN UNILEVER LTD. stocks are traded under the ticker HINDUNILVR.
HINDUNILVR stock has fallen by −3.06% compared to the previous week, the month change is a −12.66% fall, over the last year HINDUSTAN UNILEVER LTD. has showed a −10.26% decrease.
We've gathered analysts' opinions on HINDUSTAN UNILEVER LTD. future price: according to them, HINDUNILVR price has a max estimate of 3,225.00 INR and a min estimate of 1,924.00 INR. Watch HINDUNILVR chart and read a more detailed HINDUSTAN UNILEVER LTD. stock forecast: see what analysts think of HINDUSTAN UNILEVER LTD. and suggest that you do with its stocks.
HINDUNILVR reached its all-time high on Sep 23, 2024 with the price of 3,035.00 INR, and its all-time low was 61.50 INR and was reached on Jan 5, 1996. View more price dynamics on HINDUNILVR chart.
See other stocks reaching their highest and lowest prices.
See other stocks reaching their highest and lowest prices.
HINDUNILVR stock is 1.88% volatile and has beta coefficient of 0.85. Track HINDUSTAN UNILEVER LTD. stock price on the chart and check out the list of the most volatile stocks — is HINDUSTAN UNILEVER LTD. there?
Today HINDUSTAN UNILEVER LTD. has the market capitalization of 5.15 T, it has increased by 0.44% over the last week.
Yes, you can track HINDUSTAN UNILEVER LTD. financials in yearly and quarterly reports right on TradingView.
HINDUSTAN UNILEVER LTD. is going to release the next earnings report on Apr 24, 2025. Keep track of upcoming events with our Earnings Calendar.
HINDUNILVR earnings for the last quarter are 12.77 INR per share, whereas the estimation was 11.19 INR resulting in a 14.07% surprise. The estimated earnings for the next quarter are 9.90 INR per share. See more details about HINDUSTAN UNILEVER LTD. earnings.
HINDUSTAN UNILEVER LTD. revenue for the last quarter amounts to 157.20 B INR, despite the estimated figure of 156.47 B INR. In the next quarter, revenue is expected to reach 155.93 B INR.
HINDUNILVR net income for the last quarter is 29.84 B INR, while the quarter before that showed 25.91 B INR of net income which accounts for 15.17% change. Track more HINDUSTAN UNILEVER LTD. financial stats to get the full picture.
HINDUSTAN UNILEVER LTD. dividend yield was 1.85% in 2023, and payout ratio reached 96.02%. The year before the numbers were 1.52% and 90.55% correspondingly. See high-dividend stocks and find more opportunities for your portfolio.
As of Mar 3, 2025, the company has 27.76 K employees. See our rating of the largest employees — is HINDUSTAN UNILEVER LTD. on this list?
EBITDA measures a company's operating performance, its growth signifies an improvement in the efficiency of a company. HINDUSTAN UNILEVER LTD. EBITDA is 147.67 B INR, and current EBITDA margin is 23.87%. See more stats in HINDUSTAN UNILEVER LTD. financial statements.
Like other stocks, HINDUNILVR shares are traded on stock exchanges, e.g. Nasdaq, Nyse, Euronext, and the easiest way to buy them is through an online stock broker. To do this, you need to open an account and follow a broker's procedures, then start trading. You can trade HINDUSTAN UNILEVER LTD. stock right from TradingView charts — choose your broker and connect to your account.
Investing in stocks requires a comprehensive research: you should carefully study all the available data, e.g. company's financials, related news, and its technical analysis. So HINDUSTAN UNILEVER LTD. technincal analysis shows the strong sell today, and its 1 week rating is sell. Since market conditions are prone to changes, it's worth looking a bit further into the future — according to the 1 month rating HINDUSTAN UNILEVER LTD. stock shows the sell signal. See more of HINDUSTAN UNILEVER LTD. technicals for a more comprehensive analysis.
If you're still not sure, try looking for inspiration in our curated watchlists.
If you're still not sure, try looking for inspiration in our curated watchlists.