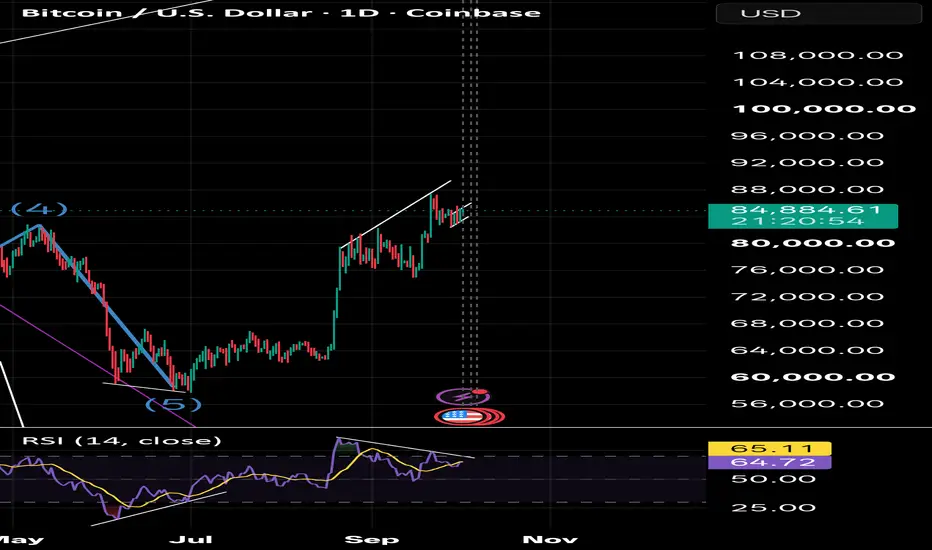
BTC is creating barish divergence in 1D time frame.BTC is showing weakness in trading volume and its sign that something big is brewing. Sharp drop in June-July BTC had created bullish divergence (lower low in Price action and higher High in RSI) and we see pump to 87,000$. Now we can see complete opposite (BTC price is creating higher High and RSI
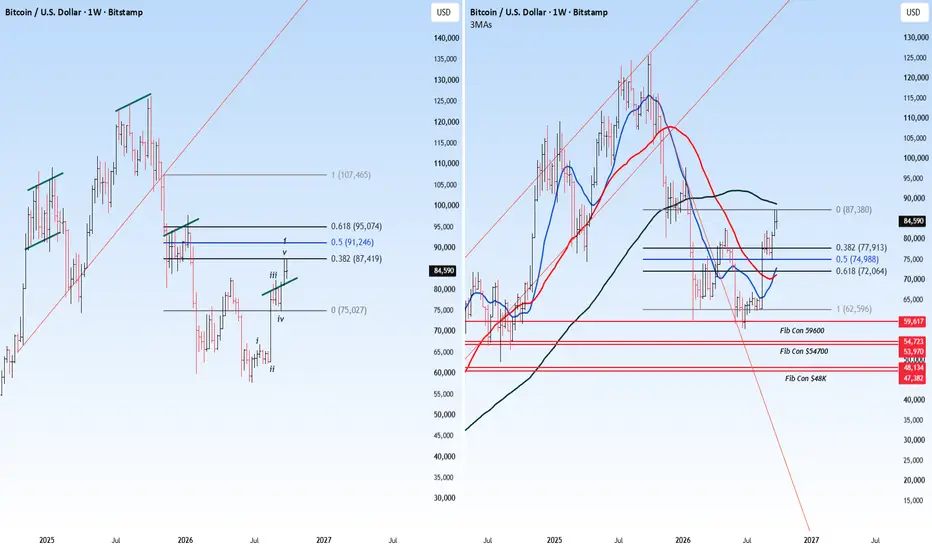
Can the correction be used to buy?Bitcoin CMP $84640
Elliott- wave 1 has its own five waves and hence it is an impulse wave. The vth wave is over facing resistance at 87420.We also have the slowest MA at the same zone. Making the zone a strong reversal point.
Fib- the 2nd wave correction is likely to come down to 72100 , where tw
Oversold MarketsWhat is overbought?
When the market goes up too much, too fast — like it got overexcited. RSI crosses above 70. This means most people who wanted to buy have already bought. Not many buyers left. So the market will likely slow down or fall a bit.
What you do: don't buy now. If you're already in pro
Global Financial MarketsGlobal financial markets are systems where people, companies, and governments buy and sell financial assets across the world. They help move money from those who have extra funds to those who need funds.
Main Types of Global Financial Markets:
Stock Markets – Buying and selling shares of companies
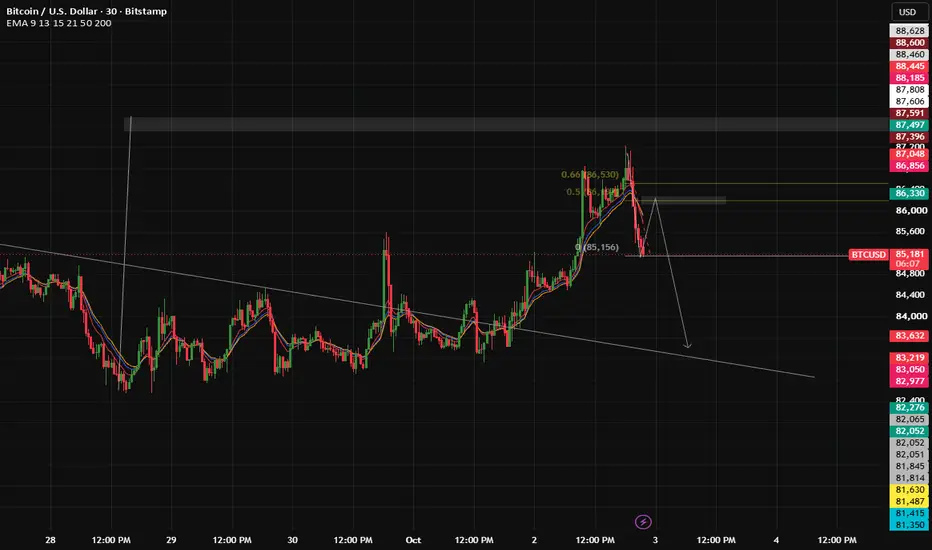
Retest zone Might get to retest for Down Trade
Bitcoin is back in focus as BTC trades around the $86,000 level, following a strong recovery over the past few months. 📈
In this video, we’ll look at the current BTC price action, market trend, important support & resistance levels, ETF flows, U.S. interest-rate
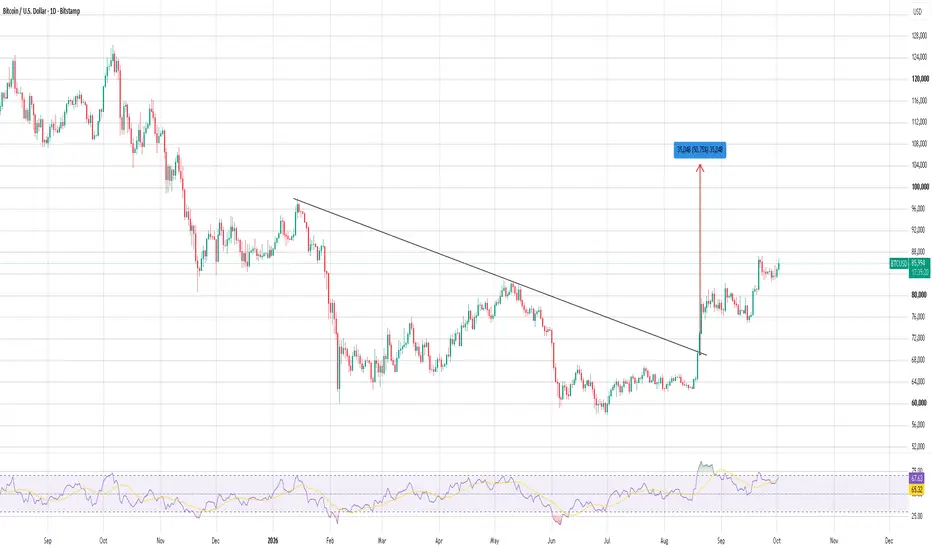
Bitcoin — Daily ChartBitcoin has formed a Double Bottom around the $60,000–$64,000 area. The neckline was broken decisively and the subsequent retest has already been completed, with price holding above the breakout zone.
The breakout also came with strong momentum, and price has moved above the long-term falling tr
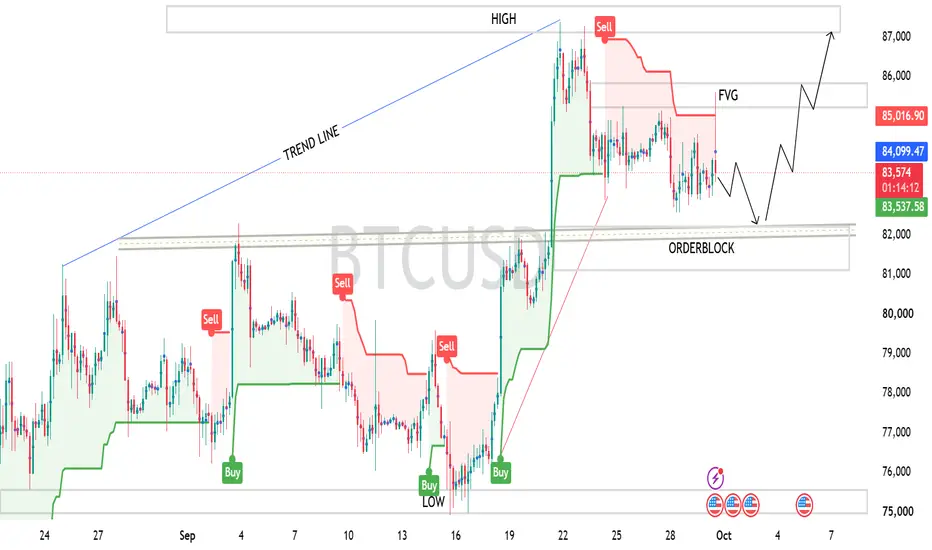
BTCUSD — Technical Market Analysis ## 📊 BTCUSD — Technical Market Analysis
🟢 **Current Price:** ~83,455
📈 **Market Structure:** Bullish on the broader structure, but short-term price is consolidating below resistance.
### 🔍 Key Levels
* 🟥 **Resistance:** 84,000–85,000
* 🟧 **FVG Zone:** ~85,400–86,000
* 🔴 **Major Resistance / High
BTCUSD (15M): Bullish Trendline Breakout & Demand Zone BouncePair: BTCUSD (Bitcoin / U.S. Dollar)
Timeframe: 15-Minute (15M)
Bias: Bullish / Long
Market Overview:
Bitcoin experienced a sharp corrective pullback into the major 83,000 – 83,280 Demand / Support Zone, where strong lower rejection wicks confirmed buyers absorbing the selling pressure.
Key Techn
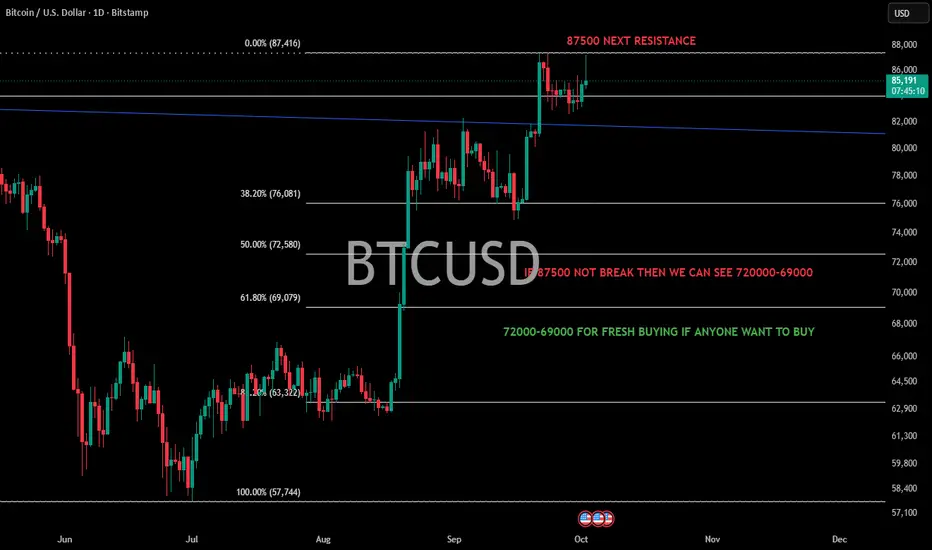
BTCUSD — 87,500 Resistance | Rejection Could Bring 72K–69KBTC is currently approaching the 87,500 resistance area.
As long as price fails to break and sustain above 87,500, a retracement toward the 72,000–69,000 zone remains a scenario to watch.
That zone could potentially provide a fresh buying opportunity, but confirmation would be required before cons
MACD: More Than Just a Crossover📘 MACD: More Than Just a Crossover
MACD (Moving Average Convergence Divergence) is a popular technical indicator that helps traders understand trend direction, momentum, and potential changes in market strength.
Think of MACD as a tool that helps you understand whether buying or selling mom
See all ideas
Summarizing what the indicators are suggesting.
Oscillators
Neutral
Oscillators
Neutral
Summary
Neutral
Summary
Neutral
Summary
Neutral
Moving Averages
Neutral
Moving Averages
Neutral
Displays a symbol's price movements over previous years to identify recurring trends.