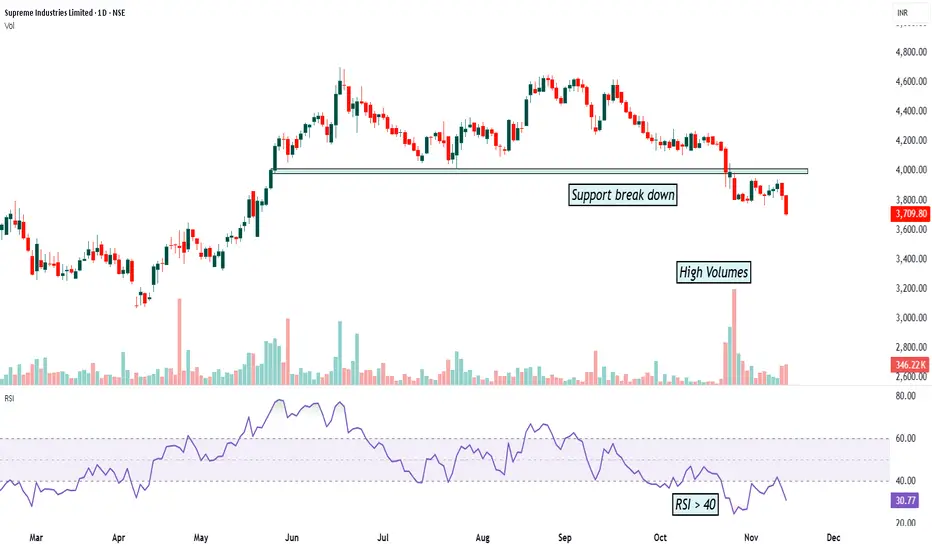
SUPREMEIND- Support break downThe chart shows that the stock has broken an important support level. This support had held the price many times in the past, but now the price has fallen below it. The breakdown has happened with high selling volume, which means more sellers are participating and the move is strong.
RSI is also below 40, which shows weak momentum and that the stock is in a bearish phase. When price breaks support with high volume and RSI stays low, it usually means the trend can continue on the downside.
This setup suggests caution because buyers are weak and sellers are in control.
Community ideas
INDIGOPNTS: Trendline Breakout Post Q2FY26, Chart of the WeekWhy NSE:INDIGOPNTS Could Be Your Next Multi-Bagger: Breaking Out After a Brutal 60% Correction Post Good Q2 FY26 Numbers: Let's Analyze in Chart of The Week
As per the Latest SEBI Mandate, this isn't a Trading/Investment RECOMMENDATION nor for Educational Purposes; it is just for Informational purposes only. The chart data used is 3 Months old, as Showing Live Chart Data is not allowed according to the New SEBI Mandate.
Disclaimer: "I am not a SEBI REGISTERED RESEARCH ANALYST AND INVESTMENT ADVISER."
This analysis is intended solely for informational purposes and should not be interpreted as financial advice. It is advisable to consult a qualified financial advisor or conduct thorough research before making investment decisions.
Price Action Analysis:
Historical Price Movement:
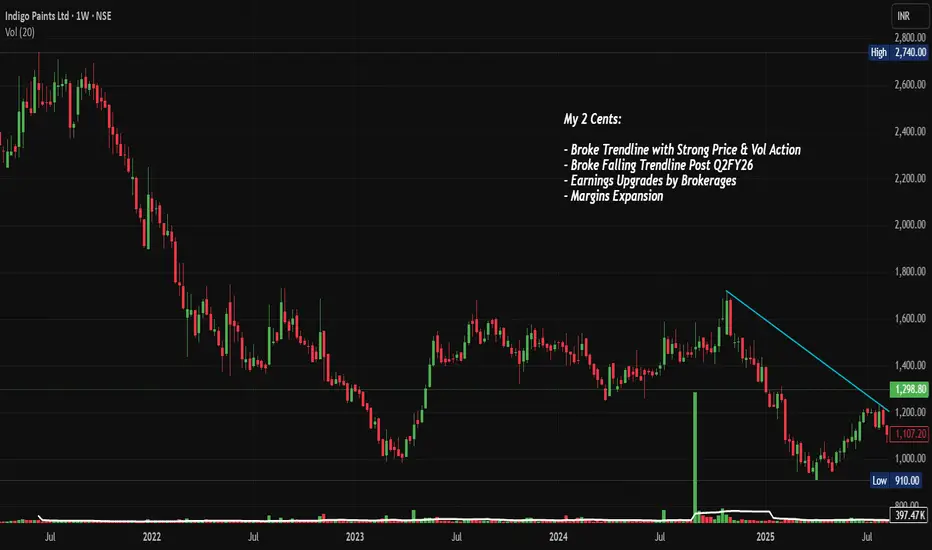
- The stock experienced a steep downtrend from its all-time high of approximately ₹2,695 in early 2022, declining over 60% to a low of ₹910 by mid-2024
- A prolonged bear market spanning nearly two years created a massive consolidation zone between ₹1,000 and ₹1,600 during 2023-2024
- Recent price action shows a strong bullish candle in November 2024, breaking above the downward trendline with significant momentum
- The current price of ₹1,298.80 represents a sharp recovery from the lows, gaining approximately ₹294.70, or 29.35%, in the recent move
Trendline Analysis:
- A clear falling trendline (marked in cyan on the chart) connected the lower highs from the 2022 peak through mid-2024
- This trendline acted as dynamic resistance, rejecting multiple rally attempts throughout 2023 and early 2024
- The recent breakout above this multi-year trendline occurred with strong price and volume confirmation, suggesting a potential trend reversal
- The breakout candle shows conviction with a decisive close above the trendline resistance
Price Structure:
- The stock formed a descending triangle pattern from 2022 to 2024, with lower highs and relatively flat lows around ₹900-₹1,000
- Post-Q2FY26 results (released in early November 2024), the stock has shown explosive upside momentum
- The recent surge created a bullish engulfing pattern on the weekly timeframe, signaling strong buyer interest
Volume Spread Analysis:
Volume Trends:
- Volume during the downtrend was relatively subdued, indicating lack of aggressive selling pressure
- The recent breakout candle shows significantly elevated volume at 7.67 million shares, representing 587.73 thousand volume units
- This volume spike confirms genuine buying interest and institutional participation in the breakout
- Volume expansion during the rally validates the authenticity of the price move
Volume-Price Relationship:
- The correlation between rising prices and expanding volume suggests healthy accumulation
- Previous attempts to break the trendline failed due to insufficient volume support
- Current volume levels are approximately 3-4x the average, indicating strong conviction among market participants
Key Technical Levels:
Support Levels:
- Primary Support (S1): ₹1,200—This represents the previous resistance zone that should now act as support
- Secondary Support (S2): ₹1,100 - The breakout point from the falling trendline
- Major Support (S3): ₹1,000-₹1,006 - Strong psychological level and previous consolidation base
- Ultimate Support (S4): ₹910 - The 52-week low acts as the ultimate floor
Resistance Levels:
- Immediate Resistance (R1): ₹1,400 - Near-term psychological barrier
- Intermediate Resistance (R2): ₹1,600 - Previous consolidation zone highs from 2023-2024
- Major Resistance (R3): ₹1,800 - Key supply zone from the downtrend phase
- Long-term Resistance (R4): ₹2,200-₹2,400 - Retracement levels toward the all-time high
Base Formation:
- A solid base has been established between ₹900 and ₹900-₹1,100 over an extended 18-month period
- This accumulation zone represents significant institutional buying at lower levels
- The base demonstrates strong hands holding the stock, reducing downside volatility
- Multiple tests of the ₹900-₹1,000 zone without breaking down confirms strong demand
Technical Patterns:
Reversal Patterns:
- A falling wedge/descending triangle pattern formed from 2022 to 2024, which is typically a bullish reversal pattern
- The pattern shows lower highs with relatively consistent lows, indicating selling exhaustion
- A breakout from this multi-year pattern suggests a major trend change is underway
Candlestick Patterns:
- The recent weekly candle shows strong bullish characteristics with a large body and minimal upper shadow
- The candle closed near its high, indicating buyer dominance throughout the period
- Previous candles show a transition from consolidation to expansion phase
Fundamental Backdrop:
Company Overview:
- Indigo Paints is India's fourth-largest decorative paints company with strong brand recognition
- The company operates three manufacturing facilities located in Jodhpur, Kochi, and Pudukkottai
- Headquartered in Pune, Maharashtra, the company was founded in 2000 and listed on stock exchanges in 2021
- Known for innovative product launches and being first-to-market with several differentiated paint solutions
Recent Financial Performance:
- Q2FY26 revenue grew 3.45% year-on-year to ₹298 Cr., though net income grew 5.85% to ₹26 Cr, due to competitive pressures
- Gross margins expanded to 45.1% from 44.1% in the previous year, driven by softening raw material costs and premium product focus
- EBITDA margin improved to 15.3% from 14.8%, reflecting operational efficiency gains
- The company has expanded its dealer network to over 18,900 active dealers and more than 11,650 tinting machines
Growth Catalysts:
- Management expects double-digit volume growth by Q4FY25, supported by strong leading indicators like dealer fund inflows and painter token scanning
- Extended monsoon impacted August sales, but July and September showed robust growth momentum
- The company is focusing on premium product mix to defend margins against aggressive competition from new entrants
- Expansion into project sales and construction chemicals segments provides new revenue streams
Sectoral Outlook:
Indian Paint Industry Overview:
- The Indian paints and coatings market is estimated at USD 10.46 billion in 2025 and expected to reach USD 16.38 billion by 2030, growing at 9.38% CAGR
- Architectural applications account for 77.56% of market demand in 2024, driven by India's construction boom
- The decorative segment accounts for nearly 75% of total demand, with 80% coming from repainting activity
- Repainting cycles have shortened from 7-8 years to just 4-5 years, accelerating demand growth
Competitive Landscape:
- New players like Birla Opus, JSW Paints, and Pidilite have entered with aggressive strategies and significant capital expenditure
- Birla Opus alone plans to increase industry capacity by 40% over the next three years, aiming to become the second-largest manufacturer by 2025
- Revenue growth slowed to 4% in FY24 after 14-15% CAGR between FY19 and FY23 due to price cuts and competitive pressures
- Despite margin pressure, established players like Indigo maintain advantage through distribution networks and brand loyalty
Industry Drivers:
- Residential unit sales surged 30% year-on-year to 474,000 units in 2024, supported by PM Awas Yojana affordable housing scheme
- The government plans to construct 30 million affordable houses over the next five years through PM Awas Yojana
- Rising disposable incomes, urbanization, and lifestyle changes are compressing repaint intervals in major cities
- Infrastructure projects under Bharatmala and Sagarmala are driving demand for industrial and protective coatings
Bull Case:
- A technical breakout from multi-year falling trendline with strong volume confirmation suggests major trend reversal
- Established player with differentiated product portfolio and strong gross margins outperforming peers
- Sector tailwinds from government infrastructure push and housing demand provide multi-year growth runway
- Valuation correction of 60% from peak creates attractive entry point for long-term wealth creation
- Management's focus on premium products and margin expansion positions company well against competition
Bear Case:
- Intense competition from well-capitalized new entrants (JSW, Birla Opus) could pressure market share
- Slower-than-expected volume growth in Q2FY26 raises concerns about demand momentum
- Margins vulnerable to aggressive pricing by competitors offering trade discounts
- An elongated monsoon and macroeconomic uncertainties could impact near-term performance
- Stock has rallied sharply in short period, creating potential for profit-booking
Key Monitoring Points:
- Track quarterly volume growth trajectory to confirm management's guidance of double-digit growth by Q4
- Monitor gross margin trends to ensure premium strategy is working despite competitive intensity
- Watch dealer expansion metrics and market share data versus new entrants
- Observe raw material price trends, particularly crude-linked derivatives impacting costs
- Follow infrastructure spending and housing sales data as leading indicators for industry demand
My 2 Cents:
- The stock has decisively broken out from a multi-Week falling trendline resistance with exceptional volume support
- Multiple technical factors align favorably: pattern breakout, volume confirmation, base formation, and momentum shift
- Risk-reward ratio remains attractive even after the recent rally, particularly on any pullback to ₹1,200 levels
- The base formation between ₹900 and ₹900-₹1,100 provides strong downside support for long-term holders
- While near-term earnings growth is muted due to competition, the long-term sector outlook remains robust
- The company's focus on operational efficiency and margin expansion is yielding results despite challenges
NSE:INDIGOPNTS presents a compelling asymmetric risk-reward opportunity where the technical setup, fundamental improvement trajectory, and sectoral tailwinds are aligning after a prolonged correction. The breakout from a multi-year base with strong volume support provides a high-conviction entry point for wealth creation over the next 12-24 months.
Full Coverage on my Newsletter this Week
Keep in the Watchlist and DOYR.
NO RECO. For Buy/Sell.
📌Thank you for exploring my idea! I hope you found it valuable.
🙏FOLLOW for more
👍BOOST if you found it useful.
✍️COMMENT below with your views.
Meanwhile, check out my other stock ideas on the right side until this trade is activated. I would love your feedback.
As per the Latest SEBI Mandate, this isn't a Trading/Investment RECOMMENDATION nor for Educational Purposes; it is just for Informational purposes only. The chart data used is 3 Months old, as Showing Live Chart Data is not allowed according to the New SEBI Mandate.
Disclaimer: "I am not a SEBI REGISTERED RESEARCH ANALYST AND INVESTMENT ADVISER."
This analysis is intended solely for informational purposes and should not be interpreted as financial advice. It is advisable to consult a qualified financial advisor or conduct thorough research before making investment decisions.
time cycles as a filter within technical analysis(NIFTY)Professional traders often use time cycles as a filter within technical analysis:
What are Time Cycles?
Time Cycle Analysis is a subset or specialized branch of technical analysis that focuses exclusively on the timing of market turns using recurring time intervals, rather than price patterns or indicators.
It studies when price reversals or significant moves are likely to occur, based on:
Historical time intervals between highs/lows
Fixed calendar cycles (seasonal, lunar, anniversary dates)
Mathematical cycles (Fibonacci time zones, Gann time squares, Hurst cycles)
Key Time Cycle Methods:
Method Description
Seasonality e.g., "Sell in May and go away"
Anniversary Dates Markets often reverse near dates of past major highs/lows
Fibonacci Time Zones Vertical lines at Fib intervals (1, 2, 3, 5, 8, 13, 21 days/weeks) from a swing point
Gann Time Analysis Uses squares (e.g., 90-day, 144-day cycles), angles, and dates
Hurst Cycles Identifies dominant cycle lengths (e.g., 18-week, 40-week) using spectral analysis
Goal: Predict when a reversal or acceleration might occur, regardless of price structure.
Key Difference: Time Cycles vs. Technical Analysis
Aspect Technical Analysis (Broad) Time Cycle Analysis (Narrow)
Focus Price + Volume + Patterns Time intervals only
Core Question What is the trend/pattern? When will the turn happen?
Tool sIndicators, patterns, S/R Calendar dates, Fib time, Gann squares
Predicts Direction + levels Timing of potential reversals
Standalone? Yes Usually combined with TA for confirmation
Example "RSI oversold + double bottom → buy" "90 days from March low → expect top"
Analogy:
Technical Analysis = A full GPS system (route, speed, traffic, landmarks)
Time Cycles = Just the clock on the dashboard ("We always hit traffic at 5 PM")
Best Practice: Combine Both
Professional traders often use time cycles as a filter within technical analysis:
Price at support + RSI oversold
AND: We're 144 days from the last major low (Gann cycle)
→ High-probability long setup
Summary
Technical Analysis Time Cycle Analysis
Scope Broad (price, volume, patterns) Narrow (timing only)
Predicts Direction, levels Timing of turns
Relationship Parent method Sub-branch of TA
Time Cycles ≠ Separate from TA — they are a timing tool within technical analysis.
The Herd Mentality – Why Everyone Buys When It’s Too Late?Hello Traders!
You’ve seen it a hundred times, the market rallies, social media explodes, and suddenly everyone starts buying.
Then, just when retail traders feel “safe” entering, the price crashes.
It’s not bad luck, it’s herd mentality .
And unless you understand how it works, you’ll keep following the crowd straight into losses.
1. What is Herd Mentality in Trading?
Herd mentality is the instinct to do what everyone else is doing, buying when others buy, selling when others sell.
It’s rooted in human psychology, our brains feel safer when we’re part of a group.
In trading, this instinct is deadly because the crowd always reacts late.
When you feel comfortable entering a trade, it’s usually because the market has already moved.
2. The Cycle of Fear and Greed
Every bull run begins with a few smart traders who buy quietly when no one’s interested.
As prices rise, social media hype builds, the crowd starts joining in.
Then, when “everyone” is talking about the coin, smart money exits, leaving the herd trapped at the top.
The same happens in bear markets, panic selling at bottoms while professionals buy patiently.
It’s not about intelligence, it’s about emotion.
3. How the Market Exploits the Crowd
Institutions and big traders understand herd behavior better than anyone.
They create liquidity by pushing prices to levels where retail traders feel emotionally forced to act.
The market uses human nature, fear and greed, as its fuel.
The crowd provides the liquidity, and professionals use that liquidity to enter or exit quietly.
4. How to Avoid Becoming Part of the Herd
Develop your own plan, if your entry depends on others’ excitement, it’s not your setup.
Buy when the market feels uncomfortable; sell when everyone feels confident.
Learn to think independently. The best trades usually feel the hardest to take.
Patience and conviction are your weapons against the herd.
5. The Truth Most Traders Don’t Want to Hear
If you wait for social proof to feel confident, you’ll always be late.
By the time the crowd “believes,” the move is already priced in.
You don’t get rich by following others, you get rich by understanding why others behave the way they do.
Rahul’s Tip:
The market doesn’t punish retail traders because they lack knowledge, it punishes them because they act emotionally together.
Train your mind to do what’s uncomfortable, not what’s popular. That’s where the profit hides.
Conclusion:
The herd mentality is the silent killer of most portfolios.
The more people talk about an asset, the less opportunity it holds.
Smart traders buy silence and sell noise.
Once you learn to think independently, you’ll stop being the liquidity, and start trading like the ones who create it.
If this post opened your eyes to herd psychology, like it, share your view in comments, and follow for more deep market insights!
XAUUSD Gold ShortI expect Gold to decline toward the 3700–3800 range. A trade can be considered with a stop-loss set at 4382, maintaining a risk-to-reward ratio of 1:1.5. Please do your own research before entering any trade.

GOLD: The Bigger Picture is Finally Getting Clearer !Gold finally showed some clarity after weeks of structure, and now the bigger picture is lining up perfectly across the daily and multi-year weekly charts. The rejection from the 4250–4350 zone triggered the first meaningful retracement after a parabolic rally, and price is now hovering right above the 4030–4060 daily support the only level holding back a much deeper corrective cycle. This entire region is critical because it marks the last breakout base, the liquidity origin, and the midpoint of the 3600-4300 vertical leg. As long as this shelf holds, gold will continue to move in a compressed range, but once a clean daily close breaks below it, the market naturally opens up a fast move toward the 3500–3550 target zone. All confluences measured move, channel midline, point to this same cluster, making it a high-confidence retracement level inside a long-term bullish trend.
On the upside, the structure is very clean. Only a sustained breakout above 4300–4350 invalidates the entire correction and flips the bias back to full-bull mode, where gold can easily run toward 4600–4800 as the next discovery leg. Anything below that zone still falls under the extended correction category, not a bullish continuation. This is why the invalidation level is drawn exactly where it is to protect from guessing the reversal too early.
On the weekly chart, gold has slipped back inside the multi-year ascending channel after briefly wicking above it. That wick was nothing but a classic blow-off extension followed by a reversion to mean. Now price is sitting comfortably inside the same long-term structure . The upper red band remains the multi-year resistance, the green midline is the structural backbone of the trend, and the purple lower band is the deep cycle accumulation zone. As long as gold stays inside this channel, the macro remains strongly bullish and corrections within this structure are normal and healthy. The mid-channel region around 3500 also aligns perfectly with the expected daily correction, which adds even more confirmation that this retracement is simply part of the long-term trend and not a trend reversal.
Commodity index on both daily and weekly frames is cooling off from extreme levels, which supports a deeper pullback rather than an immediate rally. No new bullish divergence has appeared yet, meaning momentum still favors a downside sweep before any major upside continuation. Combine that with the lack of fresh macro drivers and a stabilization in rate-cut expectations, this cooling phase was overdue.
In simple below daily support, gold continues the correction toward 3500-3650 above 4350, the correction thesis dies and the bull trend resumes aggressively. Until then, this is a textbook retracement inside a long-term uptrend nothing broken, nothing unexpected, just a parabolic market taking a breath. Trade safe !

GRSE : Long (daily chart) Bollinger Bands: Price has moved from the middle band to the upper band and is now closing strongly near the upper band. This shows bullish strength and expanding momentum. Bands are also widening, which means volatility is increasing in a positive way.
Volumes: Recent candles show rising green volume, which supports the upward move. When price goes up with strong volume, it means buyers are active and confident.
RSI: RSI is around 69, which means strong momentum. It is approaching the overbought zone but still healthy. This tells us buyers are in control, but a small pullback can come anytime.
ADX: ADX is near 23, which means the trend is starting to strengthen. It is not extremely strong yet, but it is improving—this is a positive sign for swing traders.
Trade Plan (Simple and Practical)
Entry:
Wait for a small dip or consolidation near 2800–2850.
This is safer than entering at the top of the candle.
Stoploss (SL):
Keep SL below recent swing support:
➡ 2680
Targets:
🎯 Target 1: 3000
🎯 Target 2: 3150
🎯 Target 3 (extended): 3300
Holding Period:
7–15 trading days (based on current momentum and volatility)
📚 Educational Purpose Only — Not Buy/Sell Advice

Part 2 Ride The Big MovesMoneyness of Options
Options are classified as:
In the Money (ITM) – already profitable if exercised
At the Money (ATM) – strike close to current price
Out of the Money (OTM) – not profitable yet
Traders choose strikes based on strategy, risk appetite, and market view.
Greeks: The DNA of Options
Options behave differently based on market conditions. The Greeks measure these sensitivities:
Delta – how much the option price changes with underlying movement
Gamma – how much delta changes
Theta – time decay
Vega – sensitivity to volatility
Rho – sensitivity to interest rates
Understanding Greeks helps traders manage risk and predict option behavior.

Option Trading Strategies Covered Call – Income Strategy
Market View: Moderately bullish
How it Works:
You hold shares of a stock.
You sell a call option on those shares.
You earn premium as profit.
Best For:
Generating fixed income in a sideways/bullish market.
Low-risk traders.
Risk: Stock may get “assigned” if it crosses strike price.

PCR Trading Strategies The Role of Premium
The premium is the price you pay to buy the option.
Premium is influenced by:
Underlying price
Strike price
Time to expiry (more time = higher premium)
Volatility (higher volatility = higher premium)
Interest rates
Market demand
The buyer’s maximum loss is limited to the premium paid, but the seller’s risk can be much higher—sometimes unlimited.

Sector Rotation StrategiesWhat Is Sector Rotation?
Sector rotation refers to the practice of shifting investments from one sector of the economy to another based on changing market conditions, economic cycles, and investor sentiment. Markets do not move uniformly—some areas outperform during economic expansion, others during contraction. For example:
When the economy is booming, cyclical sectors like automobiles, metals, real estate, and banks outperform.
When the economy slows, investors prefer defensive sectors like FMCG, healthcare, utilities, and IT services.
The core idea is: follow where the money is flowing, not where prices have already rallied.
Why Sector Rotation Works
Sector rotation is rooted in behavioral finance and macroeconomics. Institutional investors—mutual funds, FIIs, pension funds—allocate capital to sectors depending on their outlook for earnings growth, interest rates, inflation, and liquidity. As they rotate capital:
Strong sectors get stronger due to inflows.
Weak sectors remain weak or lag behind.
Retail traders often enter at the end of a rally, but sector rotation strategies allow you to anticipate moves earlier because sector performance leads stock performance.
The Business Cycle & Sector Rotation
To understand sector rotation, you must understand the economic cycle, which typically moves through five stages:
1. Early Recovery Phase
Interest rates remain low.
Liquidity is high.
Consumer and business spending picks up.
Outperforming sectors:
Automobiles
Banks & Financials
Real Estate
Capital Goods
Reason: These sectors are sensitive to credit, growth, and consumer spending.
2. Mid-Cycle Expansion
Economy grows at a stable pace.
Corporate earnings rise.
Market sentiment is positive.
Winning sectors:
Metals & Mining
Industrials
Technology
Infrastructure
Mid-cap and small-cap stocks
Reason: Companies expand operations and capex increases.
3. Late Cycle
Inflation increases.
Interest rates begin rising.
Market becomes volatile.
Strong performers:
Energy (Oil & Gas)
Commodities
Power
PSU sectors
Reason: Prices of energy and commodities improve due to inflation and supply constraints.
4. Recession / Slowdown
GDP weakens.
Spending slows.
Markets correct sharply.
Defensive sectors shine:
FMCG
Healthcare / Pharma
Utilities (Power, Gas Distribution)
Consumer Staples
Reason: Demand for essentials remains stable even in downturns.
5. Early Recovery Again
Cycle starts again as central banks cut rates and liquidity returns.
Indian Market Examples
Sector rotation plays out very visibly in India:
When RBI cuts rates → Banks, Realty, Autos rally first.
When inflation rises → FMCG, Pharma outperform.
When global commodity prices spike → Metals, Oil & Gas surge.
During IT outsourcing demand booms → Nifty IT becomes a leader.
When the government pushes capex → Infrastructure & PSU stocks take off.
For example:
In 2020-21, IT and Pharma led the rally after COVID.
In 2022, Metals and PSU banks outperformed due to global inflation.
In 2023-24, Railways and Defence were the strongest due to government spending.
In 2024-25, Financials and Energy gained leadership.
Sector rotation keeps happening because no sector leads forever.
Tools Used for Sector Rotation Analysis
1. Relative Strength (RS)
Compare performance of one sector vs Nifty 50.
If RS > 0 → sector outperforming
If RS < 0 → sector lagging
Traders often use:
Ratio charts (NIFTYSECTOR / NIFTY50)
RRG charts (Relative Rotation Graphs)
2. Price Action & Breakouts
Sectors forming:
Higher highs–higher lows
Breakouts on weekly charts
Often start outperforming for months.
3. Volume Profile
You track:
Institutional accumulation zones
High volume nodes
Breakout volumes
Sector rotation shows up as big volume shifts from one sector to another.
4. Market Breadth
Number of advancing stocks vs declining stocks in a sector helps identify internal strength before price rally starts.
Top Practical Sector Rotation Strategies
Strategy 1: Follow Market Cycles
Identify if India is in:
Expansion
Peak
Slowdown
Recovery
Then pick sectors accordingly.
This is the classic macro-driven approach.
Strategy 2: Follow Institutional Flows
Monitor:
FII sectoral holdings
Mutual fund monthly fact sheets
Volume increase in sectoral indices
If institutions are buying a sector for 3–4 months continuously, a long-term trend is beginning.
Strategy 3: Ratio Chart Method
Daily or weekly ratio charts give very clear guidance.
Example:
NIFTYBANK / NIFTY50 rising → banks leading
CNXIT / NIFTY50 rising → IT leadership pattern
If the ratio chart breaks out → shift capital to that sector.
Strategy 4: Top-Down Approach
A professional hedge-fund style method:
Analyze global macro trends
Identify strong Indian sectors
Select top stocks inside those sectors
Enter on pullbacks or breakouts
This avoids random stock picking and aligns you with the strongest flows.
Strategy 5: Rotation Within the Cycle
Within major rotations, micro rotations happen too.
Example:
Inside defensive rotation:
First FMCG moves
Then Pharma
Then Utilities
Inside growth rotation:
First Banks
Then Autos
Then Realty
Each mini-rotation gives trading opportunities.
Strategy 6: Quarterly Earnings Based Rotation
Before and after results, money flows into sectors expected to report strong earnings.
For example:
IT moves during Q1
Banks move during Q3
FMCG moves during Q4
Earnings cycles and sector cycles often overlap and strengthen each other.
Strategy 7: Event-Driven Rotation
Based on news, policy or global events:
Crude oil rising → Energy & refining sector improves
Govt budget focus on capex → Infra & PSU rally
Rupee weakening → IT & Pharma benefit
Fed rate cuts → Financials & Realty boom
Events accelerate sector rotation speed.
Common Mistakes in Sector Rotation Trading
1. Entering After the Rally Is Over
If a sector has already given:
20–30% weekly move
4–5 months leadership
It may soon rotate out.
2. Ignoring Macro Signals
Traders who only watch charts miss the bigger picture. Macro trends drive rotations.
3. Chasing Too Many Sectors
Focus on 2–3 sectors at a time. Too many sectors dilute capital and attention.
4. Confusing Short-Term Noise With Rotation
Rotation is visible on weekly time frames, not intraday.
Benefits of Sector Rotation
Helps avoid underperforming areas
Aligns with institutional money
Reduces risk as you stay with strong sectors
Improves probability of capturing long-swing trends
Eliminates guesswork in stock picking
Provides a structured approach
In short: sector rotation keeps you on the right side of the market.
Final Thoughts
Sector rotation is not a prediction strategy—it is an observation strategy. You observe where money is flowing and position yourself accordingly. In Indian markets, sector leadership changes every 3–12 months, creating repeated opportunities for informed traders. By combining macro analysis, volume profile, price action, and ratio charts, you can build a robust rotation-based trading framework that works across market cycles.
Part 1 Support and Resistance Bear Put Spread – Low Cost Bearish Trade
Market View: Moderately bearish
How it Works:
Buy ATM/ITM put
Sell lower strike put
Cheap alternative to buying a naked put
Iron Condor – Sideways Market Strategy
Market View: Neutral/Range-bound
How it Works:
Sell OTM call spread
Sell OTM put spread
Collect premium from both sides
Profit in a non-trending market
Best For:
Market consolidation
Expiry day premium decay

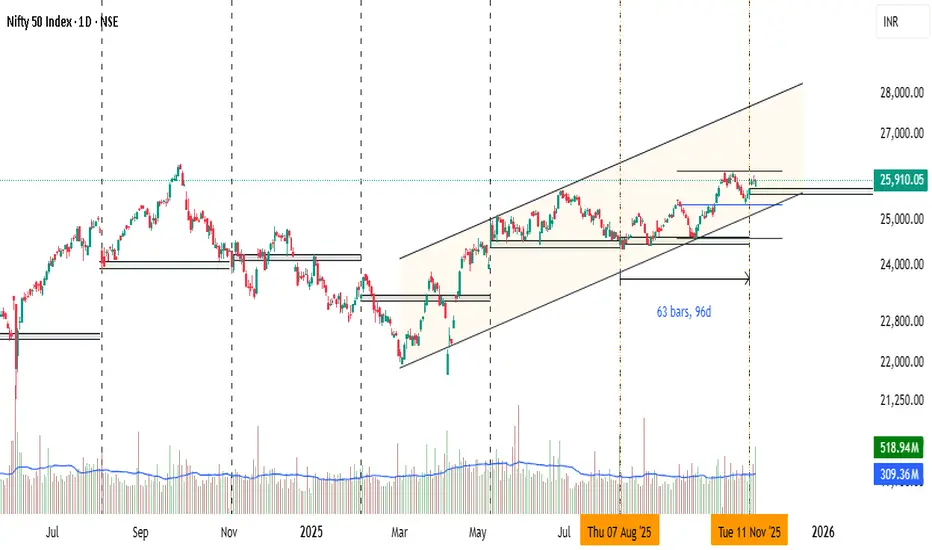
#Nifty Weekly 17-11-25 to 21-11-25#Nifty Weekly 17-11-25 to 21-11-25
25200-25300 is major support 25700-26020 is the range for next week.
Option sellers can consider the above range.
If Nifty sustains above 26020, ABCD activates, targets on long side are 26150/26280.
If Nifty trades below 25700, more downside possible and targets are 25600/25500.
View: Bullish to Sideways

Part 2 Master Candlestick PatternBull Call Spread – Low Cost Bullish Trade
Market View: Moderately bullish
How it Works:
Buy ATM/ITM call
Sell higher strike call
Reduces cost + reduces risk
Best For:
Controlled bullish trades
Trending markets
Bear Put Spread – Low Cost Bearish Trade
Market View: Moderately bearish
How it Works:
Buy ATM/ITM put
Sell lower strike put
Cheap alternative to buying a naked put

Technical Analysis of BTCUSD – Is a Correction Approaching?BINANCE:BTCUSD is currently moving within a clearly defined falling wedge pattern, with price now pressing against the lower boundary of the structure. This level may act as dynamic support, and if price shows a strong rejection, a corrective move toward the resistance zone near 102,000 could occur.
If sellers manage to defend that resistance area, the bearish structure remains intact, giving BTCUSD the potential to continue dropping to lower levels. But if price breaks above that zone, there is room for a higher correction toward the upper boundary of the wedge.
At this stage, paying close attention to candlestick patterns and volume behavior around this key area is crucial for identifying the best selling opportunities. Make sure every trade setup is supported by clear confirmation, and always apply solid risk management.
If you have any additional insights or a different perspective on this setup, I’d love to hear it. Feel free to share your thoughts in the comments!

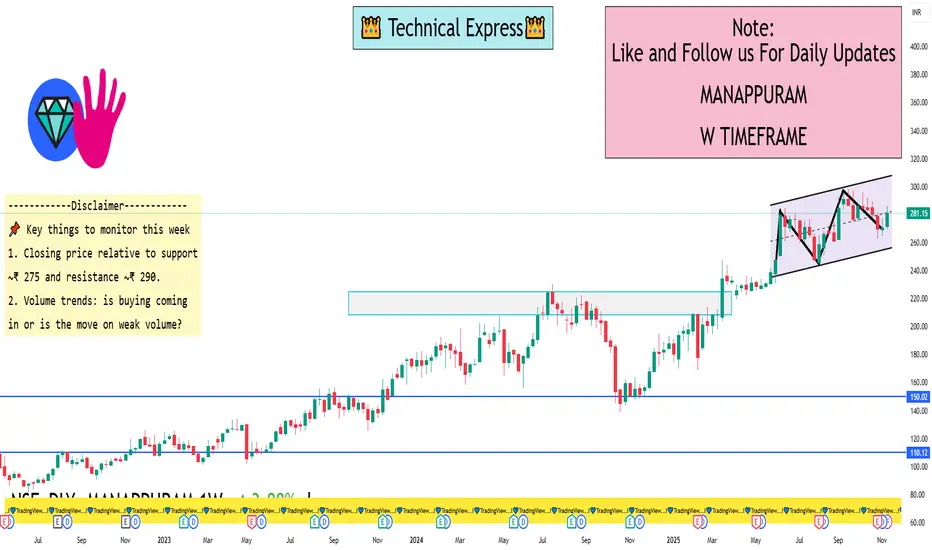
MANAPPURAM 1 Week View✅ Current state & context
The stock is trading around ₹ 281.15 as of 14 Nov 2025.
Recent technical scan shows a “Buy” to “Strong Buy” rating in the 1-week horizon via trading-view style indicators.
From the weekly performance note: the 20-day moving average crossover appeared recently, which historically has seen a ~3.9% average gain in ~7 days (on this stock) when that signal appears.
On the fundamental side, the stock is trading at relatively high valuations (P/E ~ 50+ times) and has seen significant price appreciation in recent months.
🎯 Key support & resistance levels for the next week
From the recent price action and technical indicators:
Support zones to watch
Near the recent swing low / consolidation area around ₹ 270-275. If price pulls back, this zone could act as first buffer.
Next deeper support around ₹ 260-265, which might catch if a stronger correction shows up.
Resistance zones to watch
Immediate resistance around the recent high ~ ₹ 290-295 (given the 52-week high is ~₹ 298).
If momentum continues, a break above ~₹ 300 might open further upside, but that would require strong volume and favourable catalyst.
India’s Market Surge1. Strong Domestic Economic Growth
The backbone of India’s market rally is its robust and consistent economic growth. India remains the fastest-growing major economy, with GDP growth often staying in the 6–7.5% range, even when global economies struggle with recession fears.
Key factors boosting economic momentum include:
High domestic consumption (India is a consumption-driven economy)
Strong government capital expenditure, especially in infrastructure
Rising manufacturing activity, supported by PLI schemes
Improving rural demand and financial inclusion
This economy-market alignment builds investor confidence that the expansion is backed by real economic progress, not just speculative money flow.
2. Consistent FII and Strong DII Participation
In previous market cycles, India heavily depended on Foreign Institutional Investors (FIIs). But the recent surge shows the strength of domestic investors:
Domestic Institutional Investors (DIIs)
Mutual funds, SIPs, and pension funds are investing record amounts every month.
Monthly SIP inflows crossing new highs build a stable, continuous support for equities.
Foreign Institutional Investors (FIIs)
FIIs have returned strongly due to India’s improving macro stability.
Compared to China, many FIIs see India as a safer, higher-growth, long-term bet.
This dual inflow dynamic creates a powerful liquidity engine that keeps markets supported even during short-term corrections.
3. Corporate Profit Boom
One of the most underestimated drivers is India’s corporate profit cycle.
Corporate profits as a percentage of GDP have hit multi-year highs.
Banks and financials are reporting record profits due to low NPAs and higher credit growth.
Manufacturing, IT, auto, and capital goods sectors are showing both volume growth and margin improvement.
When earnings grow consistently, markets rise not just because of sentiment—but because fundamentals justify higher valuations.
4. Government’s Long-Term Policy Stability
Policy continuity has played a major role in boosting investor confidence.
Important policy drivers:
GST stabilizing over time
Digitization and UPI-driven fintech boom
PLI schemes encouraging manufacturing expansion
Infrastructure push: roads, railways, logistics corridors
Make-in-India & Atmanirbhar Bharat initiatives
Clear, predictable policy frameworks attract both domestic and global investors who prefer stable emerging markets.
5. India’s Rising Global Preference vs China
A major geopolitical shift is happening:
Global investors are rebalancing away from China and moving to India.
Reasons include:
Better political stability
Fewer regulatory uncertainties
High-quality corporate governance
Massive demographic advantage
A growing middle-class consumption engine
India is being viewed as the next global growth leader, not just an emerging market. This perception shift alone adds premium valuations to Indian equities.
6. Middle-Class Expansion and Financialization of Savings
India’s middle class is growing rapidly, and with it, the financialization trend:
More people opening Demat accounts
SIP participation rising steadily
Increasing awareness of equity markets
Young investors entering trading and investing
This broad-based participation provides long-term depth and resilience to the markets—even during global volatility.
7. Sectoral Supercycles Fueling the Rally
Several sectors are experiencing their own mini supercycles:
a) Banking & Financials
Strong credit growth
Lower NPAs
Improved capital adequacy
Better provisioning
b) Capital Goods & Infrastructure
High order books
Massive government capex
Private capex revival
c) Auto & EV-related industries
Strong sales across passenger/2-wheeler/commercial vehicles
EV ecosystem development
d) Defence & PSU Stocks
Higher orders
Strategic focus on self-reliance
Market sentiment turning positive towards PSUs
e) New-Age & Tech Companies
Improved profitability
Better cash flows
More mature valuations
This multi-sector momentum gives the market a broader base, making the rally durable.
8. Stability in Inflation and Interest Rates
India has managed to maintain relatively stable inflation compared to many countries hit by energy crises, geopolitical tensions, or currency volatility.
RBI’s strict monetary policy helped keep inflation in control.
Rupee stability protects India from imported inflation.
Lower commodity prices benefit India’s manufacturing base.
Stable inflation and controlled borrowing costs help companies expand without pressure on margins.
9. Strong Global Positioning and Favourable Demographics
India’s demographic advantages will drive its markets for decades:
Average age around 29 years
Growing skilled workforce
Urbanization increasing yearly
Digital adoption growing at the fastest pace worldwide
Investors see India as a long-term compounding story rather than a short-term trade.
10. The Sentiment Factor: Confidence is at a Multi-Year High
Market cycles are also influenced by emotions—fear, greed, confidence, uncertainty.
Right now, India is riding on:
High confidence in government
Strong consumer sentiment
Optimistic business outlook
Healthy global reputation
This sentiment acts as the fuel that keeps the rally alive even during global shocks.
Is the Surge Sustainable?
While short corrections will always come, the long-term structure of India’s market rally remains strong due to:
Strong macroeconomic foundation
Corporate earnings visibility
Global capital preference
Domestic investor strength
Multi-sector growth
However, investors should be aware of valuations, especially in midcaps and smallcaps, which may see periodic cooling-off phases.
Conclusion
India’s market surge is not a temporary excitement—it is the result of strong fundamentals, stable policies, global shifts, and rising domestic participation. As the country transitions into a global economic powerhouse, its stock markets are reflecting this journey through steady, multi-layered growth. The next decade is expected to be one of the most promising periods for Indian equities, supported by structural transformation, digitization, manufacturing expansion, and a confident investor base.

Part 2 Support and Resistance Straddle – Big Move Expected (Either Side)
Market View: Highly volatile ±10%
How it Works:
Buy ATM Call + ATM Put
If stock shoots up or crashes, you earn big
Used During:
Results day
Budget announcement
Major news event
Strangle – Cheaper Version of Straddle
Market View: High volatility expected
How it Works:
Buy OTM Call + OTM Put
Cheaper than straddle
Requires bigger move to profit

XAUUSD: Continuing Uptrend with Potential Expansion to $4,280OANDA:XAUUSD has shown strong performance in the ascending channel, and I expect this trend to continue as shown in my chart, with a target price of $4,280.
The current area represents a key turning point, where prices could find support allowing them to rise, or they may break down, which could lead to a further downward movement.
If I were to choose the most likely direction, I would lean towards upward price movement. However, only market action will determine whether the channel will continue or not.
If the downtrend line is breached strongly, it will invalidate the bullish scenario, meaning that the bullish momentum could weaken or even reverse in the short term.
These are just my personal forecasts based on technical analysis, and they do not represent financial advice. Always make sure to verify your setups and manage risks wisely.
Wishing you successful and profitable trading!


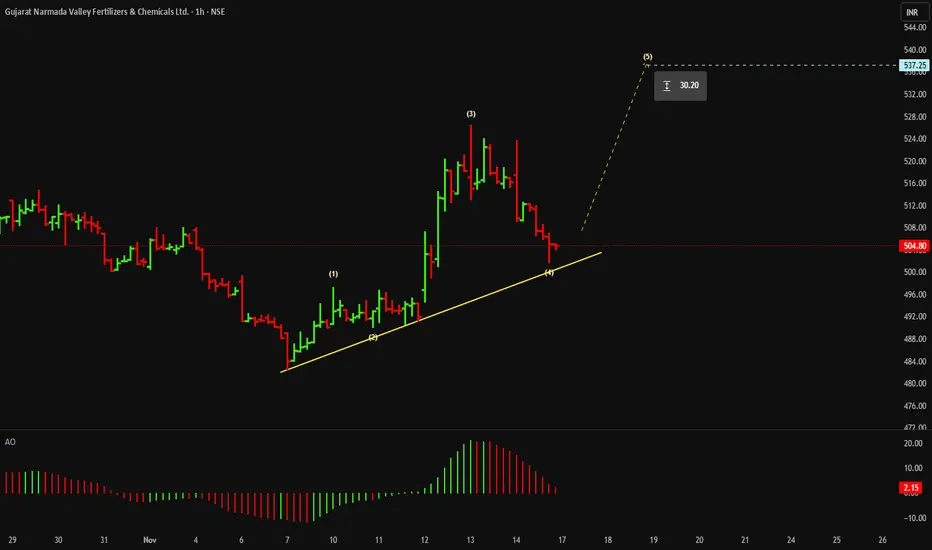
Pattern Unfolding I Prefer this pattern as unfolding Pattern of Wave Theory
where Wave 1 & Wave 3 Sequence have completed before confirming single advance of Mono Wave on daily TF
Now One has to wait for Reversal on 1 Hour before entering the trade so that You get to ride
Next reasonable price forecast
This is education content
Good luck
Part 1 Ride The Big Moves Why Traders Use Options
Options offer several unique advantages:
1. Leverage
With a small premium, you can control a much larger position.
2. Hedging
Investors can protect portfolios from downside risk using puts.
3. Income Generation
Selling options—especially covered calls—creates consistent passive income.
4. Flexibility
You can profit in:
Upward markets
Downward markets
Sideways markets
High or low volatility environments
This flexibility gives options an edge over simple stock trading.

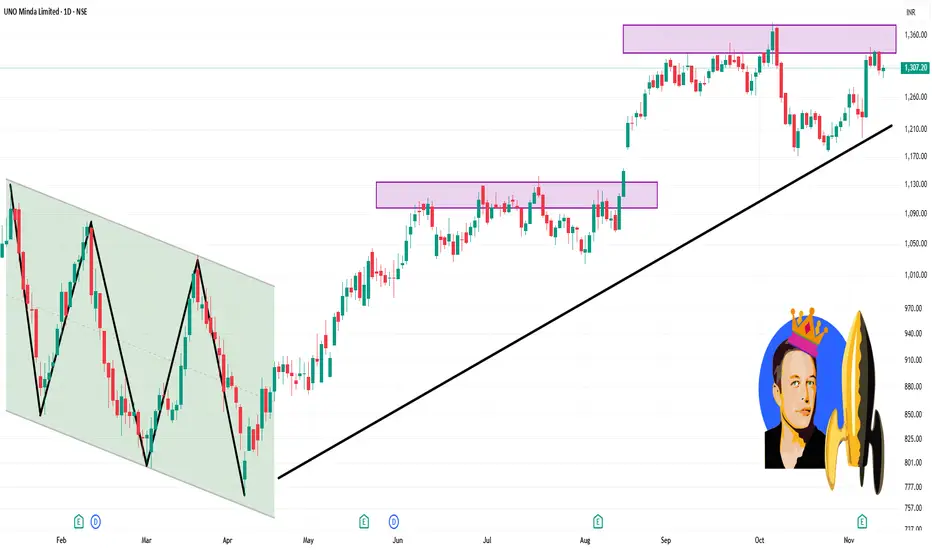
UNOMINDA 1 Day Time Frame 🔍 Current Price & Range
Last close: ~ ₹1,307.20.
Day range: ~ ₹1,290.05 (Low) → ₹1,311.05 (High).
VWAP: ~ ₹1,302.08.
✅ How to use these levels
If price holds above ₹1,290 and moves upward past ₹1,311 with volume, then a move toward ₹1,330-₹1,340 becomes plausible.
If price breaks below ₹1,290 on strong volume, watch for decline toward ~ ₹1,280 or worse.
Use stop-losses and manage risk, especially since the stock is trading near its 52-week high (~ ₹1,382) which may create stronger resistance.