AstraZeneca Pharma: Reversal Brewing Inside CompressionAfter months of moving under a strong descending resistance, the stock has finally shown a sharp reaction from the lower boundary of its structure. The recent impulsive move backed by volume indicates accumulation at lower levels, not just a technical bounce. However, price is now entering a heavy r
AstraZeneca Pharma India Limited
No trades
No trades
Compare with AstraZeneca Pharma India Limited
67.85 INR
1.88 B INR
22.76 B INR
4.60 M
Company info
Sector
Industry
CEO
Praveen Rao Akkinepally
Website
Headquarters
Bangalore
Founded
1979
IPO date
Jul 30, 1998
ISIN
INE203A01020
FIGI
BBG000CNNKY8
Identifiers
ISIN INE203A01020
AstraZeneca Pharma India Ltd. is engaged in the manufacturing, distribution, and marketing of pharmaceutical products and clinical trial services. It focuses in the areas of cardiovascular and metabolic disease, cancer and respiratory, inflammatory, and autoimmune disease. The company was founded on July 11, 1979 and is headquartered in Bangalore, India.
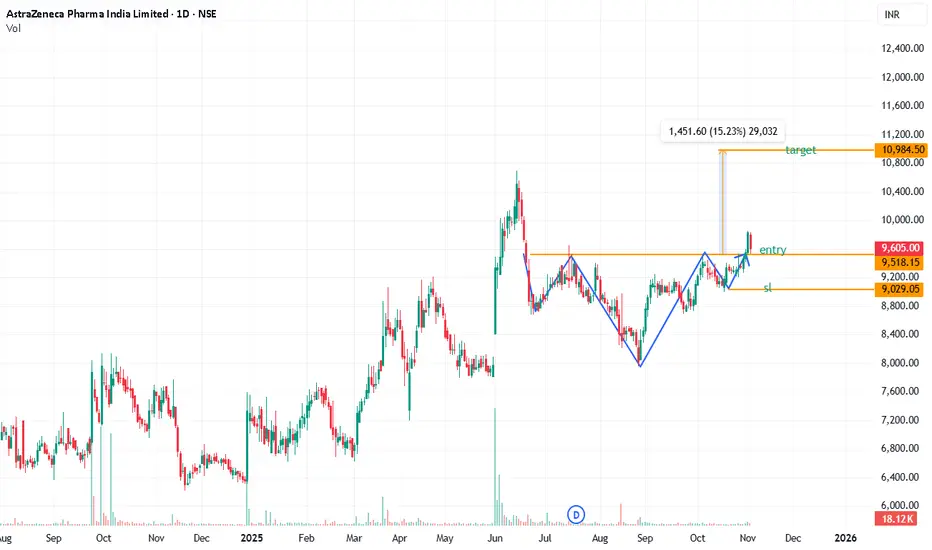
ASTRAZEN inverted head and shoulder patternASTRAZEN inverted head and shoulder pattern,
AstraZeneca Pharma India Limited financials summary for FY 2025:
Annual Revenue (Net): ₹1,713.29 crore (up from ₹1,295.53 crore in FY 2024)
Total Revenue: ₹1,756.92 crore
Profit Before Tax (PBT): ₹156.36 crore
Profit After Tax (PAT): ₹115.74 crore
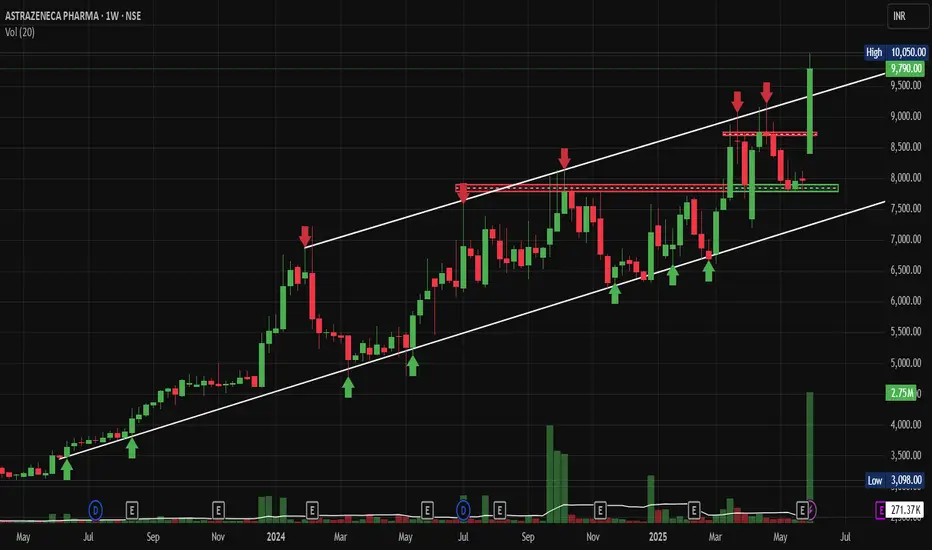
AstraZeneca Breakout Above 10000 Could Signal Next Leg, Post Q4NSE:ASTRAZEN Breakout Above 10000 Could Signal Next Leg, Post Spectacular Q4 and FY25 Numbers. Breaking out of Rising Channel, hence selected for this Week's "Chart of the WEEK"
Price Action Analysis:
• Stock has been in a strong uptrend since May 2024, rising from around 3000 levels to current
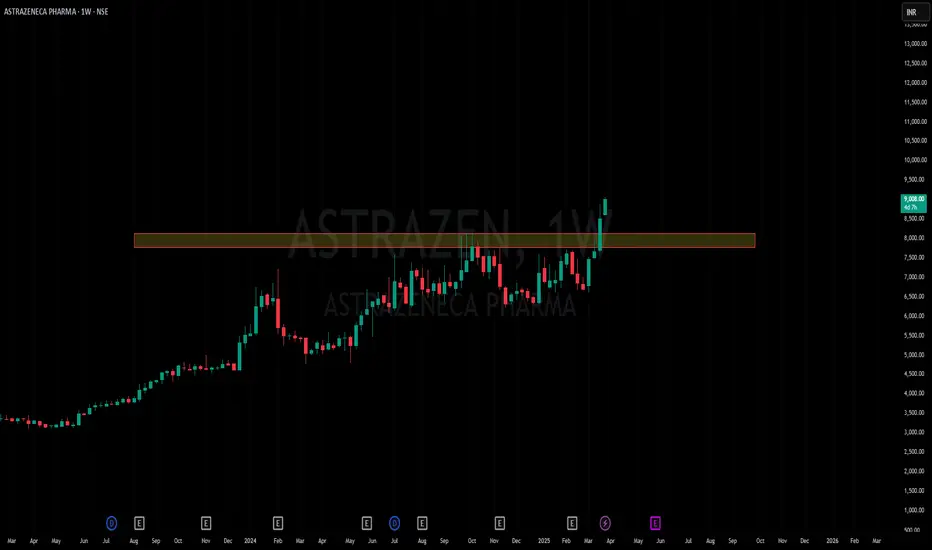
Amazing breakout on WEEKLY Timeframe - ASTRAZENCheckout an amazing breakout happened in the stock in Weekly timeframe, macroscopically seen in Daily timeframe. Having a great favor that the stock might be bullish expecting a staggering returns of minimum 25% TGT. IMPORTANT BREAKOUT LEVELS ARE ALWAYS RESPECTED!
NOTE for learners: Place the break
Astrazeneca Pharma India LtdAstra Zeneca Pharma India Ltd is engaged in the business of manufacture, distribution and marketing of pharmaceutical products.The company is promoted by AstraZeneca plc, a multinational pharmaceutical and biotechnology company headquartered in England.
Based on the chart's current momentum and th
#ASTRAZEN - Potential All Time High BreakOut / Feb'25📊 Script: ASTRAZEN
Key highlights: 💡⚡
📈 Stock is in a Stage 2 Up Trend
📈 VCP under formation in DTF
📈 Wait for more consolidation
📈 BO with volume spike, then only enter
📈 MACD can give a Bounce
📈 RS Line is making 52WH
📈 EMA Rule in place
📈 Price consolidated for 73Days
📈 One can go for Swing Tra
Breaking Resistance With Volume Blast in Risisng ChannelNSE:ASTRAZEN is Breaking Major Levels With high Voulme Blast in Rising Channel on Daily Timeframe.
Disclaimer: This analysis is intended solely for informational and educational purposes and should not be interpreted as financial advice. It is advisable to consult a qualified financial advisor
Amazing breakout on Weekly / Daily Timeframe - ASTRAZENCheckout an amazing breakout happened in the stock in Weekly timeframe, macroscopically seen in Daily timeframe. Having a great favour that the stock might be bullish expecting a staggering returns of minimum 25% TGT. IMPORTANT BREAKOUT LEVELS ARE ALWAYS RESPECTED!
NOTE for learners: Place the bre
See all ideas
Summarizing what the indicators are suggesting.
Oscillators
Neutral
Oscillators
Neutral
Summary
Neutral
Summary
Neutral
Summary
Neutral
Moving Averages
Neutral
Moving Averages
Neutral
Displays a symbol's price movements over previous years to identify recurring trends.
Frequently asked questions
The current price of ASTRAZEN is 5,913.00 INR — it has decreased by −1.95% in the past 24 hours. Watch AstraZeneca Pharma India Limited stock price performance more closely on the chart.
Depending on the exchange, the stock ticker may vary. For instance, on BSE exchange AstraZeneca Pharma India Limited stocks are traded under the ticker ASTRAZEN.
ASTRAZEN stock has fallen by −8.90% compared to the previous week, the month change is a −14.80% fall, over the last year AstraZeneca Pharma India Limited has showed a −36.14% decrease.
ASTRAZEN reached its all-time high on Jun 13, 2025 with the price of 10,653.05 INR, and its all-time low was 114.60 INR and was reached on Oct 29, 2003. View more price dynamics on ASTRAZEN chart.
See other stocks reaching their highest and lowest prices.
ASTRAZEN stock is 3.37% volatile and has beta coefficient of 0.71. Track AstraZeneca Pharma India Limited stock price on the chart and check out the list of the most volatile stocks — is AstraZeneca Pharma India Limited there?
Today AstraZeneca Pharma India Limited has the market capitalization of 150.76 B, it has decreased by −6.33% over the last week.
Yes, you can track AstraZeneca Pharma India Limited financials in yearly and quarterly reports right on TradingView.
ASTRAZEN net income for the last quarter is 379.30 M INR, while the quarter before that showed 448.80 M INR of net income which accounts for 0.00% change. Track more AstraZeneca Pharma India Limited financial stats to get the full picture.
AstraZeneca Pharma India Limited dividend yield was 0.46% in 2025, and payout ratio reached 47.99%. The year before the numbers were 0.37% and 69.12% correspondingly. See high-dividend stocks and find more opportunities for your portfolio.
As of Oct 6, 2026, the company has 760 employees. See our rating of the largest employees — is AstraZeneca Pharma India Limited on this list?
EBITDA measures a company's operating performance, its growth signifies an improvement in the efficiency of a company. AstraZeneca Pharma India Limited EBITDA is 2.58 B INR, and current EBITDA margin is 11.68%. See more stats in AstraZeneca Pharma India Limited financial statements.
Like other stocks, ASTRAZEN shares are traded on stock exchanges, e.g. Nasdaq, Nyse, Euronext, and the easiest way to buy them is through an online stock broker. To do this, you need to open an account and follow a broker's procedures, then start trading. You can trade AstraZeneca Pharma India Limited stock right from TradingView charts — choose your broker and connect to your account.
Investing in stocks requires a comprehensive research: you should carefully study all the available data, e.g. company's financials, related news, and its technical analysis. So AstraZeneca Pharma India Limited technincal analysis shows the strong sell today, and its 1 week rating is strong sell. Since market conditions are prone to changes, it's worth looking a bit further into the future — according to the 1 month rating AstraZeneca Pharma India Limited stock shows the sell signal. See more of AstraZeneca Pharma India Limited technicals for a more comprehensive analysis.