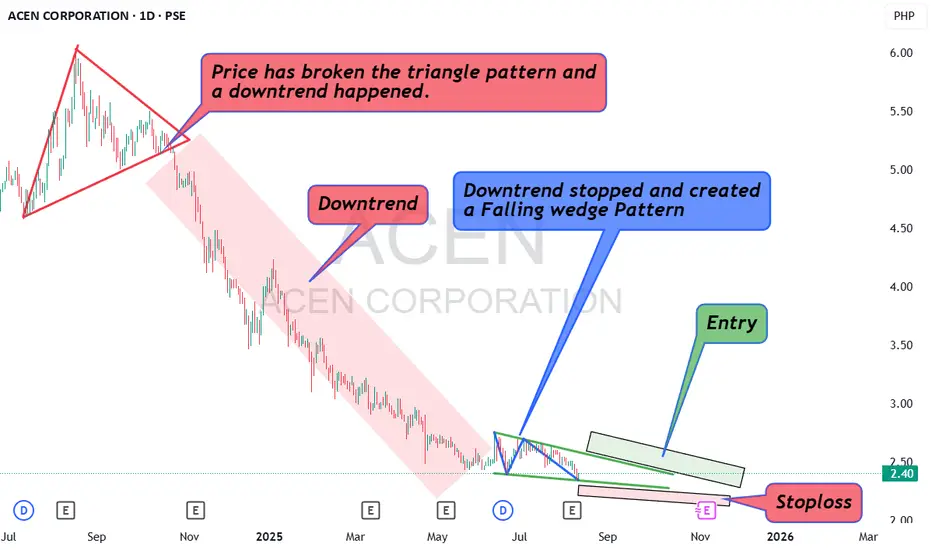
ACEN made a triangle chart pattern. A triangle chart pattern can be bullish or bearish depending which direction the breaks happen. In CAEN's case, it has broken the support side of the triangle. It is a bearish break. After that break, ACEN's price made a downtrend from October 2024 to June 2025. Almost 8 months of its price just slowly sliding down.
The downtrend took a pause around June. You can clearly see that some form of range and sideways movement took place after that long downtrend. A pause on an uptrend is just a pause unless some form of reversal pattern appears. A pause in a downtrend is just a pause unless some form of reversal pattern appears. The pause itself is insignificant for it can either be a lack of interest from buyers/sellers or a little exhaustion from the previous trend. The reversal pattern that the price creates after a downtrend or an uptrend matters.
In ACEN's case, after a long downtrend, the price created a FALLING WEDGE pattern. Falling Wedge pattern is a bullish reversal pattern. This pattern does not magically appear from heaven. Haha! It was created by the price when the price moved up and down creating a trendline support and resistance.
Think of it this way. ACEN's price went 5.16 pesos to 2.42 pesos on a steady downtrend. From 2.42 it went up to 2.75. From 2.75 it went down to 2.39. From 2.39 it went up again to 2.63. From 2.63 it went down again to 2.36. It is moving up and down creating a narrow range. The range gets closer and closer. This happened from June to Aug. It went from an 8-month downtrend and suddenly it kept moving up and down on a narrow range in a matter of two months. Its a clear change of behavior to the price movement.
That is basically what this "reversal pattern" is trying to show you. There is no magic involved. Its a change on the price behavior/movement.
Lets talk about The Falling Wedge. Its basically a trendline resistance and trendline support. Your entry is on the breakout of the trendline resistance or the upper line of the falling wedge. You put a stoploss below the trendline support or the lower line of the falling wedge after your entry.
Currently, you enter if it breaks 2.60 pesos with a stoploss on 2.33 pesos. This is a Falling wedge pattern. Take note of the word "falling" which means the movement is dynamic. If it does not break 2.60 pesos then you will have other price to enter on depending which part of its trendline resistance is broken.
If you plan to trade this stock then you must measure from your entry price down to your stoploss price. That is basically your risk. That is the percentage you are risking in trading this pattern. If it breaks 2.60 pesos and you have your stoploss at 2.33 then you are risking a 10 percent loss.
No entries should be made unless the price breaks the upper line/ trendline resistance.
As the price keep moving on a narrow range, the risk will keep getting smaller and smaller. Put this stock on your watchlist. Observe what happens to it. I hope this analysis helps you. May you trade well.
Traders Den PH
blogs.tradersdenph.com
blogs.tradersdenph.com
Disclaimer
The information and publications are not meant to be, and do not constitute, financial, investment, trading, or other types of advice or recommendations supplied or endorsed by TradingView. Read more in the Terms of Use.
Traders Den PH
blogs.tradersdenph.com
blogs.tradersdenph.com
Disclaimer
The information and publications are not meant to be, and do not constitute, financial, investment, trading, or other types of advice or recommendations supplied or endorsed by TradingView. Read more in the Terms of Use.